
Midyear Excess Returns: Too little or just not losing?
We look at running excess returns for credit layers as tight spreads still mean reliance on a coupon and the UST curve.


Below we update excess returns for the end of the quarter and 1H25 period. We have already reviewed the midyear numbers in detail through Friday (6-27-25) for asset returns (see Footnotes & Flashbacks: Asset Returns 6-29-2025) and spreads (see Footnotes & Flashbacks: Credit Markets 6-30-25) and the overall state of affairs in the markets (see Mini Market Lookback: Eye of the Beholder 6-28-25).
The idea is to always get paid more in excess return for taking more credit risk, and that worked reasonably enough for IG vs. HY YTD 2025. It starts to break down across the HY tiers with the BB tier offering the best risk-adjusted return profile.
The B tier has had a rough time in the relative value equation this year as spreads were down to June 2007 levels as 2025 began after visiting even lower levels in fall 2024 (+254 bps in Nov 2024) before ending 2024 just under 300 bps (Footnotes & Flashbacks: Credit Markets 2024 1-3-25). For the YTD period June 30, B tier OAS was around 9 bps wider after the June 2025 rebalancing effects.
As was the case to begin 2025, the 3Q25/2H25 period kicks off with very tight overall HY OAS at +296 bps, which is just under where the bubble month of June 2007 ended (+298 bps). That makes for a high stakes summer with tariffs, the Fed, and the moving parts of the macro picture still a debate with the consumer right at the top of that risk list.

The above chart posts the running cumulative excess returns for IG vs. HY. While one can debate the magnitude of the expected excess returns at any given point in an economic cycle and credit cycle, at least HY is proportionately higher than IG (see HY and IG Returns since 1997 Final Score for 2024 1-2-25, HY and IG Returns since 1997: Four Bubbles and Too Many Funerals 12-31-24, HY Multicycle Spreads, Excess Returns, Total Returns 12-5-23).
The wild dip in April with Liberation Day is worth remembering since many people seem to forget that the entire methodology has absolutely nothing to do with “reciprocal” and everything to do with the trade deficits and Trump’s fixation on making those go away (see Reciprocal Tariff Math: Hocus Pocus 4-3-25). The effectiveness of making “reciprocal” stick in the minds of his MAGA base has been impressive. “Reciprocal” sounds better than “concept free pet peeve.” Just keep repeating it.
The takeaway should be that shoehorning in tariffs to make imports too expensive will bring economic damage in the form of higher costs for small, medium and large businesses as well as inflation to consumers. That will just have play out to make more believe it. The cost mitigation actions that will inevitably come could hit jobs or “someone else’s revenues,” but first the working capital cycles needs to bring the prices or expenses.

The above chart shows the relationship of the BB excess return vs. the BBB tier, and that also worked out well enough in relative risk compensation. The BBB tier seemed immovable for many periods, but the BBB tier overall did widen +6 bps YTD. The BB tier tightened by -15 bps YTD.
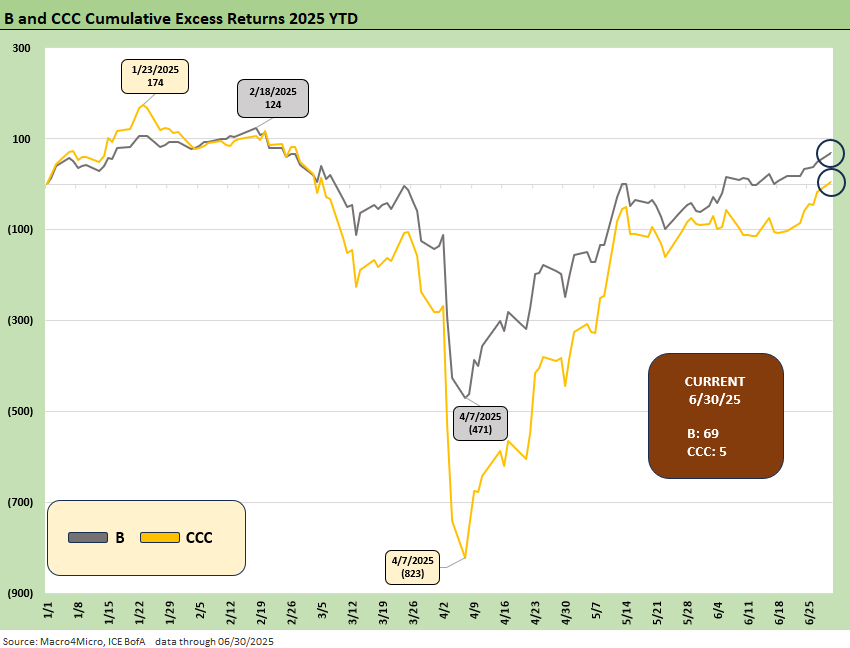
The above chart highlights the B vs. CCC tier, and the B tier was comfortably ahead with both showing weak absolute levels of excess returns in broader context and well behind the BB tier and overall HY index.
See also:
Footnotes & Flashbacks: Credit Markets 6-30-25
Footnotes & Flashbacks: State of Yields 6-29-25
Footnotes & Flashbacks: Asset Returns 6-29-25
Mini Market Lookback: Eye of the Beholder 6-28-25