
1Q25 GDP: Final Estimate, Consumer Fade
The final 1Q25 GDP brings a negative consumer story and an unsightly 1Q25 PCE price index ahead of May PCE tomorrow.


Is the consumer bailing?
We see an anemic final GDP cut for 1Q25 at a -0.5% contraction with Personal Consumption Expenditures taking a downward hit to only +0.5% from +1.2% in the second estimate, which was also down from +1.8% in the first estimate. That is down from +4.0% PCE in 4Q24 and +3.7% in 3Q24.
We get a fresh read on PCE inflation on Friday along with Personal Income and Outlays after the April read showed solid income but defensive consumption (see PCE April 2025: Personal Income and Outlays 5-30-25).
The PCE price index for 1Q25 at +3.7% and Core at +3.5% for 1Q25 is not reassuring with initial tariffs slowly rolling into working capital cycles and waves of reciprocal and Section 232 tariff plans on deck.
At some point, real transaction flow will more fully settle the debate on whether sharply higher unit costs from tariffs flow into profit margins via higher expenses or into pricing – or both – and where along the economic chain more of the costs are absorbed.
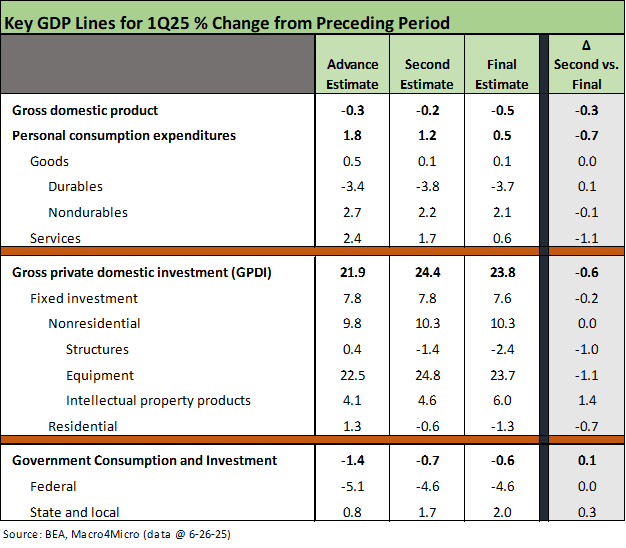
The above chart frames the GDP line item deltas for the final estimate vs. the second estimate. We detail the changes in the right column across the key GDP lines from PCE to Gross Private Domestic Investment (GPDI) to Government Consumption and Investment.
The headline numbers can be useful, but we tend to go straight to the PCE lines and Fixed Investment lines. We see negative variances in PCE at -0.7 and GPDI at -0.6 lower. In Nonresidential fixed investment, we see Structures and Equipment both post negative moves in the final estimate with a partial offset by IP product investment. Residential is also negative. Based on GPDI deltas, the tariff plan has not set off a rush to invest yet. In the Government lines, the Federal reductions were flat and still weighed in at -4.6% for the final estimate. State and local ticked higher with the final estimate.
The final “distortion lines” found in Private Inventory investment and trade deficits can be seen in Table 2 of the release for their “contributions to percent change in real GDP.” These swing factors can materially move the headline number (see 3Q22 GDP: It’s the Big Little Things 10-27-22).
We see +2.59% for inventories and -4.61% for “net exports of goods and services. Those two lines combine for a -2.07% hit to headline GDP. That still leaves “ex-distortion” GDP numbers below 2% which is right in the zone of the recent forecasts for 2025 from the median Fed forecast, the World Bank and the OECD. Those are just some of the reports detailing the expected adverse impact of the tariff program on global and US growth via impaired trade flows and rising costs (see FOMC Day: PCE Outlook Negative, GDP Expectations Grim 6-18-25).

The above table updates the running history of the GDP line items from 1Q21 when the post-COVID stimulus wave from 2020 and then 2021 fed into demand growth. Stimulus and relief actions set off demand drivers that were not adequately considered in the context of supply. The contraction in 1Q25 has plenty of distortions in it as we covered in the first two estimates (see 1Q25 GDP 2nd Estimate: Tariff and Courthouse Waiting Game 5-29-25, 1Q25 GDP Advance Estimate: Roll Your Own Distortions 4-30-25).
The idea that “the whole supply and demand thing” is a bit lofty for the average politician is not news (and notably the typical House type), and the tariff themes are still a matter of party loyalty (“seller pays” “no inflation risk” and “Trump 1.0 was the greatest economy in history” despite tariffs). We have already picked over the actual asset performance of 2018-2019 and Fed action in other commentaries and what they meant (see links below or Histories: Asset Return Journey from 2016 to 2023 1-21-24, Past-Prologue Perspective for 2025: Memory Lane 2018 6-5-25).
Political point scoring over the short term (whether GOP or Dems) often takes precedence over prudent fiscal policy. That was true of excess stimulus, which is easier to understand than tariffs. Tariffs are more complicated in framing the impact on consumers since there is a reason that a tariff program of this scale has never been tried before. The reasons are well known (bad for the economy and was a catalyst for a worsening Depression with Smoot Hawley in 1930, etc.). In the end, the political loyalty tests require adherence to the chronic misinformation on the tariff topic.
Pricing, consumption, and the tariff blues….
The summer and fall will offer some cures to the disinformation tactics that beg you to look backward and avoid forward thinking. A basic fact check and concept filter on the border tax-to-expense-to-pricing impact helps in framing the uncertainties in the flow of decisions from seller to importer to customer. We have addressed those in other commentaries, but the important question that many small businesses have used is “Who writes the check?” That question is harder to “talk around” and reframe (A Bessent specialty).
That sharing of “economic costs” is an assumption-driven analysis. What is not an assumption but is a fact is that the buyer “writes the check” that is collected by customs. This means that Trump’s insistence that the US Treasury “collected hundreds of billions from selling nations” explicitly and factually is false (aka a lie). The words “collected from” are also key “fact words.” The verbal gymnastics that go into spinning “who pays the tariff” combines dishonesty with perhaps a dose of ignorance. Repetition comes first and facts are well down the list of priorities.
In the end, the winners and losers list will all come down to the economics of the assigned tariffs and how they frame up from seller to the end markets. The brief stop at the border for a tariff is just part of a complex process. It would be easier to have faith in the assumptions if the tariff advocates did not lie at step 1.
See also:
GDP comments:
1Q25 GDP 2nd Estimate: Tariff and Courthouse Waiting Game 5-29-25
1Q25 GDP Advance Estimate: Roll Your Own Distortions 4-30-25
4Q24 GDP: The Final Cut 3-27-25
Trump's “Greatest Economy in History”: Not Even Close 3-5-25
Gut Checking Trump GDP Record 3-5-25
4Q24 GDP: Inventory Liquidation Rules 1-30-25
Presidential GDP Dance Off: Clinton vs. Trump 7-27-24
Presidential GDP Dance Off: Reagan vs. Trump 7-27-24
Markets:
Footnotes & Flashbacks: Credit Markets 6-23-2025
Footnotes & Flashbacks: State of Yields 6-22-2025
Footnotes & Flashbacks: Asset Returns 6-22-2025
Mini Market Lookback: FOMC Spoke Clearly, Iran and Trump up next 6-21-25