Footnotes & Flashbacks: Asset Returns 4-12-25
Despite the rally for equities, duration was pummeled, and both debt and equity are all negative for the trailing 1-month.
Let me introduce you to my trade negotiator. He will explain your choices.
The week was a happy one for equities in relative context but ugly for debt. The equity rally does not change the facts of a brutal trailing 1-month and rolling 3-month performance or the realities of the turbulence ahead from the tariffs in place, those on pause, and those in the queue.
Duration was spanked this week, and the color from the markets on inflation expectations included Fed worries around potential 4% inflation in 2025.
The overall balance of risks is not making for a smooth game plan on diversification across debt and equities if stagflation does rear up (see Mini Market Lookback: Trade’s Big Bang 4-12-25).
Trump offered up some favorable exemptions on Friday night on electronics, phones, computers and chips that will help moods but need some more fleshing out on his next round of tariff targets. Consistency, concepts, or facts have not been a hallmark to this point.
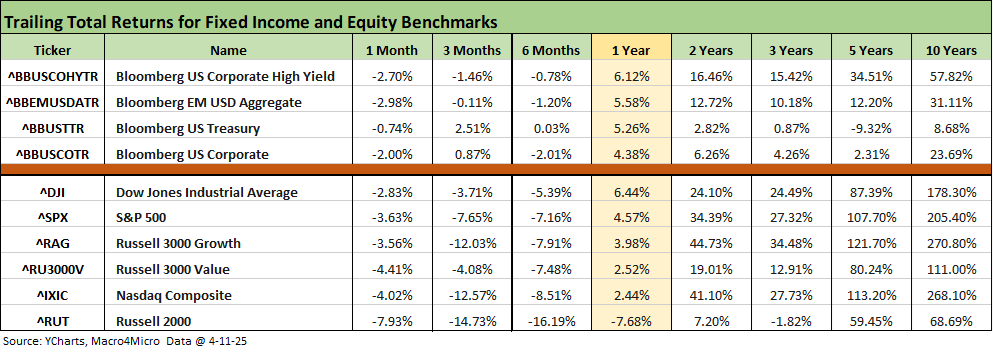
The above chart updates the returns for the high-level debt and equity benchmarks we watch. It is safe to say nothing has worked the past 1-month as cyclical debates heat up and tariffs send the market into high vol mode and utter confusion and anxiety. Fundamental risk has been punished in equity and credit while the UST curve has not offered diversified shelter in the form of flight to quality even over the 1-month, 3-months, or 6-months timelines. Everything seems to lose lately. “Everything loses” is a taste of what a stagflation trend would bring and notably in the context of real returns.
For the 3-month period, we saw a minimal single-digit return for UST over the 3-month period with sub-1% returns for IG Corporates over 3-months. For 6-months, we saw a negligible positive return of +0.03% for UST. Equities were all negative for 1,3, and 6 months after some benchmarks posted solid peaks in early 2025. The policy panic sent returns into the tank.
The rolling return visual
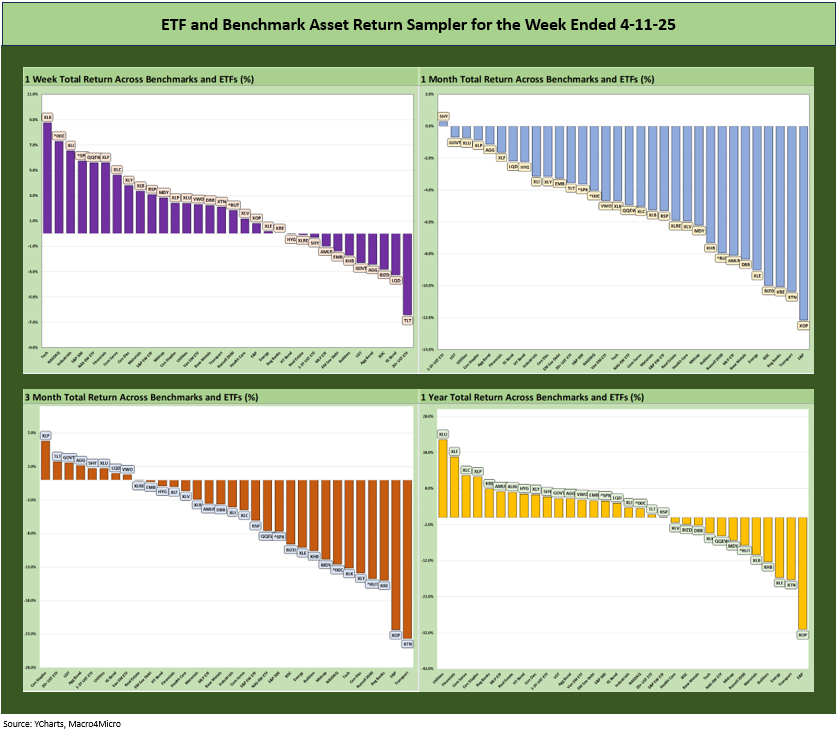
In the next section, we get into the details of the 32 ETFs and benchmarks for a mix of the trailing periods. Below we offer a condensed 4-chart view for an easy visual on how the mix of positive vs. negative returns shape up. This is a useful exercise we do each week looking for signals across industry groups and asset classes.
The shift to the right (as in more negative returns) has spread to the 1-year time horizon after a long stretch of numbers such as 32-0, 31-1, and 30-2. The 1-month and 3-months visuals are unsightly at this point.
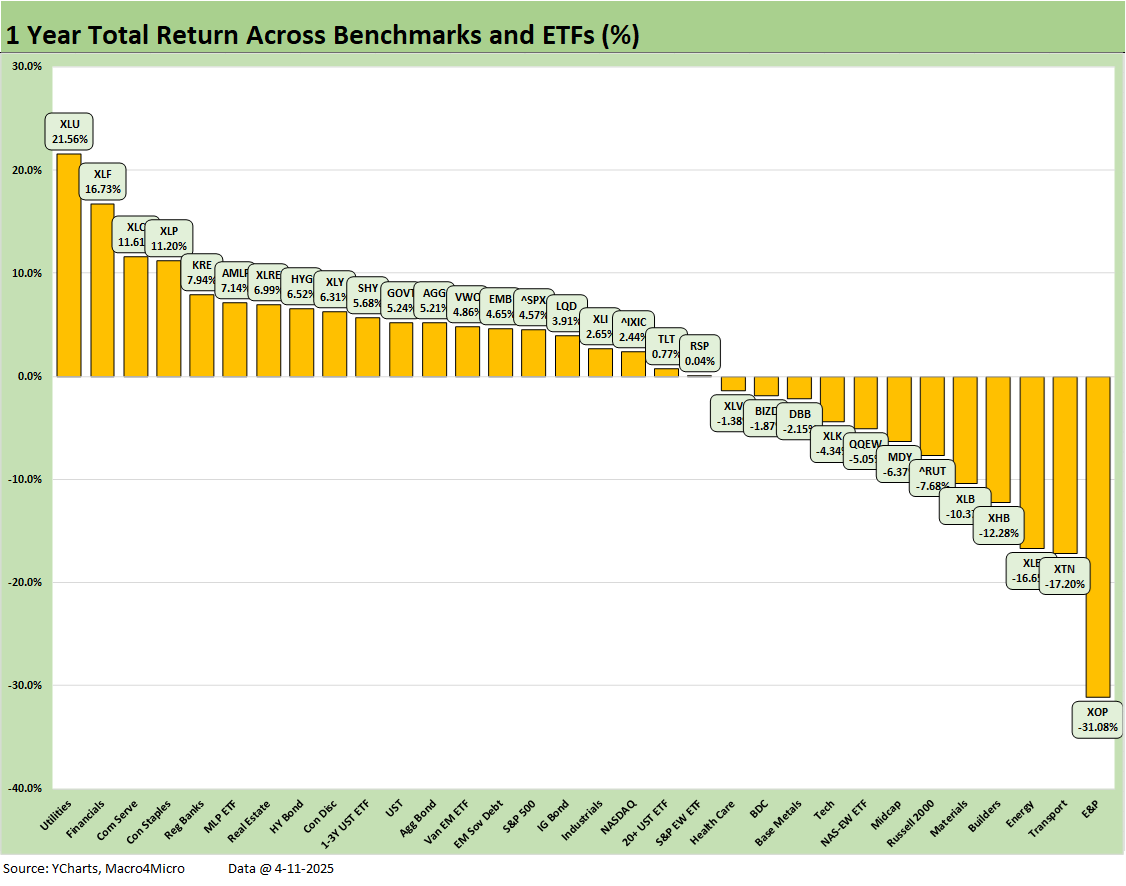
The trailing 1-year is now 20-12 with the small cap Russell 2000 and Midcaps in negative return range and in the bottom quartile while NASDAQ is at a low 2% handle in the 3rd quartile and the S&P 500 in the low end of the 2nd quartile at +4.6%.
For the S&P 500, we offer a reminder that the trailing 1-year numbers come on the heels of the first back-to-back annual returns over 20% for the SPX since the late 1990s. That is a record that we don’t expect to hear more about as the dystopian descriptions of the Biden years continue to emanate from “tariff central.”
The Magnificent 7 heavy ETFs…
Some of the benchmarks and industry ETFs we include have issuer concentration elements that leave them wagged by a few names. When looking across some of the bellwether industry and subsector ETFs in the rankings, it is good to keep in mind which narrow ETFs (vs. broad market benchmarks) get wagged more by the “Magnificent 7” including Consumer Discretionary (XLY) with Amazon and Tesla, Tech (XLK) with Microsoft, Apple, and NVIDIA, and Communications Services (XLC) with Alphabet and Meta.
We already reviewed the tech bellwethers in Mini Market Lookback: Trade’s Big Bang (4-12-25). A great week does not negate the ugly month and 3-months. The latest exemptions issued Friday night by Team Trump that hit the screen on Saturday should offer some more relief in tech.
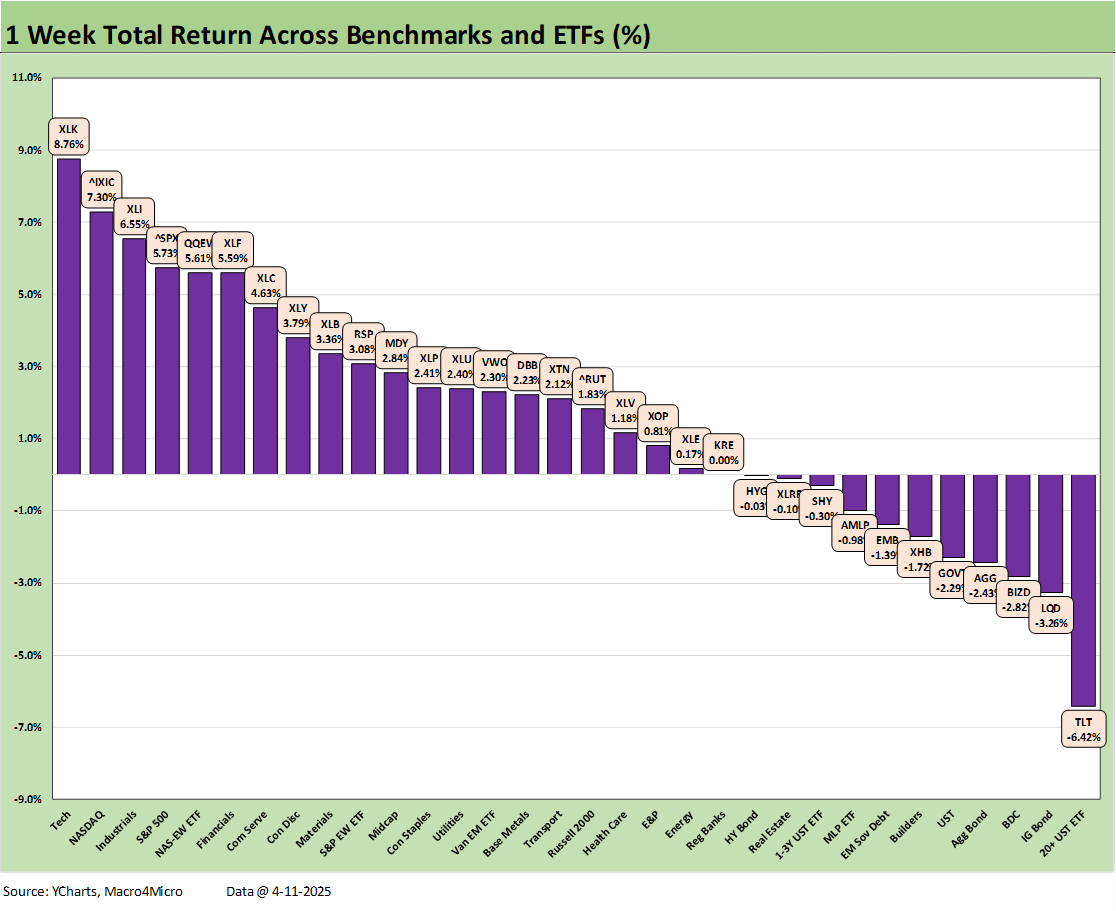
We already looked at the 1-week mix in Mini Market Lookback: Trade’s Big Bang (4-12-25), and we at least see the rebound in tech heavy ETFs and benchmarks along with Industrials (XLI) and Financials (XLF).
On the low return end, the UST shift beat up duration with TLT a distant last place. The bottom quartile has 5 of the 8 comprised of bond ETFs along with the BDC ETF (BIZD), Homebuilders (XHB) and Midstream Energy (AMLP).
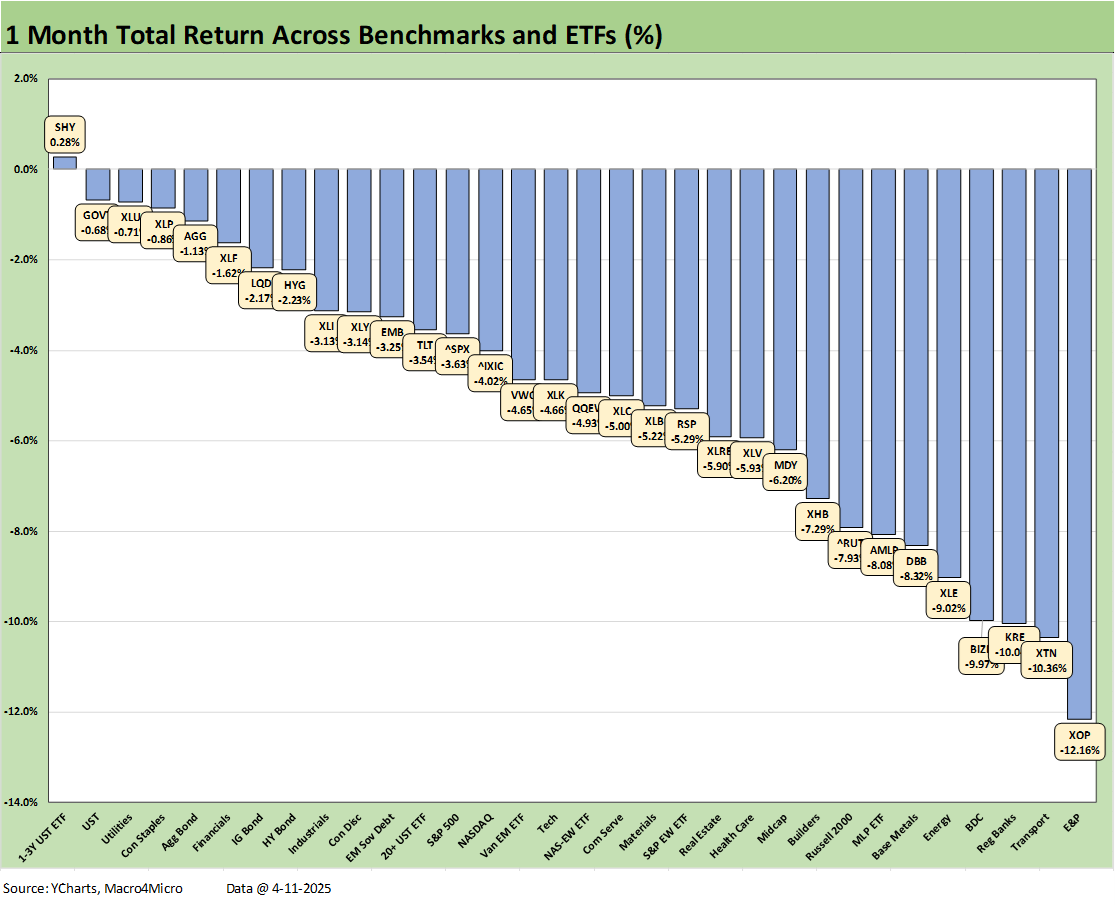
The 1-month time horizon shows a brutal 1-31 score with the short UST 1-3Y ETF the only line barely in positive range. We see 5 bond ETFs in the top quartile with Utilities (XLU), Consumer Staples (XLP) and the Financials ETF (XLF) in the top tier.
The bottom of the return mix shows 3 in the double digit negative zone with E&P (XOP) on the bottom at -12.1% joined in the double-digit negative bucket by Transports (XTN), and Regional Banks (KRE) with the BDC ETF (BIZD) a near miss at -9.97%.
As covered at the start of this commentary, the rolling 3-months was grim, and we see that in the 8-24 score above. The top tier had 5 bond ETFs with the defensive Consumer Staples ETF (XLP) at #1, Utilities (XLU) at #6, and the China-heavy EM Equity ETF (VWO) at #8.
The bottom tier has been pounded over 3-months with the Transport ETF (XTN) at -23.6% on the bottom just ahead of E&P (XOP) at -22.3%. The top of the bottom quartile shows Midcaps (MDY) at -11.8% just ahead of the NASDAQ at -12.5% with small caps Russell 2000 (RUT) a few more notches below at -14.7%. Those 3 indexes in double-digit negative range in the bottom tier shows the breadth of concern. The remaining members of the bottom tier include the Tech ETF (XLK), Regional Banks (KRE), and Consumer Discretionary (XLY) with its Tesla and Amazon exposure. That mix underscores the range of the pain across diverse industry groups.
We earlier discussed the dramatically different profile in the positive vs. negative returns mix. The 20-12 score for the LTM numbers are a long way from where the mix was to start the year when we saw 30-2 for 1 year and 31-1 for the trailing 2 years (see Footnotes & Flashbacks: Asset Returns for 2024 1-2-25).
The LTM winners in the top quartile include a sole tech-based ETF with Communications Services (XLC) at #3 behind Utilities (XLU) at #1 and Financials (XLF) at #2. We see other defensive names in the mix including Consumer Staples (XLP) and some rate-sensitive income-oriented sectors such as Real Estate (XLRE).
Regional Banks (KRE) squeezed into the top tier lineup despite some recent volatility on the post-election deregulatory theme and potential consolidation, but regional banks have been taking a beating the past 3 months in 2025. HY (HYG) was the sole bond ETF in the top quartile at #8 while the high-income Midstream Energy (AMLP) also made the top tier.
For the bottom tier of the trailing 1-year above, we see the E&P ETF (XOP) on the bottom at a distant -31.1% with the Energy ETF (XLE) 3 off the bottom. We see Transports (XTN), Homebuilders (XHB), and Materials (XLB) rounding out the bottom 5 with double-digit negatives. Small caps and Midcaps are in the bottom quartile in the red, and that sends bad cyclical signals. The damage was done in the trailing 3-months of 2025 as covered above.
See also:
Mini Market Lookback: Trade’s Big Bang 4-12-25
Tariffs, Pauses, and Piling On: Helter Skelter 4-11-25
CPI March 2025: Fodder for Spin 4-10-25
Credit Snapshot: Avis Budget Group (CAR) 4-9-25
Footnotes & Flashbacks: Credit Markets 4-6-25
Footnotes & Flashbacks: State of Yields 4-6-25
Footnotes & Flashbacks: Asset Returns 4-6-25
Mini Market Lookback: A Week for the History Books 4-5-25
Payroll March 2025: Last Call for Good News? 4-4-25
Payrolls Mar 2025: Into the Weeds 4-4-25
Credit Snapshot: AutoNation (AN) 4-4-25
Credit Snapshot: Taylor Morrison Home Corp (TMHC) 4-2-25
JOLTS Feb 2025: The Test Starts in 2Q25 4-2-25
Credit Snapshot: United Rentals (URI) 4-1-25
Mini Market Lookback: The Next Trade Battle Fast Approaches 3-29-25
PCE Feb 2025: Inflation, Income, Outlays 3-28-25
4Q24 GDP: The Final Cut 3-27-25
Durable Goods February 2025: Preventive Medicine? 3-26-25
New Homes Sales Feb 2025: Consumer Mood Meets Policy Roulette 3-25-25
KB Home 1Q25: The Consumer Theme Piles On 3-25-25
Lennar: Cash Flow and Balance Sheet > Gross Margins 3-24-25
Mini Market Lookback: Fed Gut Check, Tariff Reflux 3-22-25
Existing Homes Sales Feb 2025: Limping into Spring 3-20-25
Fed Action: Very Little Good News for Macro 3-19-25
Industrial Production Feb 2025: Capacity Utilization 3-18-25
Housing Starts Feb 2025: Solid Sequentially, Slightly Soft YoY 3-18-25
Retail Sales Feb 2025: Before the Storm 3-17-25
Mini Market Lookback: Self-Inflicted Vol 3-15-25
Credit Spreads: Pain Arrives, Risk Repricing 3-13-25
Tariff and Trade links:
Tariffs: Some Asian Bystanders Hit in the Crossfire 4-8-25
Tariffs: Diminished Capacity…for Trade Volume that is…4-3-25
Reciprocal Tariff Math: Hocus Pocus 4-3-25
Reciprocal Tariffs: Weird Science Blows up the Lab 4-2-25
Tariffs: Stop Hey What’s That Sound? 4-1-25
Tariffs are like a Box of Chocolates 4-1-25
Auto Tariffs: Questions to Ponder 3-28-25
Fed Gut Check, Tariff Reflux 3-22-25
Tariffs: Strange Week, Tactics Not the Point 3-15-25
Trade: Betty Ford Tariff Wing Open for Business 3-13-25
Auto Suppliers: Trade Groups have a View, Does Washington Even Ask? 3-11-25
Tariffs: Enemies List 3-6-25
Happy War on Allies Day 3-4-25
Auto Tariffs: Japan, South Korea, and Germany Exposure 2-25-25
Mini Market Lookback: Tariffs + Geopolitics + Human Nature = Risk 2-22-25
Reciprocal Tariffs: Weird Science 2-14-25
US-EU Trade: The Final Import/Export Mix 2024 2-11-25
Aluminum and Steel Tariffs: The Target is Canada 2-10-25
US-Mexico Trade: Import/Export Mix for 2024 2-10-25
Trade Exposure: US-Canada Import/Export Mix 2024 2-7-25
US Trade with the World: Import and Export Mix 2-6-25
The Trade Picture: Facts to Respect, Topics to Ponder 2-6-25


