
Footnotes & Flashbacks: State of Yields 4-13-25
A rough week for duration as a steepening rattled a UST market facing record deficits, debt, and interest expense.


Moving from inverted to steep has its good and bad points…
The week saw the UST curve steepening combine with recent sustained dollar weakness to rattle policy makers, and Trump in turn moved to pause the reciprocal tariff insanity. He also carved out some tech-related tariffs from China as the tariff house of cards threatened to get blown down with so many critical growth markets impacted.
We saw the UST curve steepen (we update 2Y to 30Y below) while the 3M to 10Y moved out of inversion mode into upward sloping with 3M to 5Y less inverted. The supply-demand dynamics and the risks of slamming the two largest UST holders with tariffs (Japan, China) and hurling broad insults (on Signal or otherwise) and taking hostile actions against Europe (Ukraine, Greenland/Denmark) can become a problem if times worsen on the back of the Trump Tariff game plan. We tend to neglect the role of European entities as massive holders of UST.
Adverse trends in exchange rates and deteriorating performance of UST securities markets may see UST securities lose appeal to offshore investors with stagflation scenarios remaining a risk that is certainly not off the table. The fact that some sovereigns (notably Germany and Canada) will be jacking up their infrastructure and defense spending to reduce exposure to the US means they will have their own roles to play as net borrowers.
The old question will continue to haunt: If everyone is a borrower, who will be the lenders? Along that vein, who is the most dependent on foreign demand? (that would be UST). That has an element of emerging market flavor but for the UST!
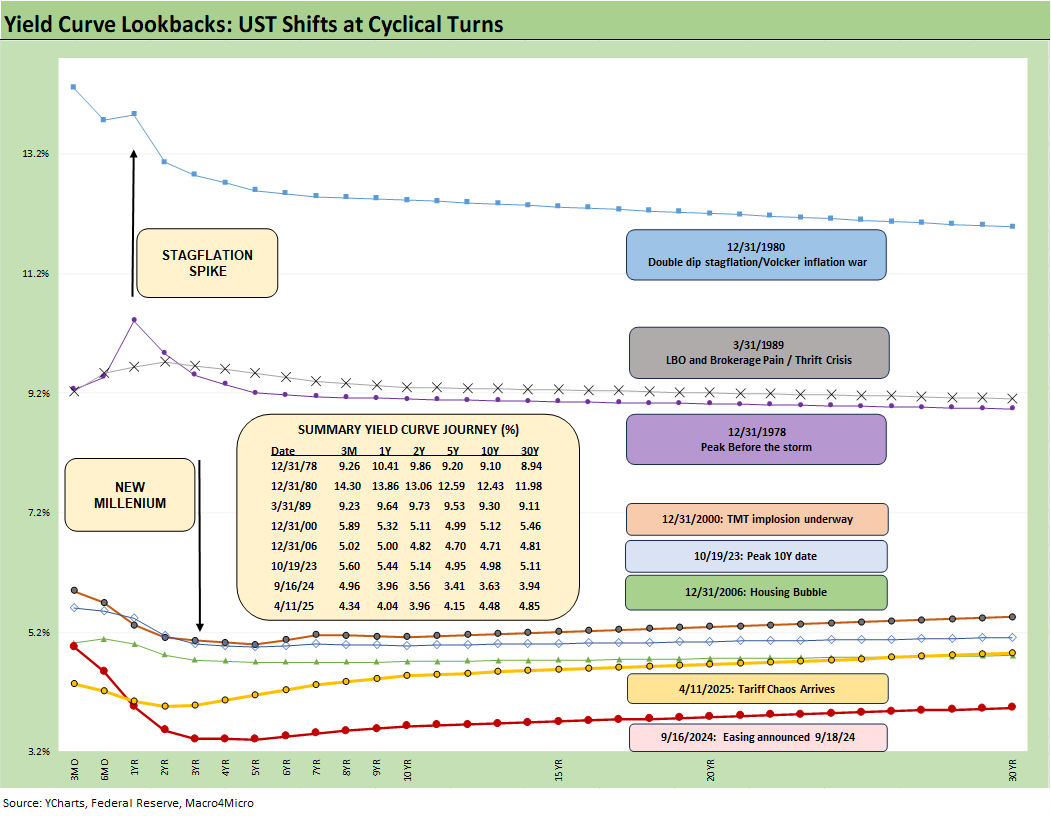
The above chart plots some key cyclical transition periods from the Carter inversion of 1978 across the Volcker years, the credit cycle peak in 1989, the TMT cycle in 2000, and the housing bubble in 2006. We then jump beyond the crisis period and the ZIRP years with the QE and normalization distortions to the Oct 2023 UST peak date on the 10Y UST.
We see the migration from the Sept 2024 lows up into what has been the latest in a series of bear steepening moves that started in 1H24 after the major UST and risk rally (equities and credit) of Nov-Dec 2023. That 1H24 steepener was before the rally into the Sept 2024 easing and then into the erratic yield curve movements of 2025 and the bond ETFs on-again, off-again performance battles.
Recession risk and/or flight to quality can drive rallies, but stagflation is a bond market crippler. Stagflation risks take us back to our early times in NYC in 1980 when the Misery Index (inflation + unemployment) hit 22% in June 1980. That translated into a double-dip recession.
The headlines on Friday covered the UMich consumer sentiment index as it dove back to near all-time lows. The index showed inflation expectations spiking for the 1-year time horizon (to 6.7%) for the highest expectations reading since 1981. The 5-year expectations were up to 4.4% from 4.1% with the head of the NY Fed saying this week that inflation could even hit 4% in 2025.
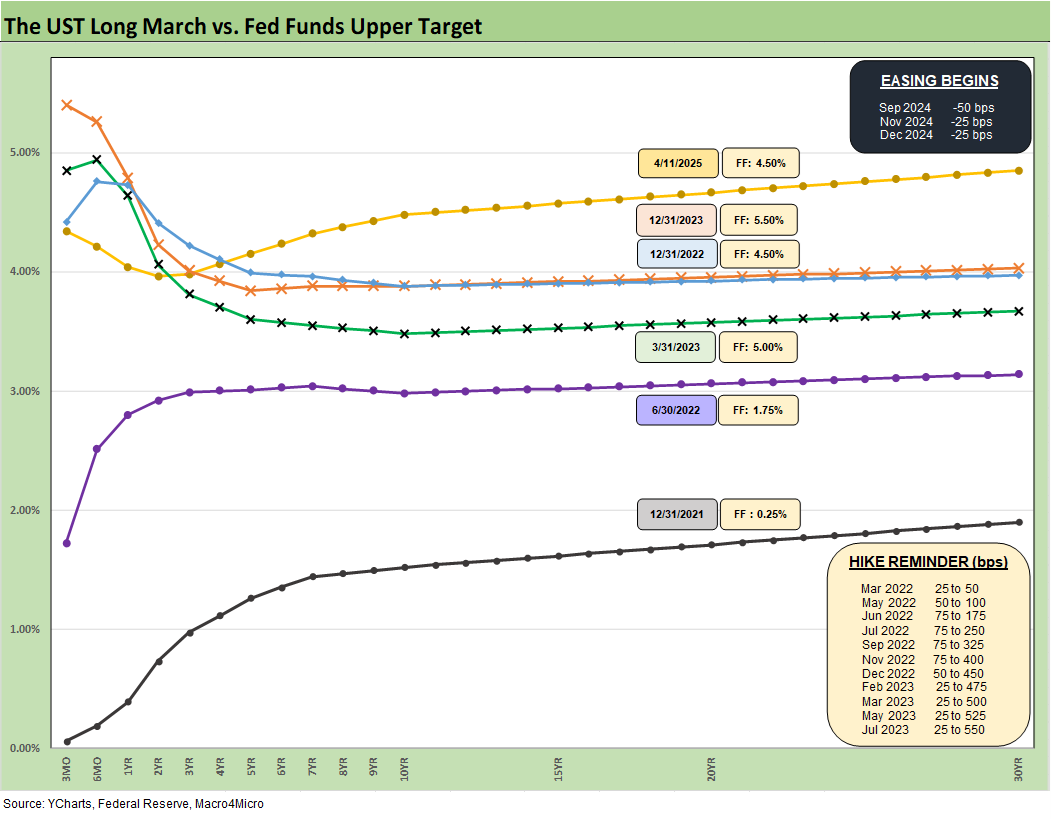
The above replays our weekly chart detailing the migration of the UST curve from 12-31-21 with memory boxes detailing the tightening dates and magnitude and more recently the easing. The UST curve is back in a bear steepening pattern often seen from the Sept 2024 lows, but fear is creeping into the shapeshifting at this point.
Initially, the tariff fear was about economic cycle and rate declines. Now the fear is morphing into “something else” whether stagflation anxiety, concerns over supply-demand imbalances or offshore sellers worried about the US on multiple fronts (the UST, the dollar, tariff destabilization of the US economy, etc.). The reduced demand from global asset reallocation could also simply be a function of Trump alienation as he makes more enemies across more governments that have their own domestic political needs and pressures.
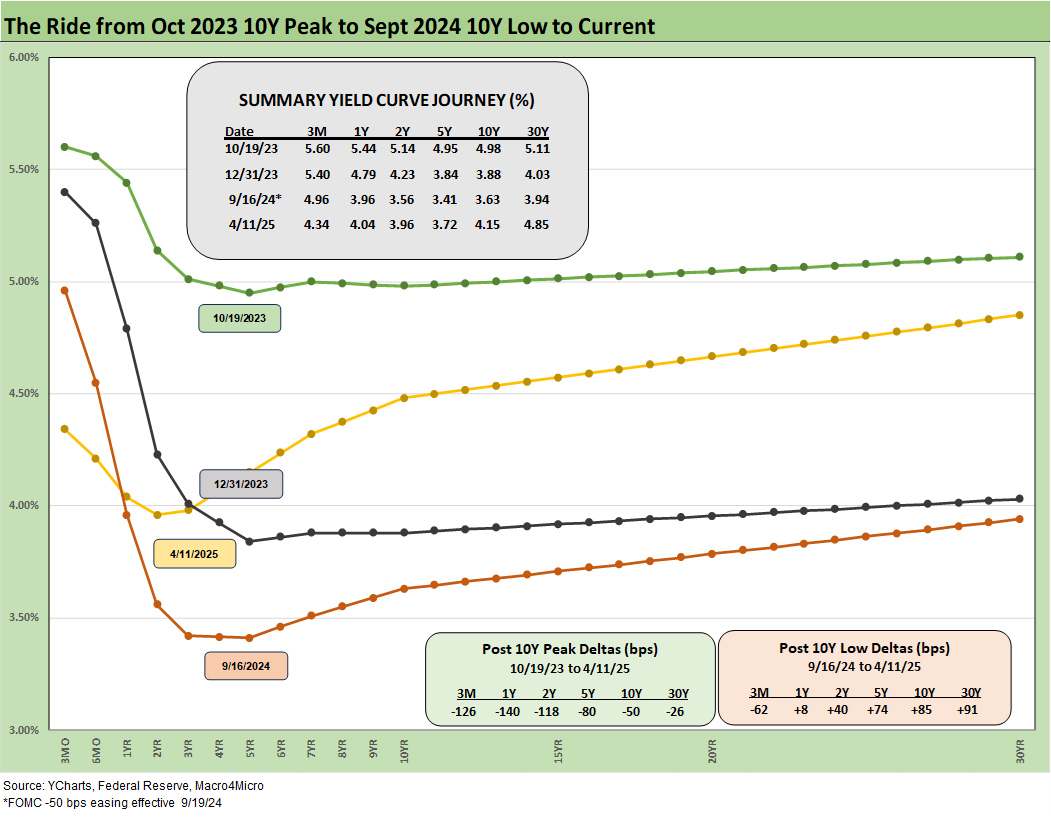
The above chart captures the sharp moves from the peak UST curve of 10-19-23 down into the major rally of Nov-Dec 2023 and then eventually into the lows of Sept 2024. The Sept 2024 lows only came after a bear steepener hit the curve through the summer of 2024. We then moved back into bear steepener mode until the tariffs hit the fan and initially sent 2Y to 30Y lower. Now we see rates materially higher in an adverse shift that hit bond ETFs this past week.
This is not an easy market given the complete lack of precedent and the waves of disinformation and partisan loyalty tests where “facts” are about faith and not empirical research. It is about “a reading from the book of Donald” and not Paul Samuelson or Graham and Dodd. It is murky on its best day.
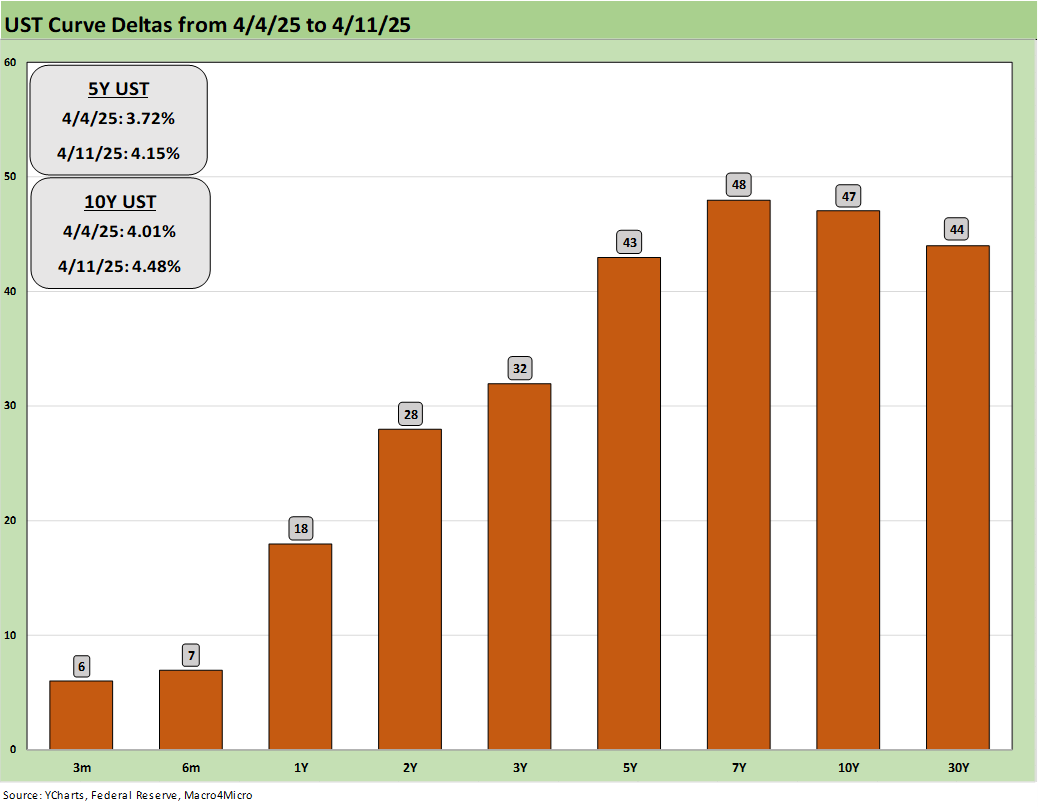
The above chart updates the 1-week UST deltas. That was one ugly week for rates.
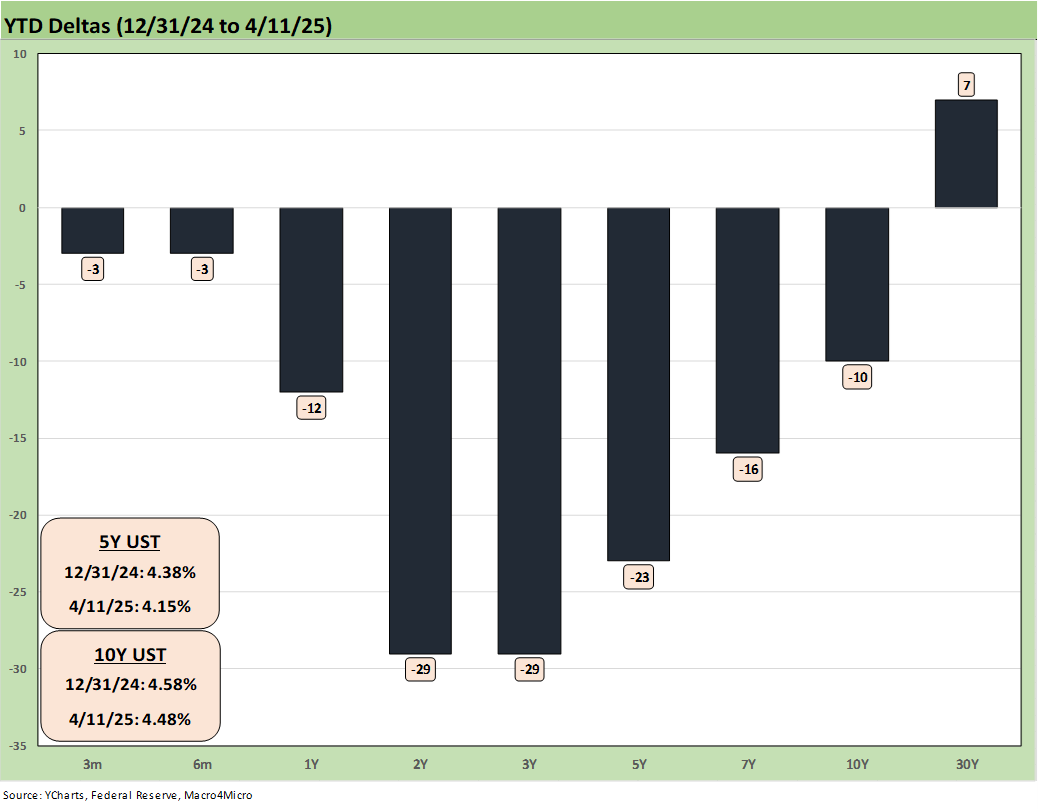
The above chart updates the YTD UST deltas that still show a bull steepening (despite the 30Y uptick) and helped bonds outperform for the rolling 3 months while equities were slapped around (see Footnotes & Flashbacks: Asset Returns 4-12-25).
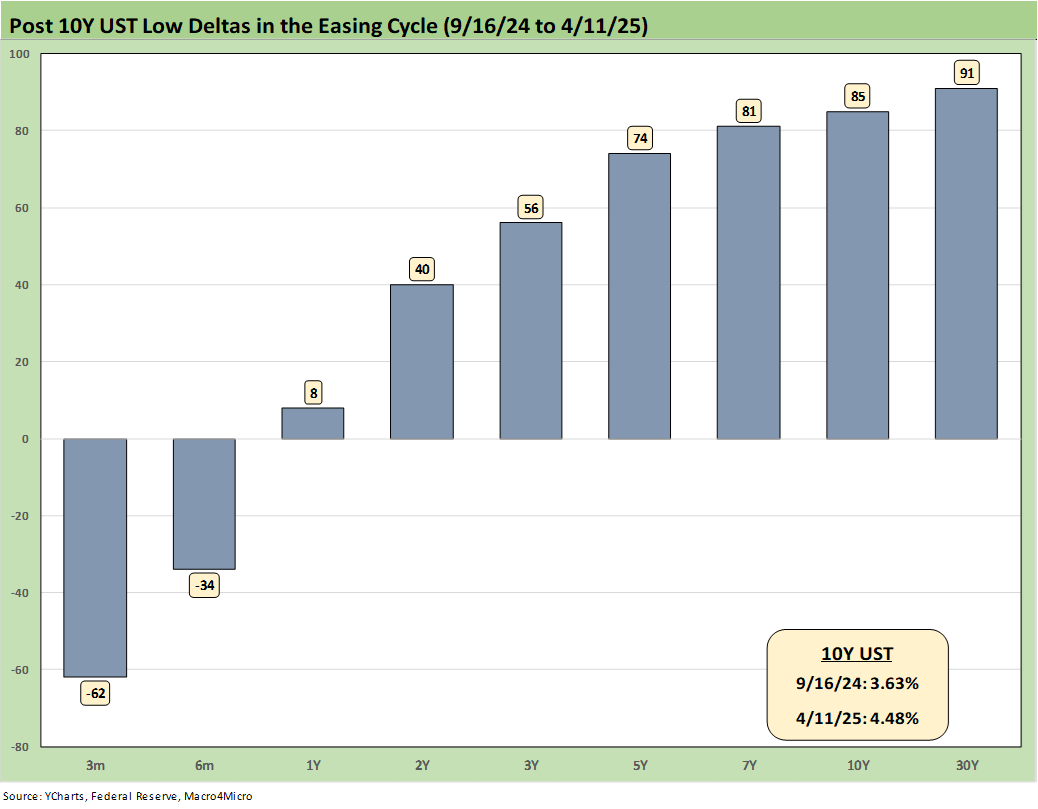
The above chart updates the UST deltas from the 9-16-24 lows. The bear steepener has not been kind to duration since then.
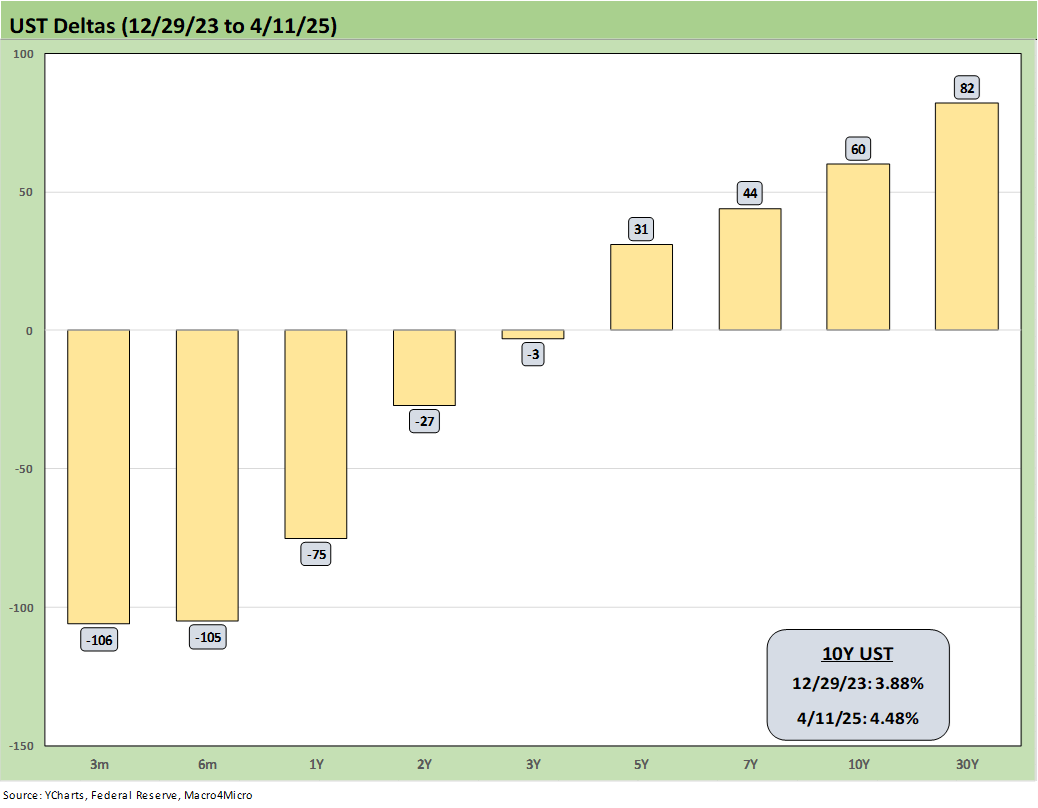
The above chart updates the UST deltas from the end of 2023 after a Nov-Dec rally that ran alongside a major spread tightening wave in HY and a rebound in equities. The 2024 consensus forecasts called for aggressive Fed easing, which mostly (not entirely) belatedly arrived late 2024. The consensus also called for a bull flattening in many 2024 forecasts, which did not arrive as of the year end after a good rally around easing time ahead of a fresh steepener as noted earlier in the Sept 2024 chart.
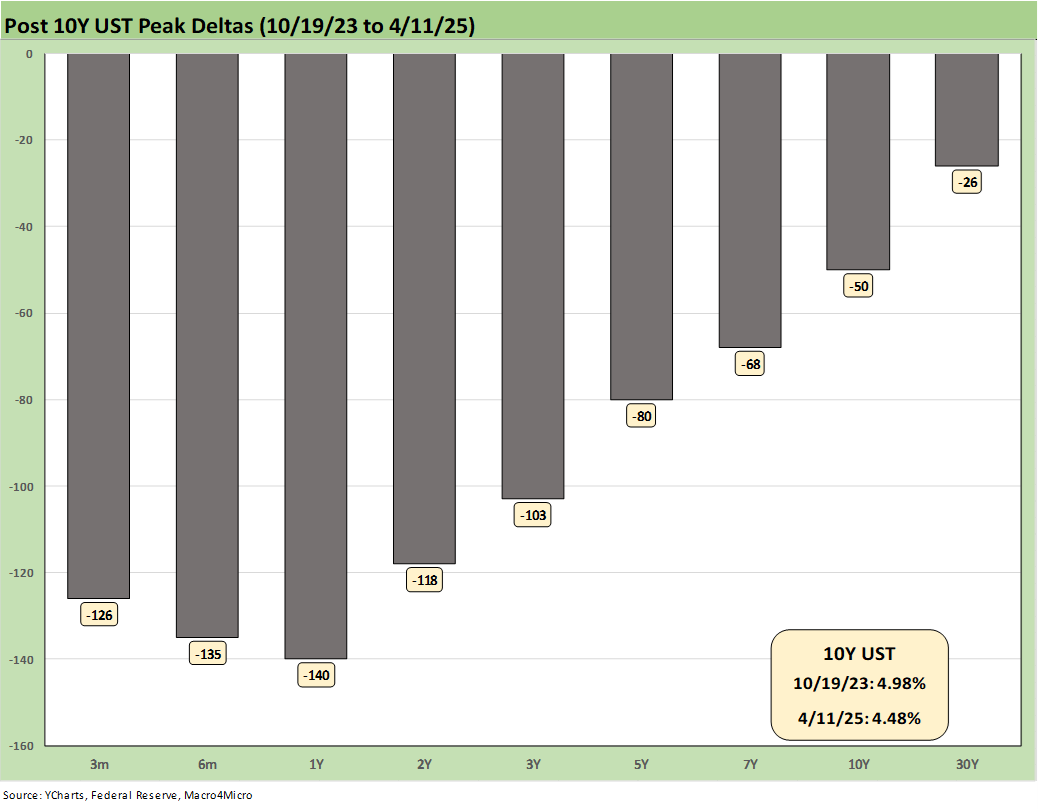
We update the post-peak (10-19-23) UST deltas above. When we consider a threat from higher rates now, just remember we started this process just under a 5.0% 10Y UST level in Oct 2023.
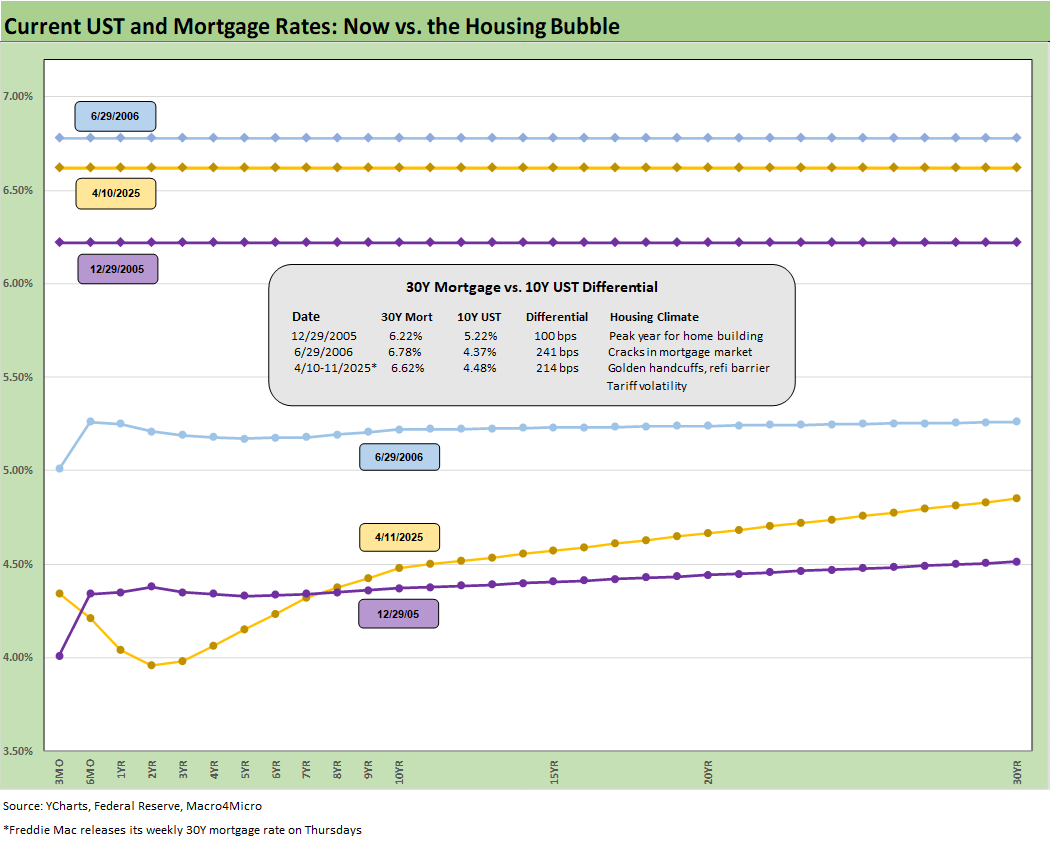
The above chart updates the UST curve for this past Friday and the Freddie Mac 30Y Mortgage benchmark rate (noon Thursday release). We include two useful historical periods including the peak homebuilder year end of 2005 and mid-2006 when RMBS quality concerns were catching headlines as the housing bubble was peaking.
We post UST curves for each period in the chart. We highlight that some useful indicators outside the sleepier Freddie benchmarks such as Mortgage News Daily were just under 7% on Thursday end of day and crossed 7% on Friday. So the Freddie benchmark above is not what people will be facing on Monday.
We recently added a column detailing the differential between the Freddie Mac 30Y and the 10Y UST. We saw that differential move lower this week to +214 bps from +263 bps. The10Y UST moved hard and fast on the week while the Freddie Mac rate tends to lag in such periods with its survey and mix. Freddie tends to be below the peak mortgage rates seen in other surveys. The year 2005 makes a statement on what the mortgage market was like back then in terms of originating “anything” and selling to “anyone” to bundle it and resell it to “anyone else.”
We had been seeing mortgage rates very slowly coming down again to the mid-6% area with this past week at 6.62% (-2 bps from the prior week). That is now shot by the steepening of the UST curve on tariff inflation fears and dislocations that can still haunt the UST curve. Mortgage spreads remain a headwind vs. earlier periods. The 7% rates seen on Friday are just another hit to monthly payments and affordability.
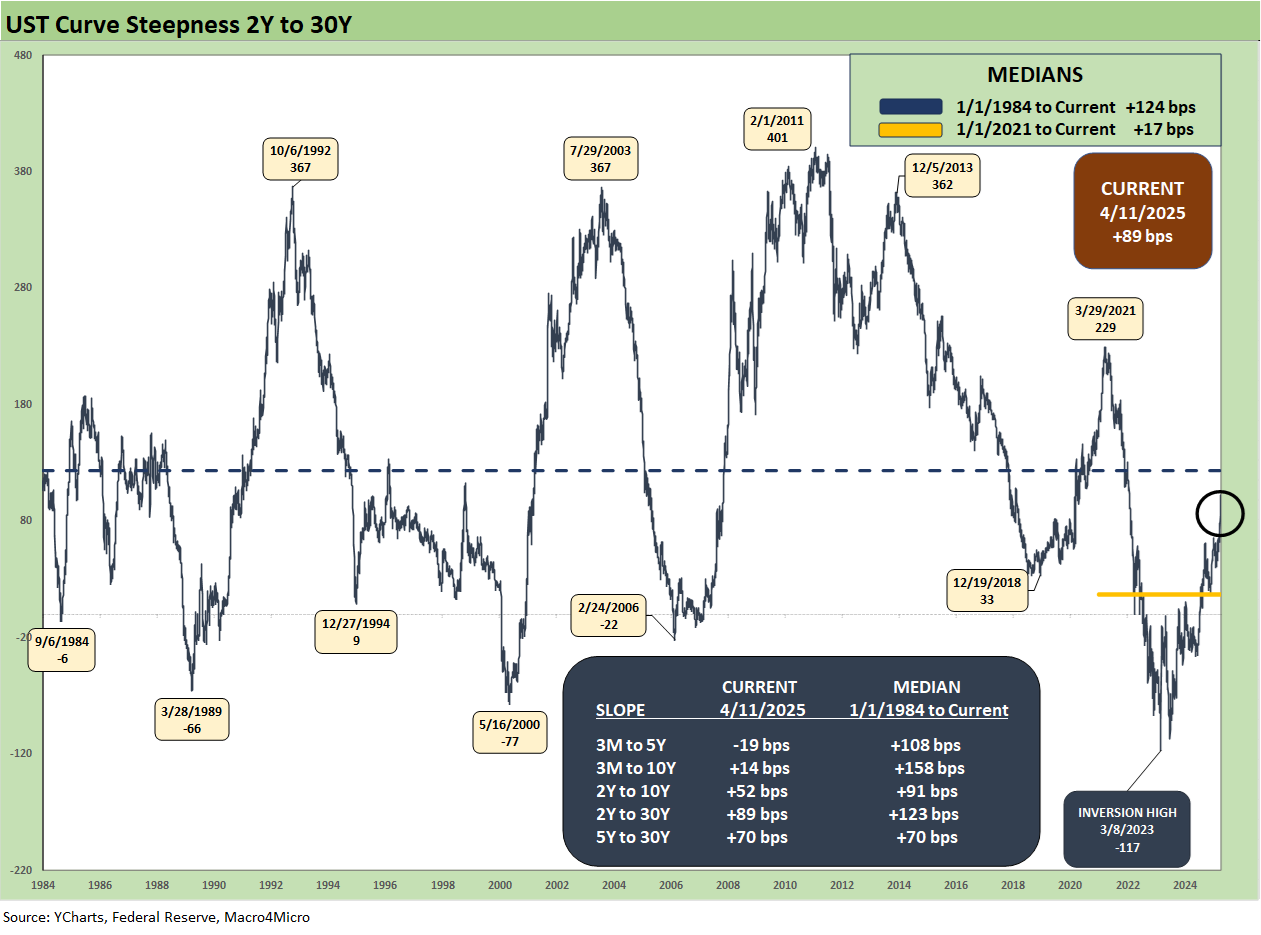
This week we update the 2Y to 30Y slope with the main theme being steepening and duration pain. We plot the long-term slope history above and we frame the +89 bps slope to end this week vs. the long-term median of +123 bps. The slope steepened from +73 bps last week.
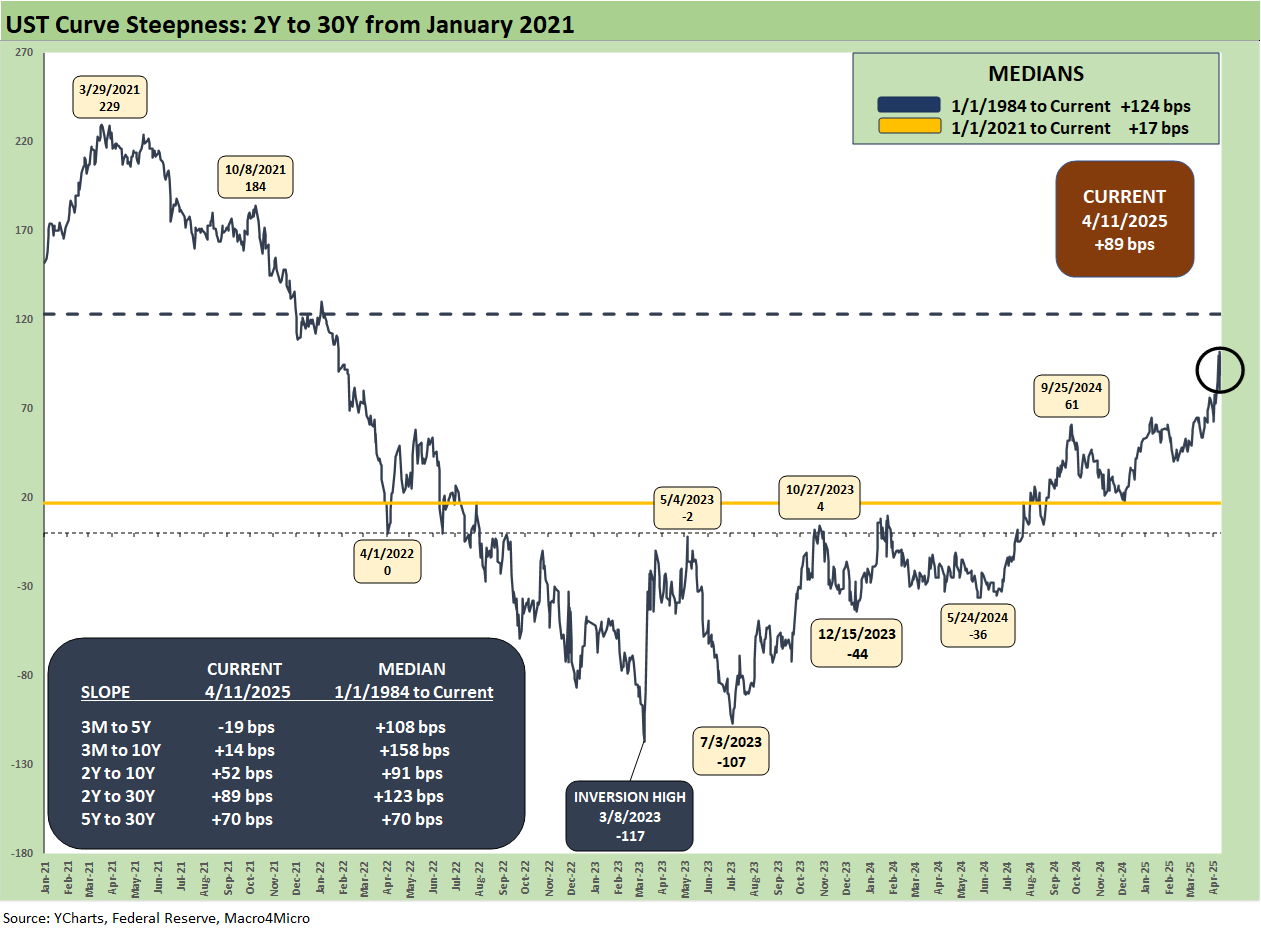
The above chart shortens the timeline from a ZIRP starting point in early 2021, and we see the wild ride to a peak of +229 bps in March 2021 down to a peak inversion of -117 bps in March 2023 then back to the current +89 bps.
The UST slopes and medians for other segments we watch are broken out in the box within the chart. This week we saw the 3M to 10Y break from inverted at -27 bps last week to upward sloping at +14 bps. For 3M to 5Y UST, we are still inverted but less so at -19 bps vs. -56 bps last week.
This has been tough for bond performance, but at least the UST migration is bringing the market back into a remotely rational term premium construct. We know that is reaching for a silver lining.
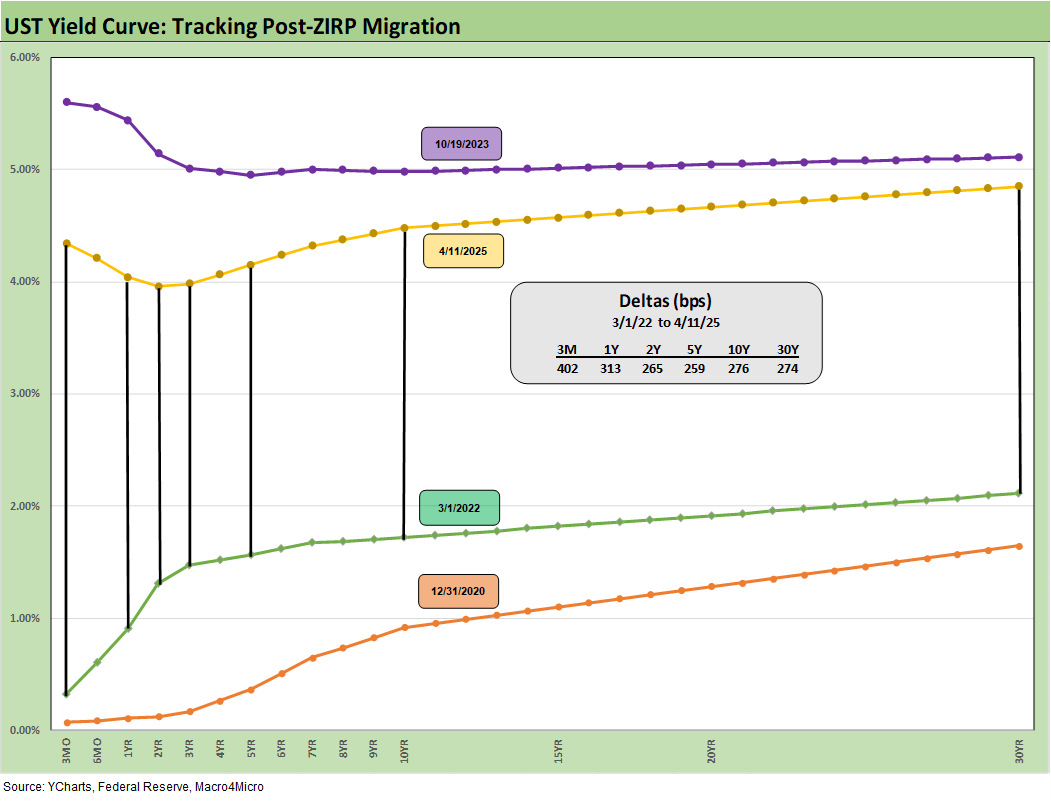
We wrap this week’s State of Yields with an update of the running UST deltas since March 1, 2022 just ahead of the end of ZIRP (effective 3-17-22). We include the 12-31-20 UST curve and 10-19-23 peak UST curve as frames of reference.
See also:
Footnotes & Flashbacks: Asset Returns 4-12-25
Mini Market Lookback: Trade’s Big Bang 4-12-25
Tariffs, Pauses, and Piling On: Helter Skelter 4-11-25
CPI March 2025: Fodder for Spin 4-10-25
Credit Snapshot: Avis Budget Group (CAR) 4-9-25
Footnotes & Flashbacks: Credit Markets 4-6-25
Footnotes & Flashbacks: State of Yields 4-6-25
Footnotes & Flashbacks: Asset Returns 4-6-25
Mini Market Lookback: A Week for the History Books 4-5-25
Payroll March 2025: Last Call for Good News? 4-4-25
Payrolls Mar 2025: Into the Weeds 4-4-25
Credit Snapshot: AutoNation (AN) 4-4-25
Credit Snapshot: Taylor Morrison Home Corp (TMHC) 4-2-25
JOLTS Feb 2025: The Test Starts in 2Q25 4-2-25
Credit Snapshot: United Rentals (URI) 4-1-25
Mini Market Lookback: The Next Trade Battle Fast Approaches 3-29-25
PCE Feb 2025: Inflation, Income, Outlays 3-28-25
4Q24 GDP: The Final Cut 3-27-25
Durable Goods February 2025: Preventive Medicine? 3-26-25
New Homes Sales Feb 2025: Consumer Mood Meets Policy Roulette 3-25-25
KB Home 1Q25: The Consumer Theme Piles On 3-25-25
Lennar: Cash Flow and Balance Sheet > Gross Margins 3-24-25
Mini Market Lookback: Fed Gut Check, Tariff Reflux 3-22-25
Existing Homes Sales Feb 2025: Limping into Spring 3-20-25
Fed Action: Very Little Good News for Macro 3-19-25
Industrial Production Feb 2025: Capacity Utilization 3-18-25
Housing Starts Feb 2025: Solid Sequentially, Slightly Soft YoY 3-18-25
Retail Sales Feb 2025: Before the Storm 3-17-25
Mini Market Lookback: Self-Inflicted Vol 3-15-25
Credit Spreads: Pain Arrives, Risk Repricing 3-13-25
Tariff and Trade links:
Tariffs: Some Asian Bystanders Hit in the Crossfire 4-8-25
Tariffs: Diminished Capacity…for Trade Volume that is…4-3-25
Reciprocal Tariff Math: Hocus Pocus 4-3-25
Reciprocal Tariffs: Weird Science Blows up the Lab 4-2-25
Tariffs: Stop Hey What’s That Sound? 4-1-25
Tariffs are like a Box of Chocolates 4-1-25
Auto Tariffs: Questions to Ponder 3-28-25
Fed Gut Check, Tariff Reflux 3-22-25
Tariffs: Strange Week, Tactics Not the Point 3-15-25
Trade: Betty Ford Tariff Wing Open for Business 3-13-25
Auto Suppliers: Trade Groups have a View, Does Washington Even Ask? 3-11-25
Tariffs: Enemies List 3-6-25
Happy War on Allies Day 3-4-25
Auto Tariffs: Japan, South Korea, and Germany Exposure 2-25-25
Mini Market Lookback: Tariffs + Geopolitics + Human Nature = Risk 2-22-25
Reciprocal Tariffs: Weird Science 2-14-25
US-EU Trade: The Final Import/Export Mix 2024 2-11-25
Aluminum and Steel Tariffs: The Target is Canada 2-10-25
US-Mexico Trade: Import/Export Mix for 2024 2-10-25
Trade Exposure: US-Canada Import/Export Mix 2024 2-7-25
US Trade with the World: Import and Export Mix 2-6-25
The Trade Picture: Facts to Respect, Topics to Ponder 2-6-25