
Footnotes & Flashbacks: Credit Markets 4-13-25
HY spreads had a friendlier week with IG slightly wider but the curve dished out a total return beatdown.


How much was the tariff on the dove?
The yield curve setbacks and the relief rally in equities made for a mixed week as the pause sent HY spreads -19 bps tighter on the week back to +426 bps. IG OAS edged wider but had bigger problems with duration this week as the curve slammed bond returns (see Footnotes & Flashbacks: State of Yields 4-13-25, Footnotes & Flashbacks: Asset Returns 4-12-25).
The on-and-off pauses are typical of the inconsistency, poor preparation, and unpredictability of the Trump Tariff plan, and that includes the late Friday exemption of smart phones, computers, and electronic components from the reciprocal actions. Trump reiterated on social media that “Nobody is getting off the hook for unfair trade balances” (we skipped the mixture of all caps). Trump mixes in moonwalking with saber rattling like no other (see Reciprocal Tariff Math: Hocus Pocus 4-3-25, Reciprocal Tariffs: Weird Science Blows up the Lab 4-2-25).
The coming week brings some useful news with Retail Sales, Industrial Production, and Housing Starts, but the backward-looking economic metrics lack the importance of what lies dead ahead as record tariffs (record in breadth and scale) start to get recorded on the transactions at sea level (see Tariffs, Pauses, and Piling On: Helter Skelter 4-11-25).
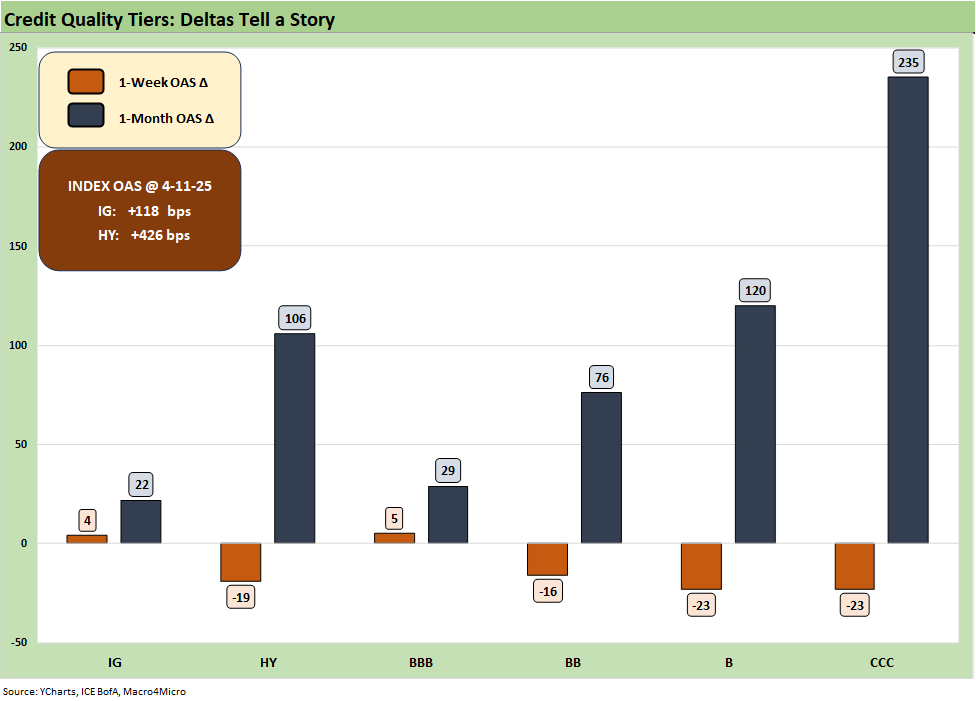
The above chart updates the running 1-week and 1-month HY OAS deltas. We see an ugly 1-month period of +106 bps through Friday close, and that would make the Top 20 when framed against worst calendar months. Last week’s rolling 1-month peak OAS made the top 10 that included a +59 bps day (see Tariffs: Diminished Capacity…for Trade Volume that is…4-3-25). In that context, this was a mild week with a -19 bps rally.
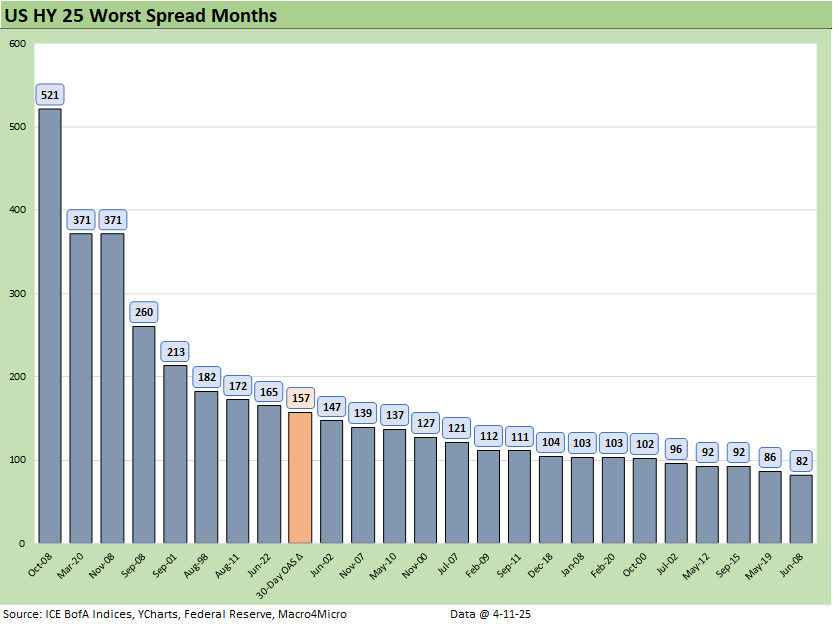
The above chart shows some of the uglier calendar months (vs. rolling 1-month time periods) looking back across the decades. The dates include some bad default cycles, credit bubbles, moments of headline fraud (WorldCom), a systemic bank system crisis, a pandemic, and some sovereign panics that spooked global banks. We dropped in the +157 rolling 1-month from the prior panic week but skipped dropping in the +106 bps through the past Friday, which also would have made the list (See Mini Market Lookback: A Week for the History Books 4-5-25).
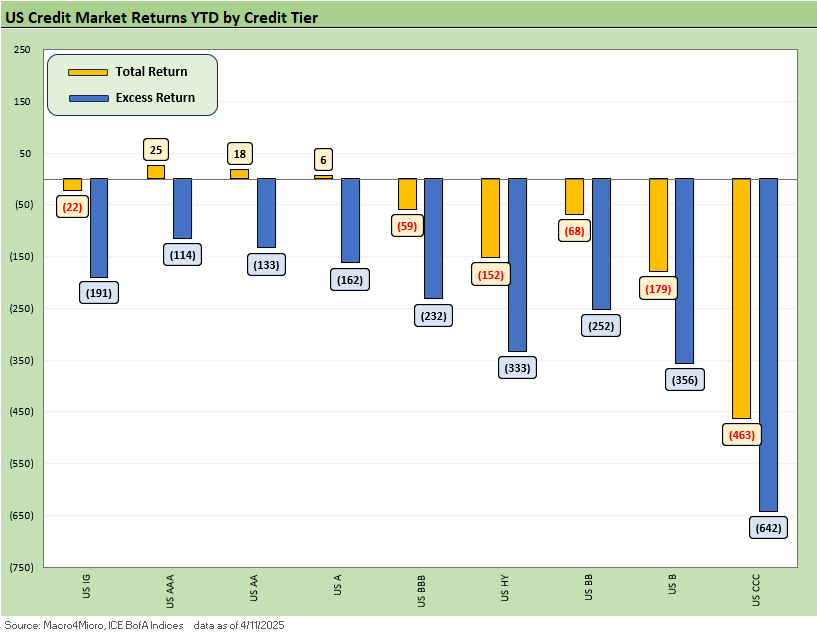
Total returns and excess returns for IG and HY and across the credit tiers are telling a grim story of the UST curve and credit spreads both working against returns. All total returns are negative and all credit tiers BBB and below posted negative excess returns.
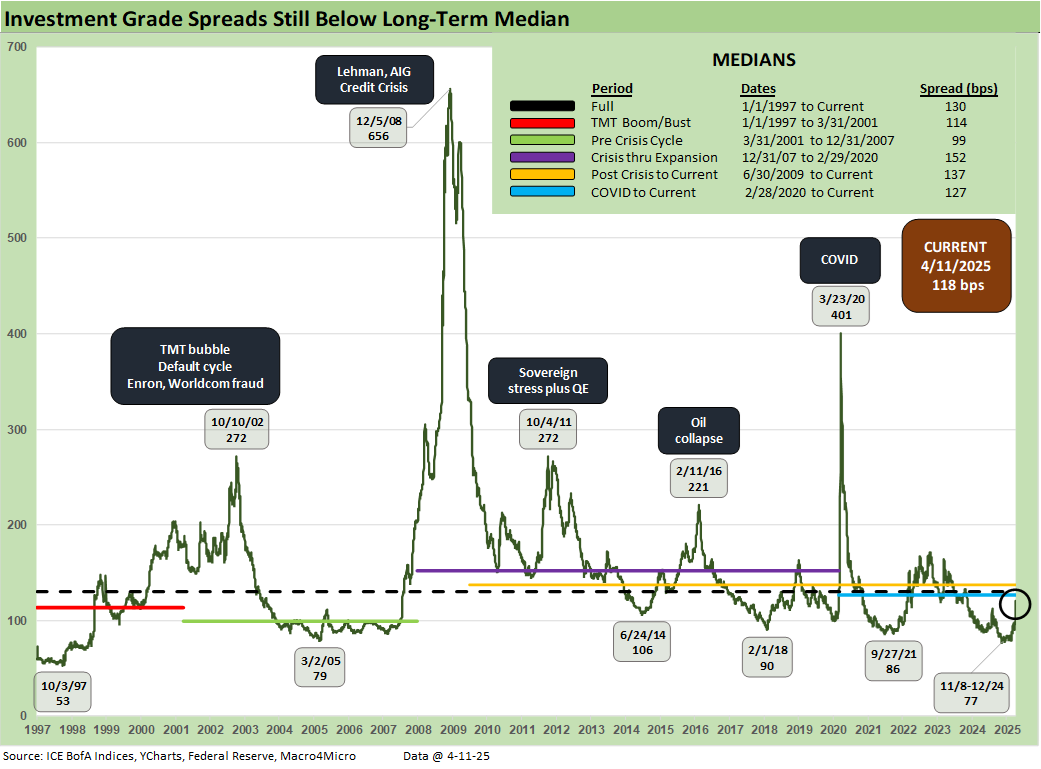
IG spread widened slightly by +4 bps to +118 bps and ended the week modestly inside the long-term median. Banks are a massive issuing sector with reporting underway this past week and much more to come. IG banks widened by +7 bps on the week.
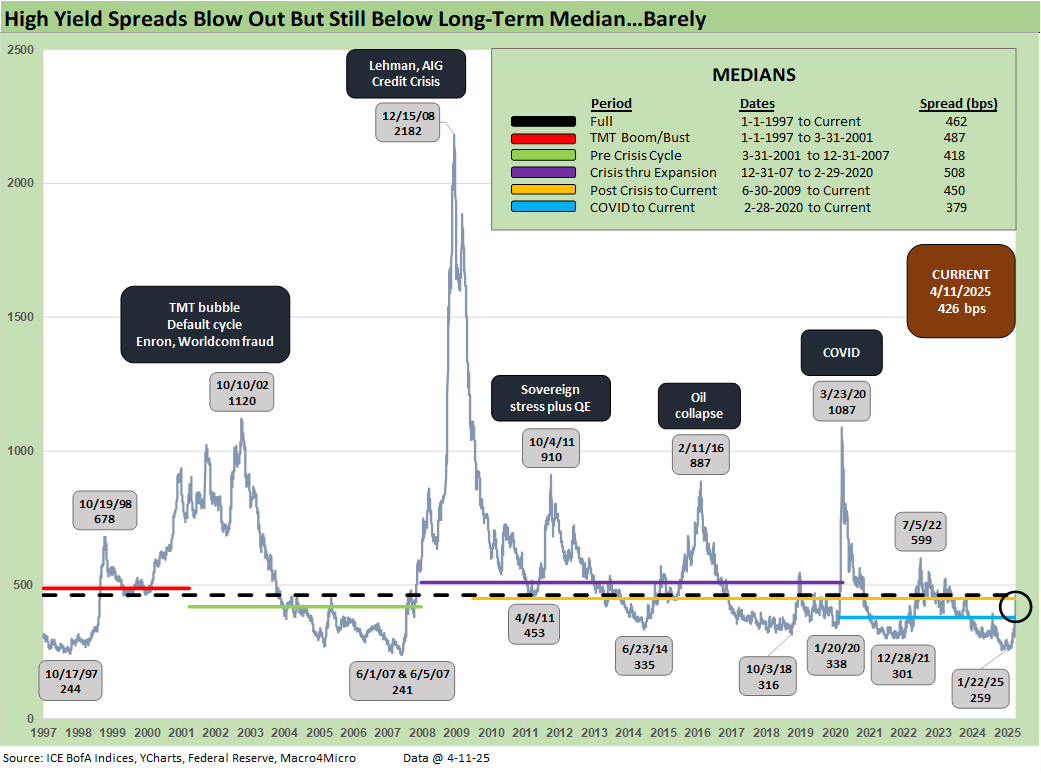
The reciprocal tariff pause drove equities higher and helped HY tighten by -19 bps to +426 bps, which is modestly inside the +462 bps long term median. An all-in yield of 8.55% YTW with a 6.5% par weighted coupon in HY still leaves room for more risk repricing as we move into the “full effects’’ period.
Sector and issuer selection and watching the new issue potential for current coupons is a good time for HY income seekers. The names that have refi and extension upside (92.4 dollar price on the index) are also still an interesting way to monitor the HY sector. Names that might be perceived as shorter duration as the year proceeds and could be more likely to get refinanced and extended offer some upside on the par or par plus calls. That is something to monitor as the UST curve moves play out. That is a dig-in-the-structures exercise.
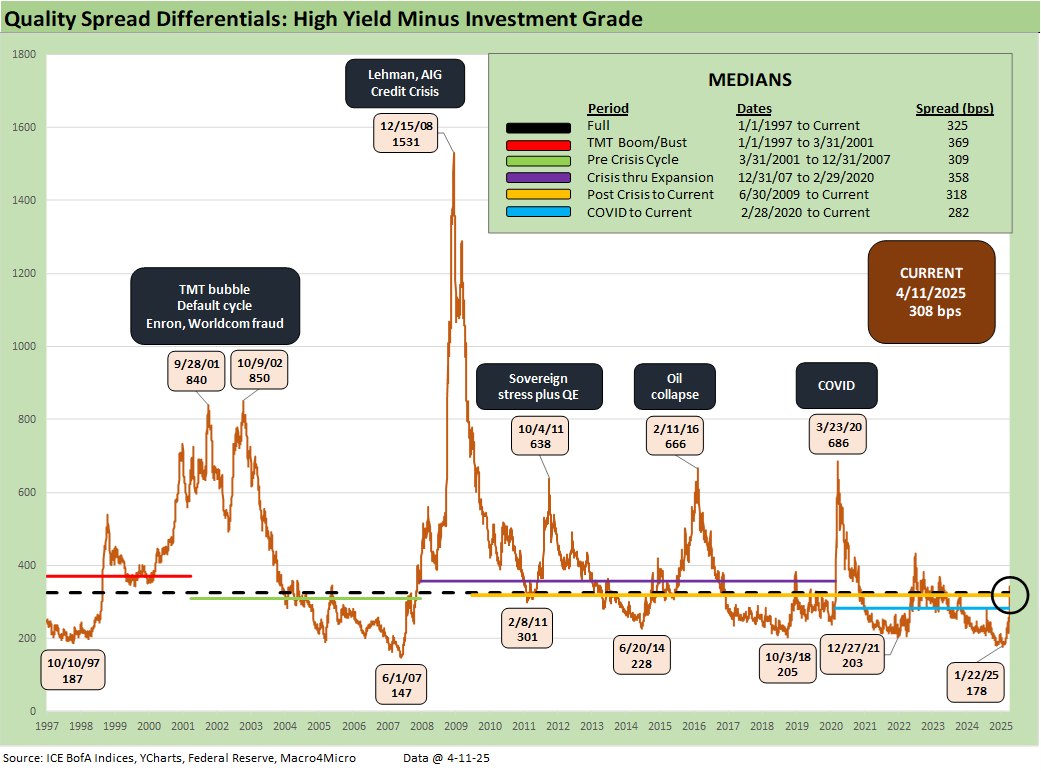
The “HY OAS minus IG OAS” quality spread differential of +308 bps compressed from +331 bps last week as HY rallied.
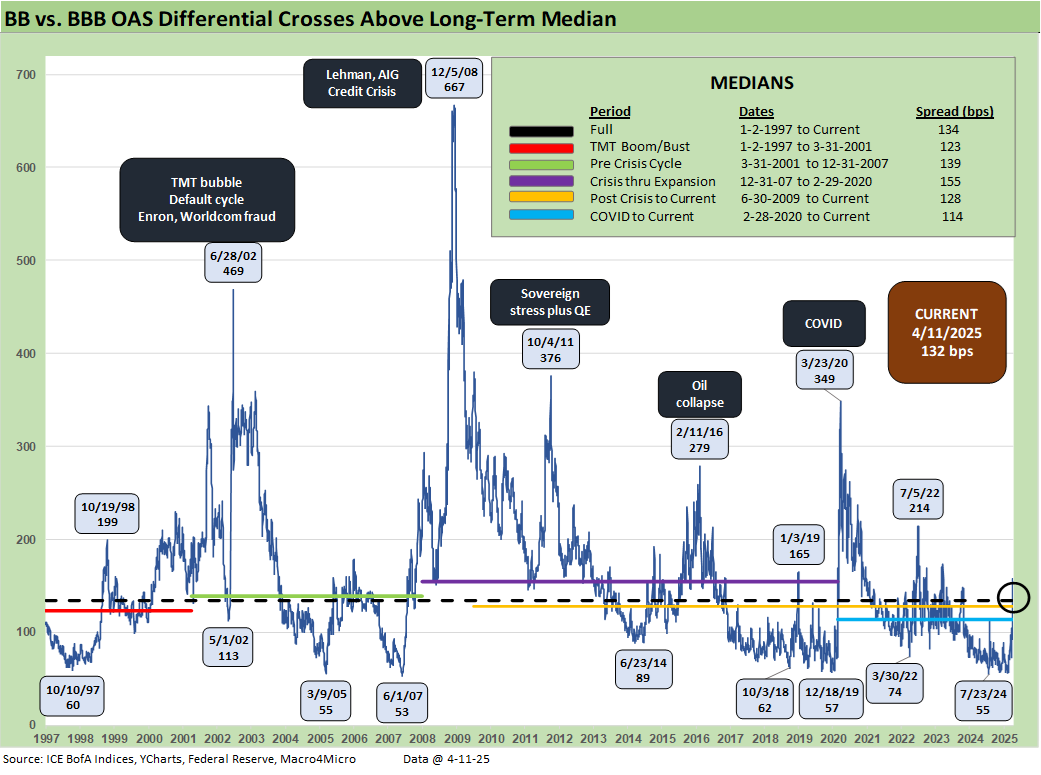
The “BB OAS minus BBB OAS” quality spread differential narrowed to +132 bps from +153 bps last week with the current level right around the long-term median and more than double the 2024 lows.
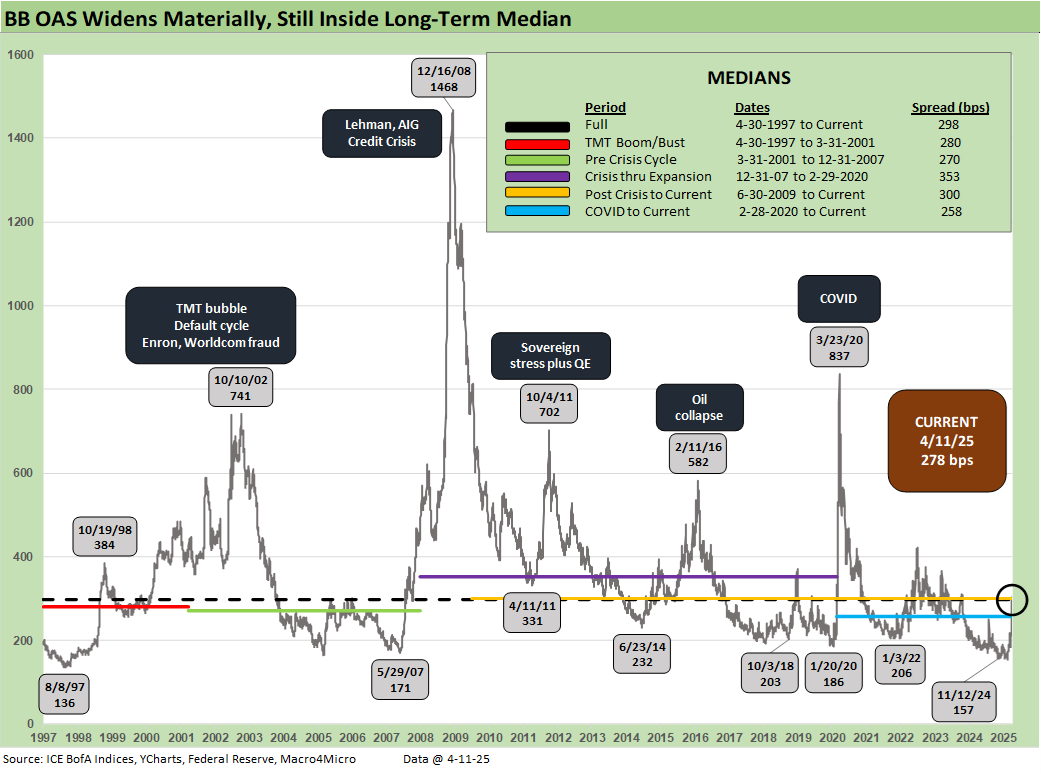
The BB tier tightened by -16 bps this week to +278 bps or around -20 bps inside the long-term median.
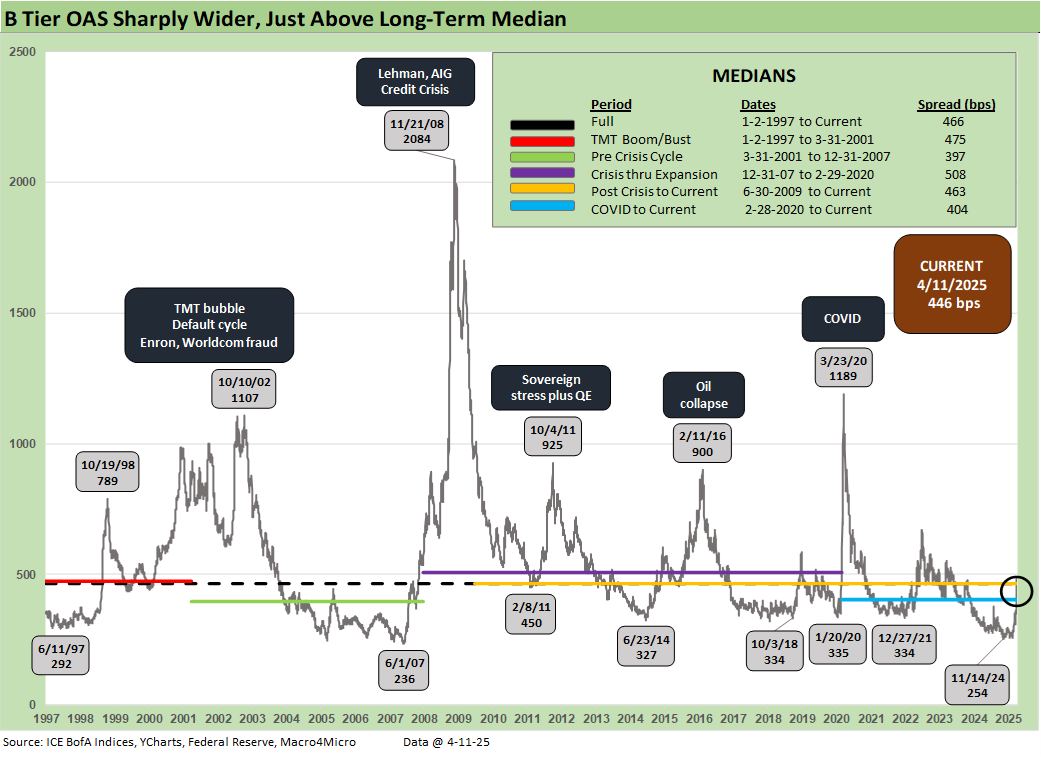
The B tier is the sweet spot of HY, and we saw a -23 bps tightening on the week (the same level of tightening as the CCC tier). The +446 bps is -20 bps inside the long-term median.
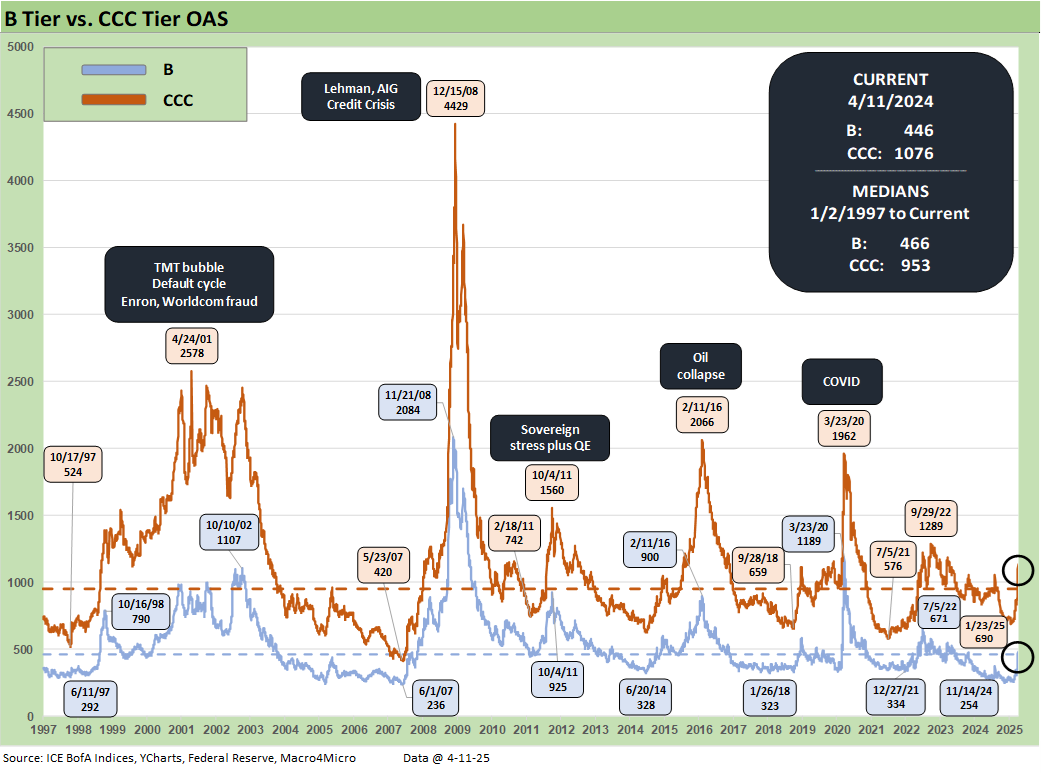
The B vs. CCC tier OAS time series is plotted above. The timeline for B and CCC spreads highlights the points of major divergence along the way (see The B vs. CCC Battle: Tough Neighborhood, Rough Players 7-7-24).
The current CCC tier OAS at +1076 bps tightened by -23 bps the past week and remains well above the long-term median of +953 bps. It comes as no surprise that the tariff chaos and potential economic damage could be another moment of B vs. CCC divergence as we wade further into this mess.
The yield to worse is slightly under 15% at 14.92% and widely dispersed across a 77.5 composite dollar price. The CCC tier is about equity risk returns with such yields at this point. The CCC exercise is an issuer-specific case of capital structure selection as well as issuer relative value research. Subject to how these tariffs play out and how the stagflation wildcard unfolds, the distressed players are warming up.
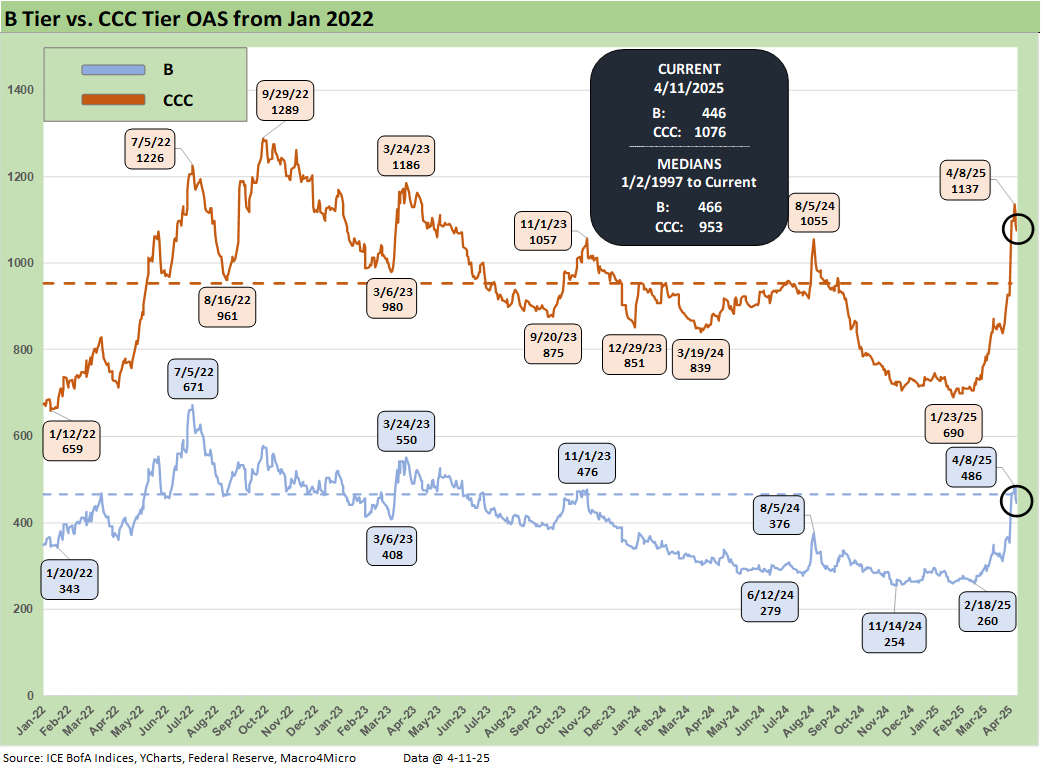
The shorter timeline from Jan 2022 just ahead of the end of ZIRP and start of the tightening cycles gives better granularity on the movements from a low of +659 bps in Jan 2022 to a peak of +1226 bps in July 2022 and 1289 bps to end Sept 2022 down to the Jan 2025 tights of +690 bps ahead of the recent spike to current levels.
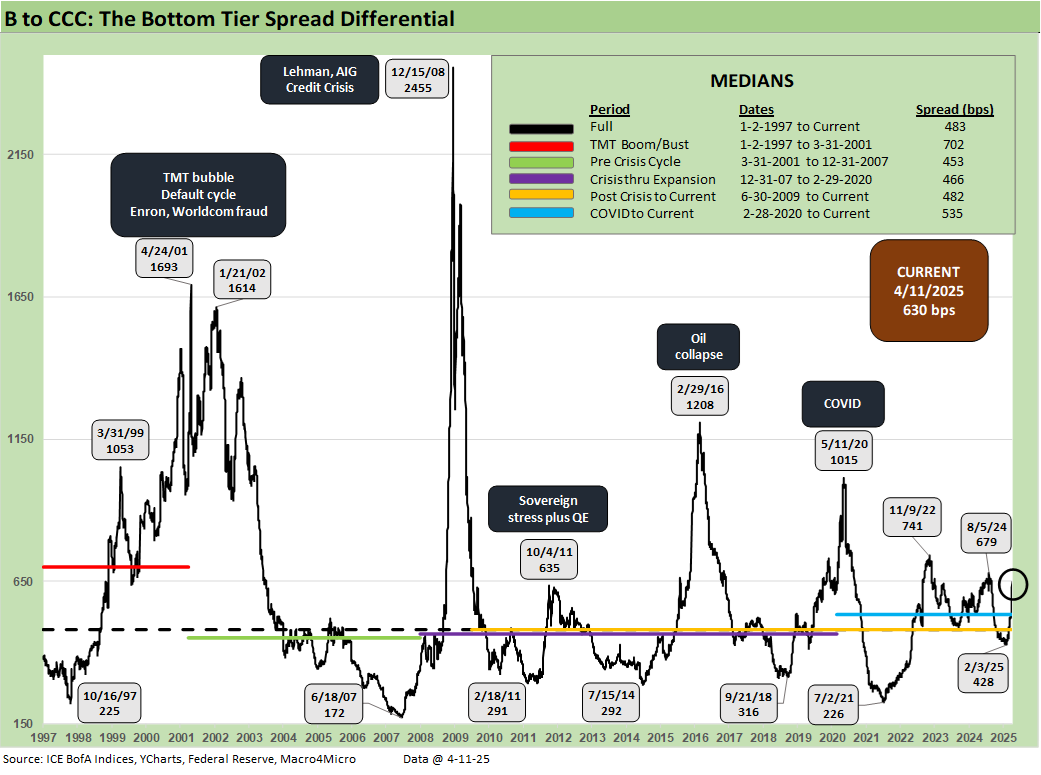
The B vs. CCC tier differential is broken out above with the current +630 bps well above the long-term median and above the distinct segmented timeline with the exception of the TMT HY credit cycle with its +702 bps median.
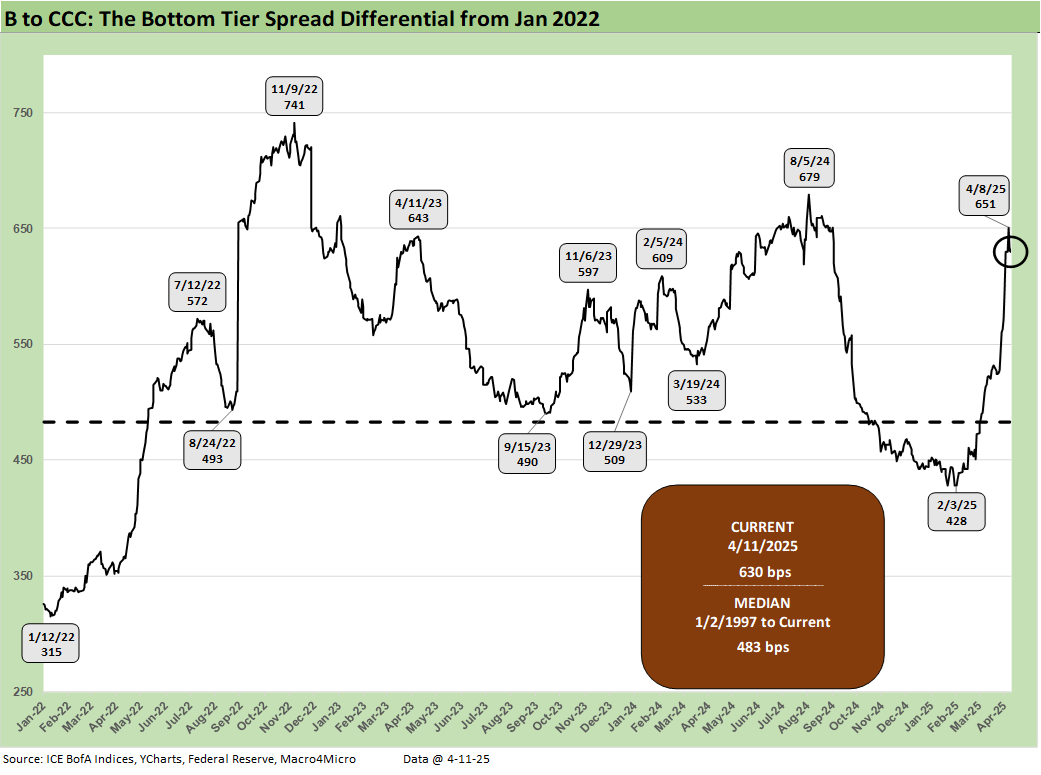
The above chart frames the “B vs. CCC tier” quality spread differential across the short timeline for better granularity. The low of Feb 2025 at +428 bps has widened with a vengeance.
A look at yields…
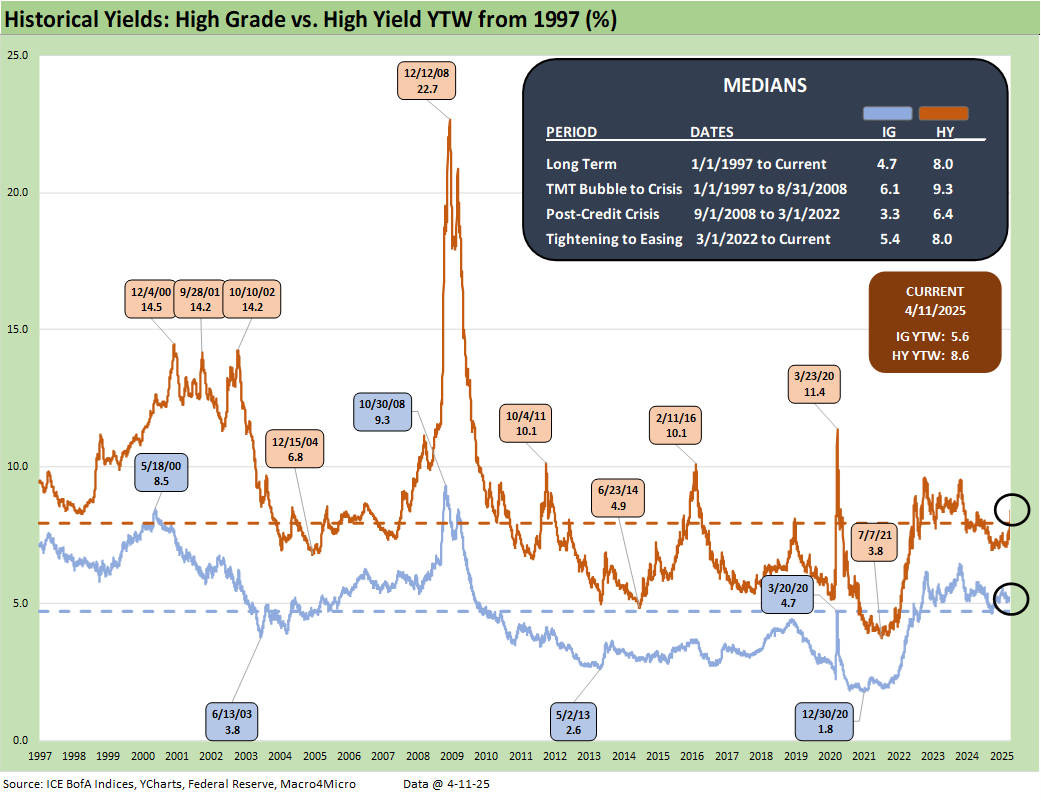
Moving away from spreads, which are a little further below long-term medians this week, yields for both IG and HY have a more complex story in historical context given the post-crisis distortions of ZIRP and “normalization.” The normalization period of Dec 2015 to Dec 2018 never really got on track with the economic weakness and Fed easing of 2019 followed by a COVID crisis and return to ZIRP in Mar 2020.
The current IG YTW at 5.57% (vs. 5.15% last week) has pushed higher on the rising UST curve and are now moving closer to the 6.1% pre-ZIRP median. The HY YTW rose this week to 8.55% (from 8.38%) vs. a pre-ZIRP 9.3% mark. We consider the pre-ZIRP years the most rational frame of reference in light of the post-crisis ZIRP and QE as well as the COVID Fed reactions.
Spreads will remain a key swing factor for reaching those yield medians of pre-ZIRP years, and we just saw material credit risk pricing action on HY the past two weeks. UST yields are a tougher call with the tariff backdrop that still threatens stagflation as well as a technically driven upward shift on the supply-demand fears.
In theory, old fashioned recession risk would pressure UST rates lower and credit spreads higher, but this is no ordinary cyclical turn. We cover the UST shapeshifting in our separate Footnotes publication on yields as the UST curve steepened this week and the inversion moved lower on the front end (see Footnotes & Flashbacks: State of Yields 4-13-25).
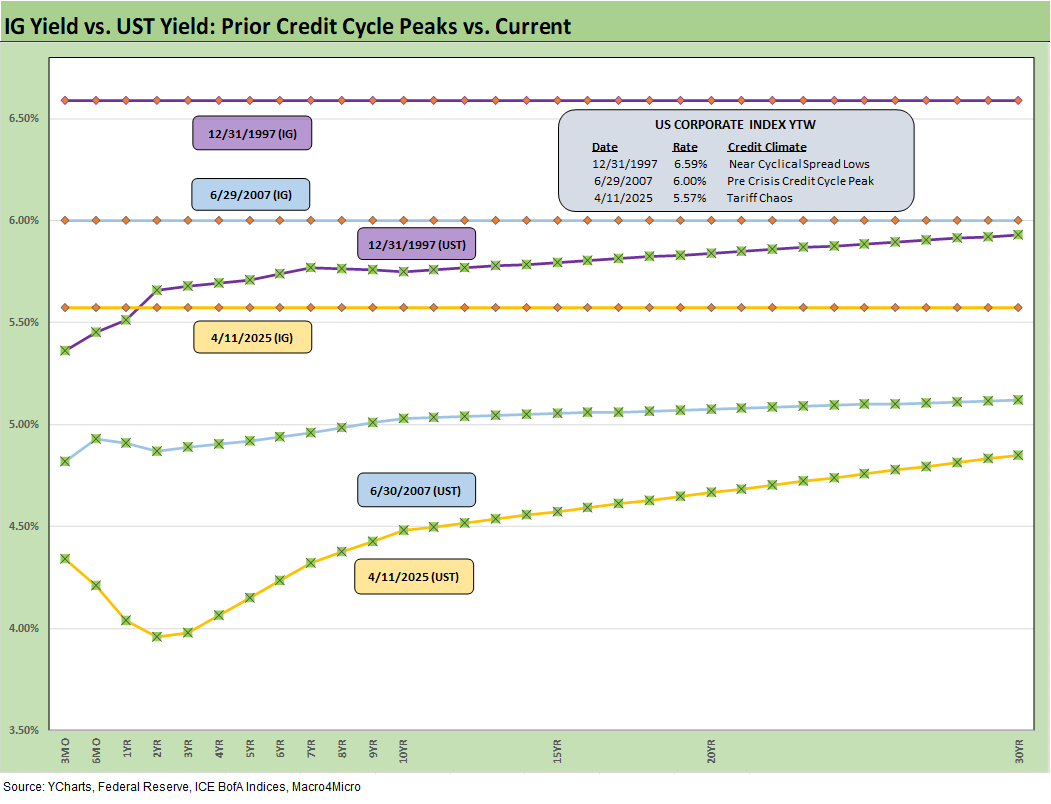
The above frames current IG index yields vs. previous credit peaks along with their respective UST curves. We include both prior credit peaks in June 2007 and Dec 1997 for context as prior peak credit cycles when high risk appetites saw investors chasing yields. Those 1997 and 2000 markets saw poor risk symmetry and low spreads.
Today’s curve is still low in those historical credit peak contexts. With stagflation risks back in the mix and the current market beyond the credit cycle peak after the tariffs, the next stretch could see long yields rising as spreads widen out for renewed return pain. The short to intermediate IG market is still the safest bond game for now. The funds that are asset class constrained to HY can take refuge in the higher quality layers.
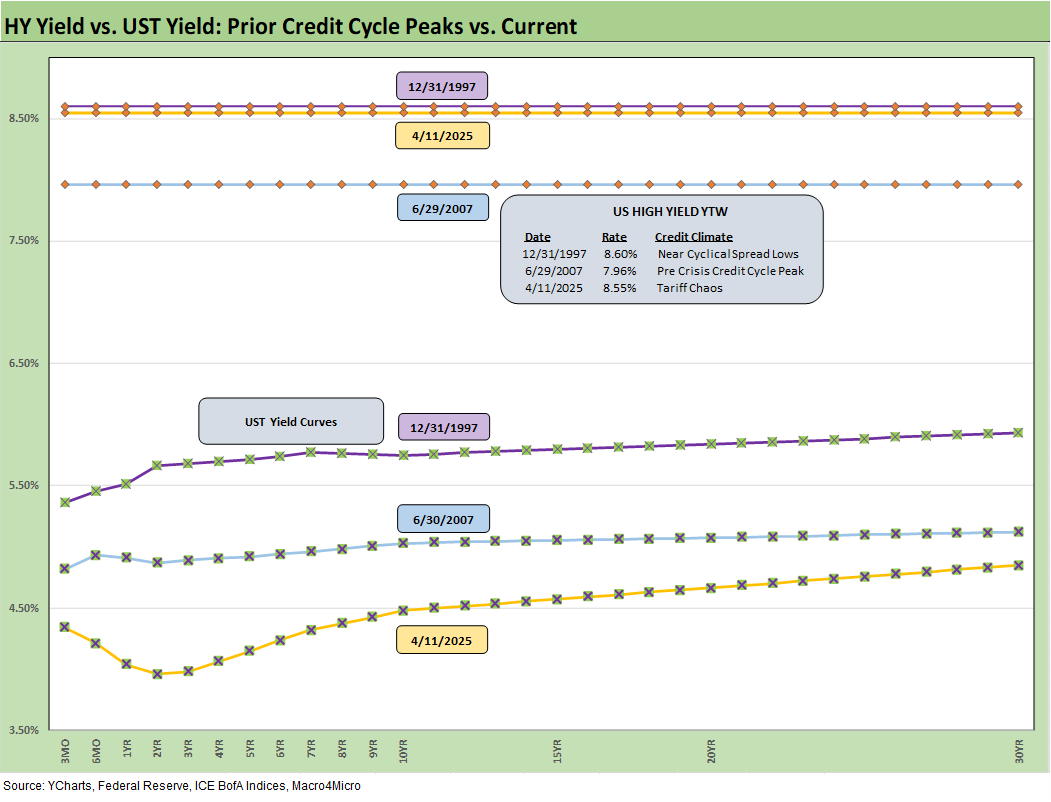
The final chart does the same 1997 and 2007 drill but for HY index yields. This week’s UST move leaves current HY index yields still in line with prior peak credit cycles at 8.55% vs. 7.96% in June 2007 and 8.60% in Dec 1997. The recent spread widening has moved yields higher than the 2007 peak and in line with 1997.
The widening this week gave flashbacks to the volatility and major spread moves of the 1997-98 and 2007-08 periods that also posted triple-digit widening months. The sheer speed of risk repricing has happened in earlier cycles as well. This has happened before for very different reasons. The challenge is identifying a fundamental transmission mechanism to more trouble, and that is easy to see here with extreme tariffs and the economic effects. The tariff shock is unprecedented in modern capital markets, but the banks are much healthier. We also see higher quality levels in the HY bond index as a starting point vs. 2007 and TMT bubble years.
Looking back even more, the turn in the credit cycle always comes at some point and often with an external trigger or “assist” that can set it off. During 1990, securities firms started to collapse including Drexel’s Chapter 11 in Feb 1990 and bridge loan related bailouts of Shearson Lehman, First Boston, and Kidder Peabody. We do not face that type of intermediary meltdown risk here (at least not yet!).
The summer of 2007 was the start of major problems in the credit markets, but the equity markets and S&P 500 and NASDAQ kept on rallying into Oct 2007. Later in the turmoil and well after the fact, the start of the recession was tagged as Dec 2007 (see Business Cycles: The Recession Dating Game 10-10-22).
The 2007 experience reminded the market that credit leads the cycle and equity lags. The same was true in 1999 with the HY default cycle underway and NASDAQ at +86% that year. This time around, the credit markets did not expect the tariff insanity and is still making up its mind. The real economic effects are more geared to the periods ahead in 2Q25 and 3Q25. We expect HY to stay unhappy and spread to average wider as the tariffs roll into actual corporate fundamentals.
See also:
Footnotes & Flashbacks: State of Yields 4-13-25
Footnotes & Flashbacks: Asset Returns 4-12-25
Mini Market Lookback: Trade’s Big Bang 4-12-25
Tariffs, Pauses, and Piling On: Helter Skelter 4-11-25
CPI March 2025: Fodder for Spin 4-10-25
Credit Snapshot: Avis Budget Group (CAR) 4-9-25
Footnotes & Flashbacks: Credit Markets 4-6-25
Footnotes & Flashbacks: State of Yields 4-6-25
Footnotes & Flashbacks: Asset Returns 4-6-25
Mini Market Lookback: A Week for the History Books 4-5-25
Payroll March 2025: Last Call for Good News? 4-4-25
Payrolls Mar 2025: Into the Weeds 4-4-25
Credit Snapshot: AutoNation (AN) 4-4-25
Credit Snapshot: Taylor Morrison Home Corp (TMHC) 4-2-25
JOLTS Feb 2025: The Test Starts in 2Q25 4-2-25
Credit Snapshot: United Rentals (URI) 4-1-25
Mini Market Lookback: The Next Trade Battle Fast Approaches 3-29-25
PCE Feb 2025: Inflation, Income, Outlays 3-28-25
4Q24 GDP: The Final Cut 3-27-25
Durable Goods February 2025: Preventive Medicine? 3-26-25
New Homes Sales Feb 2025: Consumer Mood Meets Policy Roulette 3-25-25
KB Home 1Q25: The Consumer Theme Piles On 3-25-25
Lennar: Cash Flow and Balance Sheet > Gross Margins 3-24-25
Mini Market Lookback: Fed Gut Check, Tariff Reflux 3-22-25
Existing Homes Sales Feb 2025: Limping into Spring 3-20-25
Fed Action: Very Little Good News for Macro 3-19-25
Industrial Production Feb 2025: Capacity Utilization 3-18-25
Housing Starts Feb 2025: Solid Sequentially, Slightly Soft YoY 3-18-25
Retail Sales Feb 2025: Before the Storm 3-17-25
Mini Market Lookback: Self-Inflicted Vol 3-15-25
Credit Spreads: Pain Arrives, Risk Repricing 3-13-25
Tariff and Trade links:
Tariffs: Some Asian Bystanders Hit in the Crossfire 4-8-25
Tariffs: Diminished Capacity…for Trade Volume that is…4-3-25
Reciprocal Tariff Math: Hocus Pocus 4-3-25
Reciprocal Tariffs: Weird Science Blows up the Lab 4-2-25
Tariffs: Stop Hey What’s That Sound? 4-1-25
Tariffs are like a Box of Chocolates 4-1-25
Auto Tariffs: Questions to Ponder 3-28-25
Fed Gut Check, Tariff Reflux 3-22-25
Tariffs: Strange Week, Tactics Not the Point 3-15-25
Trade: Betty Ford Tariff Wing Open for Business 3-13-25
Auto Suppliers: Trade Groups have a View, Does Washington Even Ask? 3-11-25
Tariffs: Enemies List 3-6-25
Happy War on Allies Day 3-4-25
Auto Tariffs: Japan, South Korea, and Germany Exposure 2-25-25
Mini Market Lookback: Tariffs + Geopolitics + Human Nature = Risk 2-22-25
Reciprocal Tariffs: Weird Science 2-14-25
US-EU Trade: The Final Import/Export Mix 2024 2-11-25
Aluminum and Steel Tariffs: The Target is Canada 2-10-25
US-Mexico Trade: Import/Export Mix for 2024 2-10-25
Trade Exposure: US-Canada Import/Export Mix 2024 2-7-25
US Trade with the World: Import and Export Mix 2-6-25
The Trade Picture: Facts to Respect, Topics to Ponder 2-6-25