
Footnotes & Flashbacks: Credit Markets 3-17-25
We revisit an unusually volatile week for HY spreads in recent context. Tariff tantrums roil equities and wake up the risk complacent.


You think tariffs are scary? Wait until I start annexing and changing borders.
HY Spreads had a wild week by recent standards with a few days of material whipsaws wider and wrapped up with a rally day on Friday. IG spreads stay very well contained in the double-digit range while HY broke out of the June 2007 range even if still in line with some prior credit cycle peaks and spread lows in periods such as June 2014 and early Oct 2018 (see Credit Spreads: Pain Arrives, Risk Repricing 3-13-25. Credit Spreads Join the Party 3-10-25).
Equity returns have taken a beating as the market struggles to handicap moving parts that carry great impact but only have just started to get underway. Dead ahead is some major tariff action that might (or might not) have visibility in April on “reciprocal tariffs.”
Across a very tumultuous week, the running economic metrics and market resilience is still riding on the strong run rates in the economy from 2024 that also brought the two best back-to-back years for the S&P 500 since the late 1990s. It will be hard for the talking heads to address the coming headlines of weak numbers since that will immediately be tied to tariffs and eroding sentiment/confidence.
Economic contractions are rare in the last few cycles and were crisis based. We are not there yet on recession level numbers even if 1Q25 could turn on inventory deltas and some PCE and nonresidential investment tweaks.
Consumer sentiment indicators are currently tanking, and capital budgets face a barrage of highly uncertain variables. We won’t even get the final 4Q24 GDP number until the end of March.
We are now starting to see a faltering consumer that is not retrenching yet even if there are signs of trouble with plunging sentiment metrics and materially higher inflation expectations. At the end of March, we get fresh numbers for Feb PCE prices, income and outlays. Retail sales have been underwhelming, and recent retailer and airline earnings warnings are not reassuring.

The above chart highlights the 1-week and 1-month HY OAS deltas through Friday. It is a classic pattern of spread decompression. The gap in the B tier and CCC tier is from a lower base relative to history including periods of very compressed risk premiums. That is the easy pushback from credit bulls.
There are plenty of opportunities across credit from HY bonds to private credit and especially for income seekers with a longer-term investment time horizon. That said, the pricing is rich vs. history and the currently “still-low” HY OAS could widen by over +135 bps and still be inside the long-term median HY OAS.
One man may see credit pricing resilience as a good sign while another might simply see it as bad risk-reward symmetry. If you leave HY bonds, you still need to have a destination from cash to high quality bonds to stocks as an asset allocation alternative. Fundamental risk vs. duration is the perennial old school decision. Risk has lost so far in 2025.
The type of market events and trends that would punish HY would crush equities, so the discussion always needs to be put in portfolio context for asset allocation. What is not as easy this time is that the duration and fixed income question includes stagflation risk.
This current market is the first time since early in my career that we will face real stagflation risk. I recall a 22% Misery Index (inflation plus unemployment) when I started my first job in NYC in June 1980 after graduation. I remember a 23% rate on a small business loan. That was quite a ticket. Volcker did not mess around.
This current market has nothing to do with those early stagflation days and is more like training wheels for stagflation risk. This will still be a risky period ahead given the scale of the markets and valuation these days. Back in the early 1980s, HY was a newborn. Many untested theories will soon get tested on the sheer scale of the tariffs planned and a demonstrated willingness to retaliate to the retaliation. There is no hiding from the tariffs once they are in force (that is, unless Trump pulls them).
Tariffs get worse by the day in risk profile…
The game theory with Canada is tough and backing down could be politically fatal for new leadership since Trump has threated to ignore borders and treaties, declare economic war on Canada, and seeks to annex them at the same time he threatened to annex the Panama Canal and Greenland. Canada is mobilizing economically and looking to reduce dependence on the US. The F-35 headlines this week are more significant than the size of the fighter order.
Meanwhile, the game theory with the EU is colored by Trump moving to throw Ukraine under a Russian tank and leaving the former Soviet satellites exposed to Putin’s Ghost of Stalin fantasies. NATO is in doubt. The risk to the EU caving on tariffs has greater significance than a bad trade outcome. Total trade declines, the reverse multiplier effects will unfold, and the revenue, earnings and valuation multiples will feel pain. Not a great backdrop (see The Trade Picture: Facts to Respect, Topics to Ponder 2-6-25, Tariffs: Questions to Ponder, Part 1 2-2-25).

The above chart updates the YTD total returns and excess returns for IG and HY and across the credit tiers. The excess returns are now clearly taking a beating, and total returns are living off the UST curve flattener.
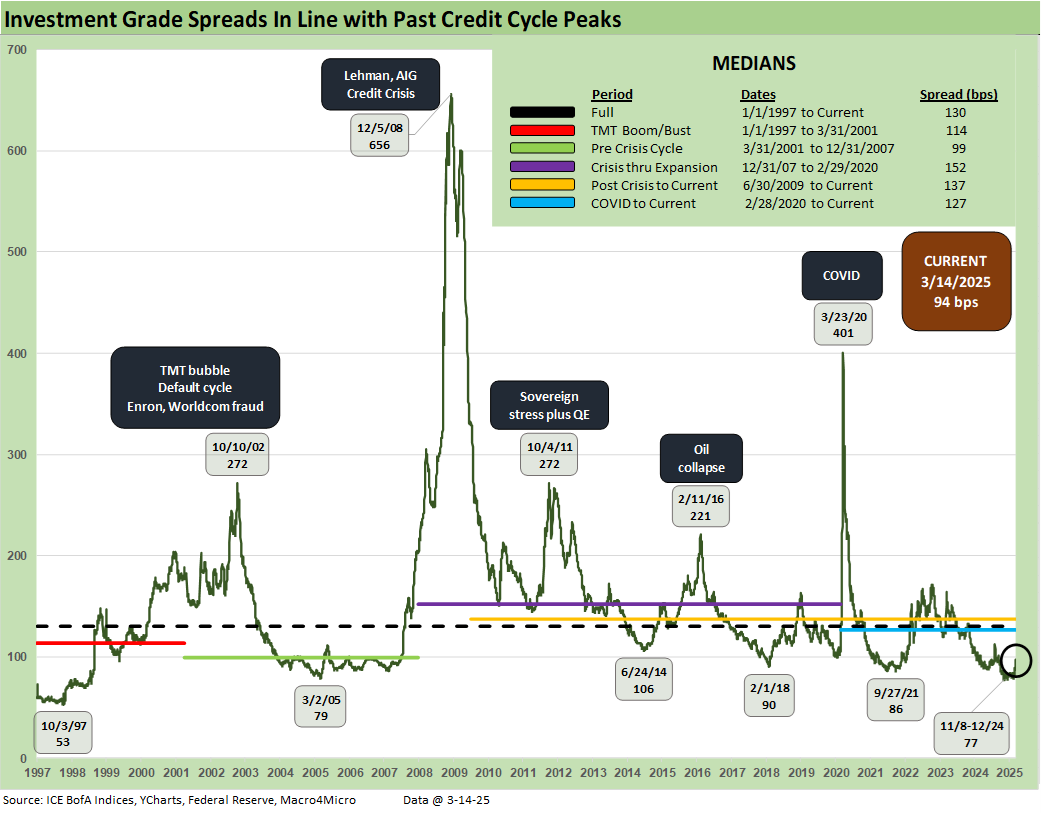
The long-term IG spread history above shows that we are still in rarefied spread range in double digits at +94 bps relative to the long-term median of +130 bps. The median for the March 2001 to Dec 2007 cycle posted a +99 bps median, and that cycle was one of considerable credit risk appetite excess.

The updated long-term HY OAS history offers a reminder that the current +325 is a tight spread level and closer to some earlier cyclical lows.

The spread wave the past week pushed HY-IG quality spreads to +231 bps or well above the +178 bps lows we saw in Jan 2025. The long-term median of +325 bps is a reminder that there is a lot of room in that quality spread differential to move higher.

The “BB OAS minus BBB OAS” quality spread differential widened out but is still around the June 2014 lows even if above the low points in the time series. The differential of +88 bps remains well inside the long-term median of +134 bps.

The BB tier OAS moved back across the seldom traversed +200 bps line to +204 bps, which puts the BB tier OAS as of the Friday close at 94 bps below the long-term median. The +204 bps BB OAS is below the June 2014 lows, slightly above the Oct 2018 lows, and below the Jan 2022 lows.
In the half full view, that is very solid risk pricing and an impressive statement by the market on the credit cycle’s staying power. The half-empty angle is that the BB tier is at a crossroads that needs the Trump tariff program to get the unconditional surrender of the EU, Canada, Mexico, and China. That surrender would need to come without a trade partner firing a metaphorical shot that would hit the consumer, capital spending, prices and volumes. Then everyone reshores or rushes to spend and build in the US? The skeptics might see that scenario as attempting to thread a needle with a catcher’s mitt on each hand. Good luck.

The B tier as the traditional core HY credit focus crossed back up above the +300 bps line to +333 bps. That is well above the +254 bps of Nov 2024. The +333 bps on the B tier at Friday close is 133 bps below the long-term median. The +333 bps is still around the lows of June 2014 (+327 bps), Oct 2018 (+334 bps), Jan 2020 (+335 bps), and Dec 2021 (+334 bps), so the current B tier OAS is not a fire alarm by itself even if the B tier is +66 bps wider on the trailing 1-month (see chart at top of this piece). The worry is the dramatically wide range of potential outcomes from the Trump tariff tantrums. That does not help the B tier risk-reward story line.
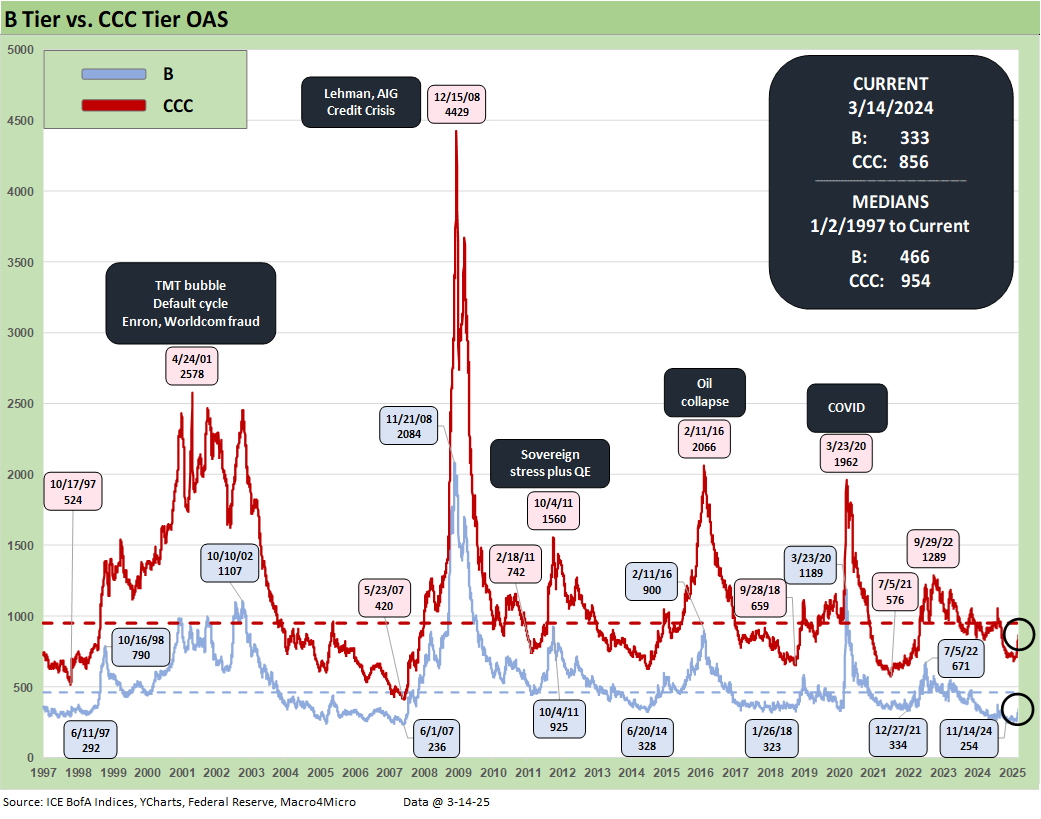
The above chart updates the comparative histories of the B tier and CCC tier and highlights major points of divergence between the two. The current CCC OAS of +856 bps has widened sharply vs. last week’s +791 bps even if still inside the +954 bps median.
The CCC tier is +142 bps wider the past month and +110 bps YTD. The CCC tier is always subject to the constituent migration patterns including dropout (defaults) and exchanges (coercive or otherwise) that can move the needle (see The B vs. CCC Battle: Tough Neighborhood, Rough Players 7-7-24).

The above chart shortens the timeline from the period just before the March 2022 tightening cycle for better visuals on more recent B vs. CCC OAS action.

The quality spread differential of “CCC OAS minus B OAS” of +523 bps is wide to the +482 bps long-term median. The B to CCC quality spread differential widened out by +32 bps since last week.
The differential had narrowed impressively since the peak of +741 bps during the cyclical anxiety period of the tightening cycle in fall 2022. Some of that tightening is tied to index exits and some to distressed exchanges but also to a broader risk asset rally that is mirrored in equities and other credit markets.
The current +523 bps quality spread differential is wide to 4 of the 6 timeline medians broken out in the box with the notable exception of the TMT bubble and collapse of that market into early 2001. The current level is also slightly inside the “COVID to current” median of +535 bps.

The above chart zeroes in on the 2022-2025 timeline for the CCC-B tier quality spread differential. The constituent shifts across some notable exchanges and dropouts and a major credit rally are evident in multiple material swings along the way. Executing on distressed exchanges has generated its share of headlines (e.g. Carvana) but much less than would have been seen if inflation had held in longer and even more tightening was needed.
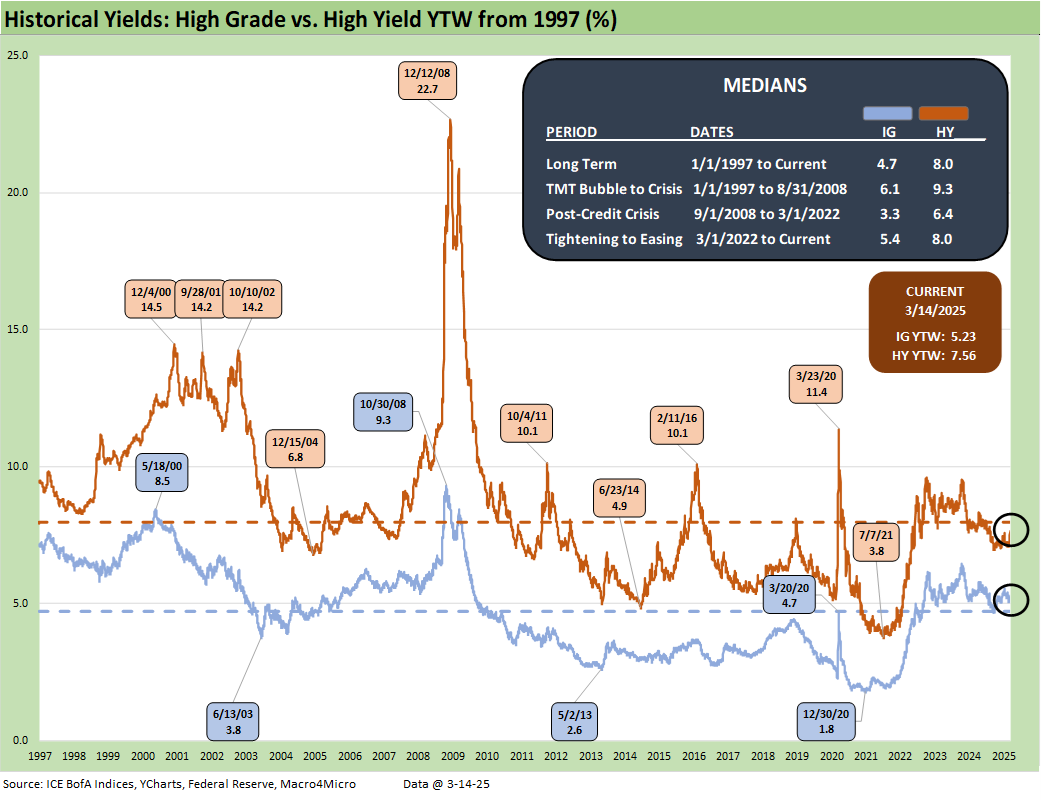
The HY index and IG index yield histories swung around with the credit cycles but were notably distorted across the ZIRP and QE years after late 2008. The current yield curve backdrop is very distinct now but still are best framed against the pre-ZIRP years.
We regularly make the case that the 9.3% pre-crisis (pre-ZIRP) median for HY and 6.1% in IG make for the most relevant frames of reference. That is backed up by framing median spreads vs. current spreads and index yield benchmarks.
Current yields for HY of 7.56% and 5.23% for IG reflect the low UST levels relative to past cycles as well as historically tight spreads (even if no longer as close to the all-time lows).
Median spreads would put all-in yields in HY closer to pre-crisis medians, so that is a frame of reference for historical context. For example, the long-term median for HY OAS is +137 bps above the current HY OAS of +325 bps. For simplicity’s sake, if we add +137 bps differential of the current HY OAS vs. the long-term median to the current HY Index YTW we get to just under the 9% line. In other words, we are in the zone with the lower UST being the swing factor.
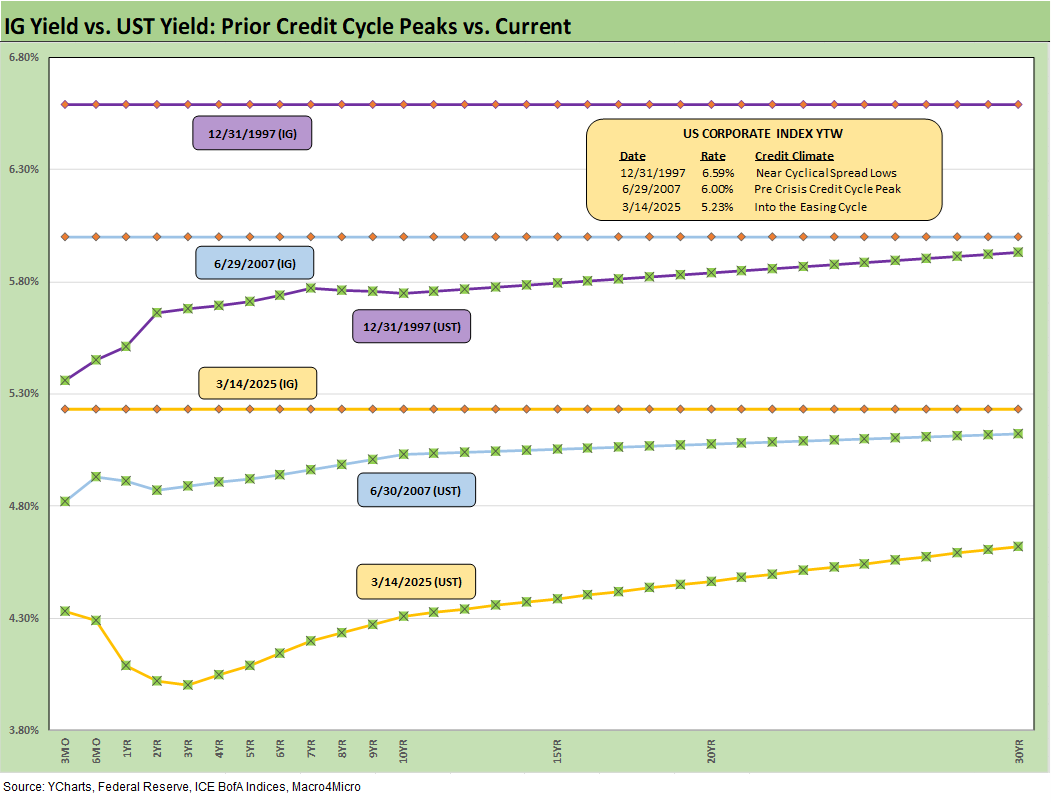
The above chart frames IG index yields and the related UST curve for the Friday close. We include two useful comps from prior credit cycle peaks in June 2007 and Dec 1997 for some credit cycle peak context. Those periods in 1997 and 2007 reflect market backdrops when credit markets were hot, risk appetites high, and spreads were down near multiyear lows.
For IG yields, the relative yield story is heavily dictated by the UST curve differentials with spreads tight in all three markets. For those who believe the post-crisis ZIRP was an anomaly, the current UST curve is exceptionally low in historical context (see Footnotes & Flashbacks: State of Yields 3-9-25).

The above chart does the same drill as the prior chart but for HY index yields. The low UST curve vs. history and extremely tight spreads put the current HY index yield below the earlier peak credit cycles. The volatility of 1998 and the experience of late 2007 on the way into the 2008 crisis period offer reminders that risk repricing can come on with a vengeance. That was true in earlier cycles as well (1990 as securities firms started to collapse)
The summer of 2007 was the start of major problems in the credit markets, but the equity markets and S&P 500 kept on rallying into Oct 2007. Later in the turmoil and well after the fact, the start of the recession was tagged as Dec 2007 (see Business Cycles: The Recession Dating Game 10-10-22).
See the Select Histories links below for anyone who wants to revisit good and bad old days.
See also:
Footnotes & Flashbacks: State of Yields 3-16-25
Footnotes & Flashbacks: Asset Returns 3-16-25
Mini Market Lookback: Self-Inflicted Vol 3-15-25
Credit Spreads: Pain Arrives, Risk Repricing 3-13-25
Trade: Betty Ford Tariff Wing Open for Business 3-12-25
CPI Feb 2025: Relief Pitcher 3-12-25
JOLTS Jan 2025: Old News, New Risks in the Market 3-11-25
Credit Spreads Join the Party 3-10-25
Footnotes & Flashbacks: Credit Markets 3-10-25
Footnotes & Flashbacks: State of Yields 3-9-25
Footnotes & Flashbacks: Asset Returns 3-9-25
Mini Market Lookback: Tariffs Dominate, Geopolitics Agitate 3-8-25
Payrolls Feb 2025: Into the Weeds 3-7-25
Employment Feb 2025: Circling Pattern, Lower Altitude 3-7-25
Gut Checking Trump GDP Record 3-5-25
Trump's “Greatest Economy in History”: Not Even Close 3-5-25
Asset Returns and UST Update: Pain Matters 3-5-25
Mini Market Lookback: Collision Courses ‘R’ Us 3-2-25
PCE Jan 2025: Prices in Check, Income and Outlays Diverge 2-28-25
Durable Goods Jan25: Waiting Game 2-27-25
GDP 4Q24 Second Estimate: PCE Inflation the Main Event 2-27-25
New Homes Sales Jan 2024: Homebuilders Feeling Cyclical Signals? 2-26-25
Existing Home Sales Jan 2025: Prices High, Volumes Soft, Inventory Up 2-21-25
AutoNation: Retail Resilient, Captive Finance Growth 2-21-25
Toll Brothers 1Q25: Performing with a Net 2-20-25
Housing Starts Jan 2025: Getting Eerie Out There 2-19-25
Herc Rentals: Swinging a Big Bat 2-18-25
UST Yields: Sept 2024 UST in Historical Context 2-17-25
Tariff links:
Tariffs: Strange Week, Tactics Not the Point 3-15-25
Trade: Betty Ford Tariff Wing Open for Business 3-13-25
CPI Feb 2025: Relief Pitcher 3-12-25
Auto Suppliers: Trade Groups have a View, Does Washington Even Ask? 3-11-25
Tariffs: Enemies List 3-6-25
Happy War on Allies Day 3-4-25
Auto Tariffs: Japan, South Korea, and Germany Exposure 2-25-25
Mini Market Lookback: Tariffs + Geopolitics + Human Nature = Risk 2-22-25
Reciprocal Tariffs: Weird Science 2-14-25
US-EU Trade: The Final Import/Export Mix 2024 2-11-25
Aluminum and Steel Tariffs: The Target is Canada 2-10-25
US-Mexico Trade: Import/Export Mix for 2024 2-10-25
Trade Exposure: US-Canada Import/Export Mix 2024 2-7-25
US Trade with the World: Import and Export Mix 2-6-25
The Trade Picture: Facts to Respect, Topics to Ponder 2-6-25
Tariffs: Questions to Ponder, Part 1 2-2-25
US-Canada: Tariffs Now More than a Negotiating Tactic 1-9-25
Trade: Oct 2024 Flows, Tariff Countdown 12-5-24
Mexico: Tariffs as the Economic Alamo 11-26-24
Tariff: Target Updates – Canada 11-26-24
Tariffs: The EU Meets the New World…Again…Maybe 10-29-24
Trump, Trade, and Tariffs: Northern Exposure, Canada Risk 10-25-24
Trump at Economic Club of Chicago: Thoughts on Autos 10-17-24
Facts Matter: China Syndrome on Trade 9-10-24
Select Histories:
Annual and Monthly Asset Return Quilt 2024 Final Score 1-02-25
Spread Walk 2024 Final Score 1-2-25
HY and IG Returns since 1997: Four Bubbles and Too Many Funerals 12-31-24
HY OAS Lows Memory Lane: 2024, 2007, and 1997 10-8-24
The B vs. CCC Battle: Tough Neighborhood, Rough Players 7-7-24
HY Spreads: Celebrating Tumultuous Times at a Credit Peak 6-13-24
Credit Markets Across the Decades 4-8-24
Credit Cycles: Historical Lightning Round 4-8-24
Histories: Asset Return Journey from 2016 to 2023 1-21-24
HY Multicycle Spreads, Excess Returns, Total Returns 12-15-23
HY Credit Spreads: Migration, Medians, and Misdirection 11-6-23
Credit Spreads: Proportions Matter in Risk Compensation 8-14-23
Fed Funds vs. Credit Spreads and Yields Across the Cycles 6-19-23
Wild Transition Year: The Chaos of 2007 11-1-22
Greenspan’s Last Hurrah: His Wild Finish Before the Crisis 10-30-22