
AutoNation: Retail Resilient, Captive Finance Growth
AutoNation offers a good vantage point on framing the next evolution of the franchise dealers.


We update the financial and operating fundamentals of AutoNation after its recent bond deal and 10-K filing. AN is one of the top two auto dealers with Lithia and both have growing captive finance units to support dealers and capture more of the value chain.
Auto Retail offers a good vantage point on what is going on with consumers in the showroom and parking lots across vehicle retail and in parts and services and in auto retail finance (F&I products). Vehicles and supporting services are a big part of household budgets in CPI releases each month.
With AN looking to the ABS market and growing both sides of its balance sheet in 2025 (recourse or non-recourse), the AN Finance numbers are shaping up well as AN divests some of the legacy assets and makes its transition to a “captive finance only” strategy.
AN is the former #1 among franchised dealers but is now #2 behind Lithia (LAD) with the latter’s extremely aggressive M&A strategy a cornerstone of its growth. Both major dealer groups are setting the stage for more integration of retail and finance operations and will grow as major credit counterparties in what is still a fragmented auto retail industry with many franchises available for steady bolt-on M&A activity.
AN and LAD both show Parts & Services (or “After-Sales”) as the largest profit generator with by far the highest margins. AN has a materially larger Parts & Service business generating 46% of 2024 gross profits. It is about a lot more than retailing vehicles.

With AutoNation printing a 10Y bond deal this past week (+133 bps) and filing its 10-K at the end of last week, we thought an update was in order as the peak spring selling season approaches. We looked at AN in earlier notes (see Credit Crib Note: AutoNation (AN) 6-17-24), but the 10-K gives more granular disclosure on the state of the emerging captive finance business including asset performance and reserving quality.
AN disclosure gives a broad and comprehensive view of the retail numbers from revenue to gross profits to “per unit” metrics. Dealer data gives a useful view on what is happening in the end game of the supplier-to-OEM chain. That is, selling new and used cars at retail, supporting trade-in values, and leveraging the independent dealer networks for maximum value.
Besides their desire to run highly profitable businesses, the dealers are there to provide the customers a favorable experience and efficiently manage the vehicle trade-in process for OEM captive finance units.
The franchise auto dealer space has been a safe place to be in credit and a good place to be in equities despite the softening results in 2024. We see that in the stock charts we include here.
As we show in the chart above, AN has materially outperformed the S&P 500 since the pre-COVID period and pulled away without much volatility. Lithia also was a strong outperformer but had a very different pattern of volatility with its heavy M&A and highly visible digital retailing and used vehicle strategy.
Both the #1 and #2 franchise dealers did quite well with different strategies in a business that is riding a strong consumer cycle and favorable demographics that flow into payrolls. Retirees outside the payroll ranks also keep on driving while expanding payrolls are unfolding in what is a driving nation (vs. a mass transit nation).
The consumer sector has held in relatively well for the industry with same-store new vehicle revenue and unit volumes higher, but at the same time profitability and gross profit margins have been squeezed.

The time horizon numbers in the above stock chart frame up well for dealers generally and AutoNation narrowly. AutoNation has beaten the S&P 500 over 1 year, 3 years, and 5 years. The S&P 500 won the battle over 2 years with the best back-to-back performance since the late 1990s boom. Group 1 has been the top performer in the dealer group the past year.

The above chart highlights the gross profit erosion with gross margins in FY 2024 down to 17.9% from 19.0% in FY 2023. We see 4Q24 showing some mild weakness in YoY margin trends also. AN is like other dealers in providing an extensive array of metrics each quarter including revenue per unit, gross profit per unit data (GPU), and the revenue and brand mix across the franchises.
When you review the dealer releases, it is easy to see how extraordinarily diversified the major dealers are across product segments with some variances on the relative exposure to new vs. used with some more involved in emerging finance businesses (AN, Lithia). Some have invested more heavily in digital retailing (e.g. Lithia) and some more concentrated in premium luxury vehicles and import segments with minimal domestic exposure (e.g. Penske).
AN saw new vehicle retail units higher and used vehicle retail lower. While not shown in the chart above, GPUs for new vehicles were down in FY 2024 and 4Q24. Used was mixed and down for FY 2024 and ticked higher for 4Q24 on GPU. Finance and Insurance (“F&I”) GPU was solid but down by 4.5% in FY 2024 to $2,612. For a frame of reference, GPU was down sharply for new vehicles by -30% to $3,045. GPU for used in FY 2024 was down by -13.4%.
As a sign of auto pricing and affordability strain, revenue per new retail vehicle was down slightly by -1.9% in FY 2024 to $51,227. For 4Q24 that number was $52,849. It is easy to see why autos face an affordability crisis. We can speculate on another day what tariffs and tighter supply will mean for “per unit” vs. “total” metrics. It will not be good for business. That much is certain.
For used vehicles, the revenue per vehicle was down by -4.5% in FY 2024 to $26,614. 4Q24 saw revenue per unit at $27,119, down slightly from 4Q23.

AutoNation slices up its results by business line as detailed above (New, Used, and Parts & Services, Financial Services). For anyone new to the name, it is important not to confuse the Finance and Insurance income line above with the captive auto initiatives we see at AN and Lithia. “F&I” products are gold mines for the dealers and the second largest profit generator behind Parts & Services (aka “After-Sales). AN also uses the term “Customer Financial Services” (“CFS”) in its discussions of F&I.
AN also reports across auto retail reportable segments in the next chart using relevant categories of auto retail: Domestic, Import, and Premium Luxury. Auto Finance under the name “AutoNation Finance” is also a reportable segment that we look at separately.
Among the more important lines in the chart above is the Parts & Services line with its gross margins of around 48% with the P&S profit line amounting to over 46% of total gross profit. We also see Finance and Insurance at over 28% of gross profits. The P&S line and F&I tag team can drive a lot of product revenue per sale. Those business lines go hand in glove with the expansion of new and used vehicle sales for dealers.
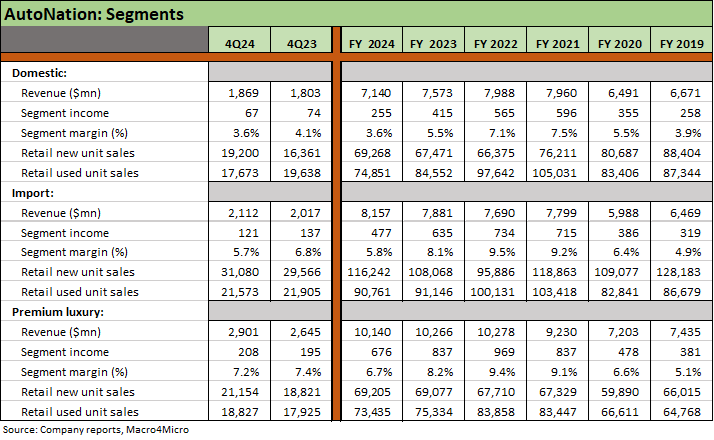
The segment details above show the tight margins you would expect from auto retail activities but also show the importance of the diverse array of brands and product range from the lower margin to luxury. The lowest margins are in the Domestic segment brands in the Ford and GM family tree, as well as in the US Stellantis brands (Chrysler/Dodge/Jeep/Ram).
During 2024, the Domestic segment was 27.2% of units, Imports were 45.6%, and Premium Luxury was 27.2%. For FY 2024, the Premium Luxury segment was 40% of dollar sales, Imports 32%, and Domestic 28%. The luxury and import lines will be negatively impacted by proposed tariffs if Trump follows through. We will see if Parts & Services also suffer on costs and volume with tariffs on auto parts. In theory, the tariff threat pulls in offshore parts whether EU, Asia, Canada or Mexico. That will flow into prices.
Double-digit unit volume shares in Domestic include Ford brands at 11.1% and GM at 10.8%. Legacy Chrysler brands were only 5.3% in FY 2024. Import brands show Toyota at 20.6% of units and Honda at 13.0%. On a positive note, Nissan was only 1.7%. The biggest revenue generator and highest margins are in Premium Luxury with Mercedez at 9.1% of units, BMW at 9.0%, and Lexus at a distant #3 at 3.5%.

The above line items do not reflect the latest AN bond and where those proceeds will flow. The above chart updates the balance sheet lines at 12-31-24 with net debt down modestly YoY, but short-term debt balances growing including commercial paper at $630 mn and current maturities at $518 mn. AN has a bond maturing in Oct 2025 ($450 mn of the 4.5% of 10-1-25).
With its low BBB tier ratings, one assumption is that AN would look to be prudent in balance sheet policies to maximize its range of funding options for a growing captive finance capability. That means IG ratings will be helpful.

The above chart updates AN’s covenant compliance under its credit agreement. The 2.45x leverage under the test is the highest since 3.0x in FY 2018. During FY 2023, covenant revisions changed from a capitalization ratio test to a fixed charge coverage test. Under these covenants, the leverage trend is unfavorable but with plenty of headroom. AN is growing its balance sheet and that will continue.

The above chart updates the key cash flow line items. AN has been more about share buybacks over time while Lithia has been much more oriented toward M&A as it took over the #1 ranking. We cover those topics in our Crib Notes on the two names (see links at the bottom). AN had reservations around some of the dealer level valuations in this cycle and found better value in its own shares. The stock performance of AN indicates that the market has rewarded that strategy.

The above chart highlights the rapid growth of the automotive retail loan business. After acquiring CIG Financial in 2022 (now AutoNation Finance), the unit took up-front allowances for the subprime exposure and grew the portfolio into a higher quality weighted average mix focused on serving AutoNation stores. The above details the balance sheet at period end for the past 3 years as AN embarked on its captive finance plan. The chart below offers some additional disclosures on loan performance and average numbers across the timeline.

The above table shows the rapid changeover from the subprime lender business acquired as a platform to build out AN’s captive effort. The low penetration rate leaves room for a lot of growth over time from 6.0% in FY 2024. We see the higher quality mix in the credit scores and the decline in contract rates reflecting the higher quality buyer base.
See also:
Credit Crib Note: Lithia Motors (LAD) 9-3-24
CarMax F1Q25: Ringside Update on the Used Car Market 6-26-24