
GDP 4Q24 Second Estimate: PCE Inflation the Main Event
An uneventful affirmation of 4Q24 GDP posted PCE price numbers that raise the stakes for the Jan PCE index release on Friday.


Trade policy flows into GDP from a few different blocks.
The updated GDP number in the second estimate were dull at the headline level and unchanged at +2.3%. The hot 4.2% PCE consumption number was also unchanged from the advance estimate.
The PCE price index raised the stakes ahead of Friday’s PCE release for January with so much chatter about tariffs that have not rolled in yet. The Core PCE prices for 4Q24 were revised higher to 2.7% from 2.5%. The headline PCE price index ticked up on the revision to 2.4% from 2.3%. That is not what the Fed wants to see.
We are in one of those pivotal periods in the economy where the Consumer sector is adding a few more signals to make UST bulls happy and growth fans less optimistic. The almost daily headlines of new and/or more specific tariffs do not help on inflation worries or growth handicapping.
The ebb and flow of verbiage on trade by Trump now has copper as a Section 232 review, and the EU is likely to officially (sort of) join Canada and Mexico with blanket tariffs.
Capital budgeting will face a mix of complexities and hurdles with so many tariff scenarios and capex budgets complicated by the uncertain inputs for the fixed investment lines of GDP as well as hiring plans.
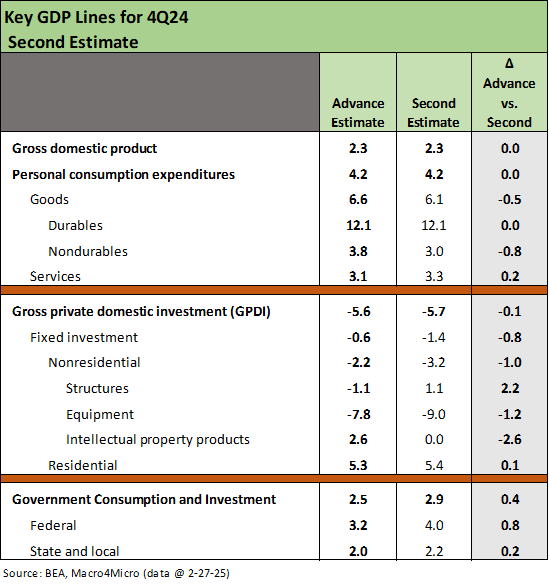
The above chart is the easy part this time around with the top line PCE flat at +4.2% with a few moving parts that netted out to unchanged. The Goods line of PCE came down a little on the revisions of Nondurables while Durables was unchanged. That decline in Goods was offset by an uptick in the larger Services side of the PCE mix. Services is around double Goods in the PCE mix.
We see GPDI move slightly lower on the revisions at -0.1% with Nonresidential weaker and Residential holding up. The biggest higher revisions were in Structures with Intellectual Property off -2.6%. Equipment was weak and got weaker.
The Government line moved higher with Federal higher than the State and Local uptick. That Government line is all over the map in the qualitative commentary from here as the budget gets hammered out. If the market looking for more support from the Government line into 2025-2026, they are more likely to “take the under.”
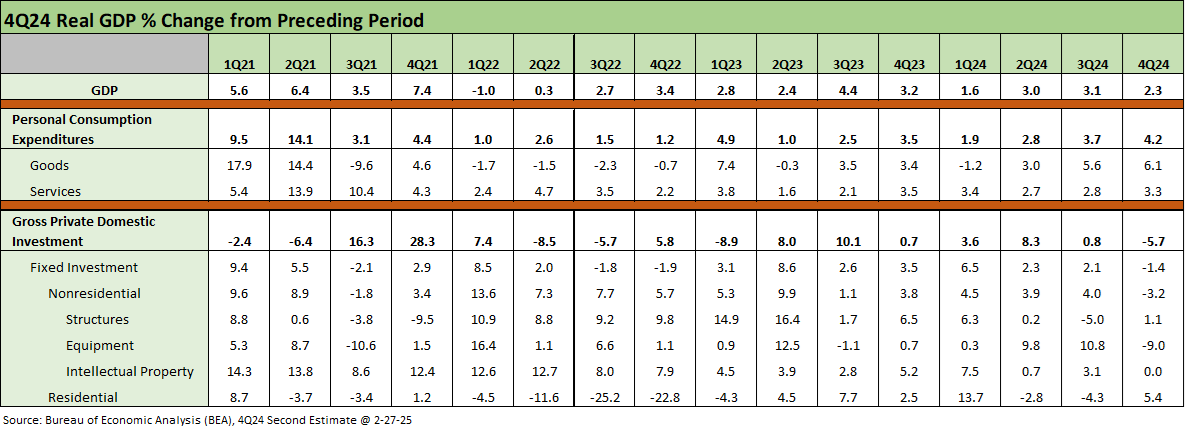
The above table updates the running quarterly GDP tallies from 1Q21 across the Biden timeline and ending with the latest revisions for his last quarter of 2024. We see 4 of the last 6 quarters at 3.0% or higher starting with +4.4% in 3Q23 as inflation was coming down rapidly from the June 2022 peak. The consumer sectors and payrolls were proving resilient as we covered along the way.
The Gross Private Domestic Investment (GPDI) line has often shown volatility across the cycles and as cyclical confidence ebbs and flows, tax incentives roll in, and tariffs disrupt markets. Since 2018, trade clashes and tariffs had decidedly mixed effects on corporate investment and exports (retaliation, impact on trade partner economies, currency effects, etc.). We have covered those histories in other pieces and will revisit again as we wade further into the next round of tariffs and retaliation.
GDP and trade deficits in the context of the moving parts…
The line item deltas from the advance estimate tell a mild story, but the PCE inflation number for the quarter will get UST bears’ blood running ahead of this Friday’s PCE price index. It is way too early to get a read on price action from tariffs, but consumption vs. income and related savings rates will add some useful color on the consumer.
Whenever GDP comes out, it is worth remembering the main pieces with Personal Consumption Expenditures just over 68% of the total, Gross Private Domestic Investment (GPDI) at just under 18% of GDP and Government Consumption at just over 17%. Those three dominant GDP buckets amount to around 103% (68% + 18% + 17%). The swing factor to get to 100% is the -3% from the “net exports of goods and services”.
As Team Trump rants over trade deficits and moves to slap tariffs on the top 6 trade partner nations, the fixed investment outlook gets murky from here (see Auto Tariffs: Japan, South Korea, and Germany Exposure 2-25-25). In all the noise, it is worth keeping in mind the responses to tariff threats can lower the PCE, GPDI, and Government GDP lines directly and indirectly. That negative -3% from the trade deficit that rolls into GDP cannot be evaluated in a vacuum.
The tariff policy rhetoric assumes all of that -3% in the trade deficit is bad despite emanating from private sector decisions that benefit that buyer. There will be reactions to the tariffs over in the103% as policy actions unsettle the ecosystems of the 103% constituents.
If one just assumes all imports are bad, life is easier. It is also dumb. Such assumptions are inevitably simplistic, axed, and reverse engineered by subjective policy goals.
Actions taken to raise costs of imports via taxes – tariffs – can also impact decisions that lower PCE, GPDI, and Government spending. Such actions can even undermine the tax base on the multiplier benefits of the trade flows (see The Trade Picture: Facts to Respect, Topics to Ponder 2-6-25, Tariffs: Questions to Ponder, Part 1 2-2-25). DOGE will do enough damage on the tax base front, but it is worth keeping in mind that total non-defense Federal consumption/investment was only 2.7% of GDP.
The catharsis for the DOGE Gang in firing so many people will show up in other GDP lines even if just PCE and a reduction in state and local budgets as the tax base erodes. There are always multiple economic impacts. The same goes for cutting off payments to so many recipients from the ag sector to NGOs that support so many end markets (or causes). The psychic reward value for the manpower pillagers and budget axe-wielders in Washington does not get a line item. Trillions more will be added to budget deficits regardless in the proposed budget.
As much as Team Trump simplifies the trade issues, the reality will play out in the market just as it did in 2018-2019 (see Histories: Asset Return Journey from 2016 to 2023 1-21-24). During 2018, asset performance was terrible. During 2019, exports and investment weakened, and the Fed had to ease. The higher costs in 2025 will lead to decisions in the private sector and at the household level for PCE. They don’t have to go along with the political sales pitch.
The policy pitches are delivered by some highly credentialed enablers on the power-seeking circuit, but they show up with glaring misstatements of facts (some by omission) and misapplications of basic economic concepts. In other words, their PhD pedigree means squat if they reverse engineer, omit, and/or misstate.
Among the more notable fact and concept gaps from the White House that are not addressed factually or conceptually is that the buyer pays the tariffs, trade deficits are not a US subsidy but a private sector purchasing decision, and the single metric at the border (trade deficits) in no way captures the full direct secondary and tertiary economic impacts.
Tariff policy tough to model for corporate sector capital budgets…
This next round of tariffs will dwarf what the market experienced in 2018-2019. Back then, NAFTA was actually updated into what became Trump’s USMCA deal. The current direction sets the stage for the termination of the USMCA. The terms of the USMCA are already being breached by the proposed tariffs. Further this past week, Trump affirmed he was going after the EU (#1 trade partners as a bloc on both imports and exports).
At the same time, Trump is putting copper on his list for tariffs. Attacking materials from the base metals (aluminum, copper) to steel will have an effect on manufacturing cost structures that is somewhat obvious. That is even before the retaliation and possible disruptions in production chains that have reverberating effects on finished goods production rates.
Those of us who spent some time watching copper names in the credit markets in past decades remember the legacy names getting rolled up over the cycles (Amax, Cyprus, Phelps Dodge, Asarco, Freeport-Mac, etc.). The basic realities of high-cost vs. low-cost mines were usually at the heart of the struggle for some mining companies.
The metals sector restructurings came along with the usual cyclical volatility seen in the late 1970s and early 1980s with some rough stretches in the 1990s –notably in emerging markets. Nationalization battles of bygone years in Latin America (e.g., Chile nationalized copper, later rolled into Codelco, etc.) was part of the story of the late1960s/early 1970s. Even the international US oil companies were heavily involved in the metals sector along the way (e.g. Amoco, Sohio).
For commodities, a good rule is “lowest cost and strongest balance sheet wins.” Contrary to the political pitch, putting tariffs on low-cost base metals is “ripping off” the manufacturers who need those materials from offshore sources. Among the largest end markets for copper is construction. That is a topic for another day. Copper hits a lot of products serving construction and also hits autos.
In the end, competitive production costs in commodity markets were the usual drivers of who won and who lost. US interests were spread all across the globe even before the industry was rolled up into a few dominant non-US metals players. If you are in a mining nation facing US tariffs in metals, the first thing you put on your list for retaliation is Caterpillar and throw your weight behind a European mining equipment operator. Then you dial up China to see what can be worked out.
The economics of these product groups only get more complicated from here. We can always annex Peru and Chile after the US Navy ships sail over through the new Trump Canal. At least we haven’t rule it out. We’re still uncertain about the Electoral College votes to be allocated to Canada, Greenland, Peru, and Chile. Panama gets zero. That is not an official forecast.
See also:
New Homes Sales Jan 2024: Homebuilders Feeling Cyclical Signals? 2-26-25
Auto Tariffs: Japan, South Korea, and Germany Exposure 2-25-25
Footnotes & Flashbacks: Credit Markets 2-24-25
Footnotes & Flashbacks: State of Yields 2-23-25
Footnotes & Flashbacks: Asset Returns 2-23-25
Mini Market Lookback: Tariffs + Geopolitics + Human Nature = Risk 2-22-25
Existing Home Sales Jan 2025: Prices High, Volumes Soft, Inventory Up 2-21-25
AutoNation: Retail Resilient, Captive Finance Growth 2-21-25
Toll Brothers 1Q25: Performing with a Net 2-20-25
Housing Starts Jan 2025: Getting Eerie Out There 2-19-25
Herc Rentals: Swinging a Big Bat 2-18-25
UST Yields: Sept 2024 UST in Historical Context 2-17-25
Tariff links:
Auto Tariffs: Japan, South Korea, and Germany Exposure 2-25-25
Mini Market Lookback: Tariffs + Geopolitics + Human Nature = Risk 2-22-25
Reciprocal Tariffs: Weird Science 2-14-25
US-EU Trade: The Final Import/Export Mix 2024 2-11-25
Aluminum and Steel Tariffs: The Target is Canada 2-10-25
US-Mexico Trade: Import/Export Mix for 2024 2-10-25
Trade Exposure: US-Canada Import/Export Mix 2024 2-7-25
US Trade with the World: Import and Export Mix 2-6-25
The Trade Picture: Facts to Respect, Topics to Ponder 2-6-25
Tariffs: Questions to Ponder, Part 1 2-2-25
US-Canada: Tariffs Now More than a Negotiating Tactic 1-9-25
Trade: Oct 2024 Flows, Tariff Countdown 12-5-24
Mexico: Tariffs as the Economic Alamo 11-26-24
Tariff: Target Updates – Canada 11-26-24
Tariffs: The EU Meets the New World…Again…Maybe 10-29-24
Trump, Trade, and Tariffs: Northern Exposure, Canada Risk 10-25-24
Trump at Economic Club of Chicago: Thoughts on Autos 10-17-24
Facts Matter: China Syndrome on Trade 9-10-24
Thank you.
Here are my Jan PCE estimates:
https://arkominaresearch.substack.com/p/jan-2025-pce-estimate?r=1r1n6n