
Footnotes & Flashbacks: State of Yields 3-16-25
We had a very quiet week along the UST curve with the action concentrated in equities and HY spreads.


Is that the Fed’s shadow? No…it’s the tariffs, stupid.
It is an unusual time when fleeting FOMC message uncertainty is a nice break from the real uncertainty of more Trump tariff tantrums.
The Fed will not factor into its game plan or dot plots the theoretical tariff roulette and macro level outcomes or for that matter the micro level price and cost pressures.
It will be interesting to see how the FOMC would address some payroll weakness in the coming two months even if the Fed did not have a clear read on tariff inflation impacts.
The UST curve dynamics right now are trying to balance fears of consumer retrenchment and capex defensiveness with the worries around goods inflation risk (or the fear of “reduced purchasing power” for the semantically slick economist crowd who seek to avoid the “I” word)
While people in touch with reality know that tariffs will do damage one way or the other, the debate over economic weakness and lower UST rates vs. stagflation and a struggling UST curve on record UST supply will keep the point-counterpoint going.

The above chart updates our weekly UST curve migration across the cycles from the 1978 Carter inversion through some major moments in credit cycle and economic expansion/contraction history. We see the latest bear steepener off the Sept 2024 lows and await the next round of economic cycle signals that can only get sorted out once the final tariff targets and retaliation get into play. See the links at the bottom of this commentary for the latest round of tariff and asset performance action.

We update the UST migration above from the end of 2021 across the tightening cycle through the big year-end rally in 2023 into what since then has been a bear steepening as the crow flies with some side trips along the way.

The above chart updates the ride from the 10-19-23 peak into the year end 2023 and the eventual decline to the recent lows in Sept 2024 when the easing cycle started. That did not last long with the ensuing return to a bear steepener into 2025.

The above chart updates the 1-week UST deltas. We looked at the YTD deltas in the Mini Market Lookback: Self-Inflicted Vol (3-15-25). The real action comes with more tariff noise and when those tariffs start getting collected (from the buyer, not the seller (!) despite what Trump says). The FOMC commentary and dot plot will matter this week, but tariffs and retaliation will be driving the bus for a while.

We update the YTD deltas in the above, and the shifts have been good for duration. The extremely poor equity performance has allowed the bull flattener to give bond ETFs a relative edge in performance as we cover in Footnotes & Flashbacks: Asset Returns 3-16-25 and Asset Returns and UST Update: Pain Matters (3-5-25).

The running deltas from the September 2024 lows (9-16-24) are updated above. We see a return to another bear steepening. That is going to be a recurring battle as the market hashes out what is simply damaging to the cycle from tariffs and what is potentially stagflationary.

We update the UST deltas above from the post-peak UST rally in Nov-Dec 2023. We then rolled into a very mixed 2024 that went into a bear steepener in 1H24 and then a rally into the easing period to the UST lows that we captured in an earlier chart. The UST then moved back to what we see above for the running 2024 and YTD 2025 steepener.

The UST deltas above update the running changes from the 10-19-23 peak. By any measure, that shift was a material bull steepener. The stall in FOMC easing will be a focal point if the tariffs continue to take the economy down a slowdown path on the consumer side and along the fixed investment lines.

The above chart updates the UST curve for this past Friday and Freddie Mac 30Y mortgage benchmark rate (noon Thursday release). We include two useful historical periods including the peak homebuilder year end of 2005 and mid-2006 when RMBS quality concerns were catching headlines as the housing bubble was peaking. We post UST curves for each period in the chart.
We are seeing mortgage rates slowly coming down again to the current 6.65%, which was essentially flat to last week (+2 bps). The mortgage spreads remain a headwind vs. earlier periods even if mortgages are down from the sharp rise after the Sept 2024 lows when the 30Y mortgages ran back to the 7% area.
The materially lower UST curve and 10Y UST now vs. 2006 still see current mortgage rates closer to but slightly below mid-2006 (6.65% mortgages now vs. 6.78% then). The Dec 2005 Freddie Mac 30Y rate at 6.22% is below current mortgage rates despite a slightly higher 10Y UST in Dec 2005 vs. the past Friday close.
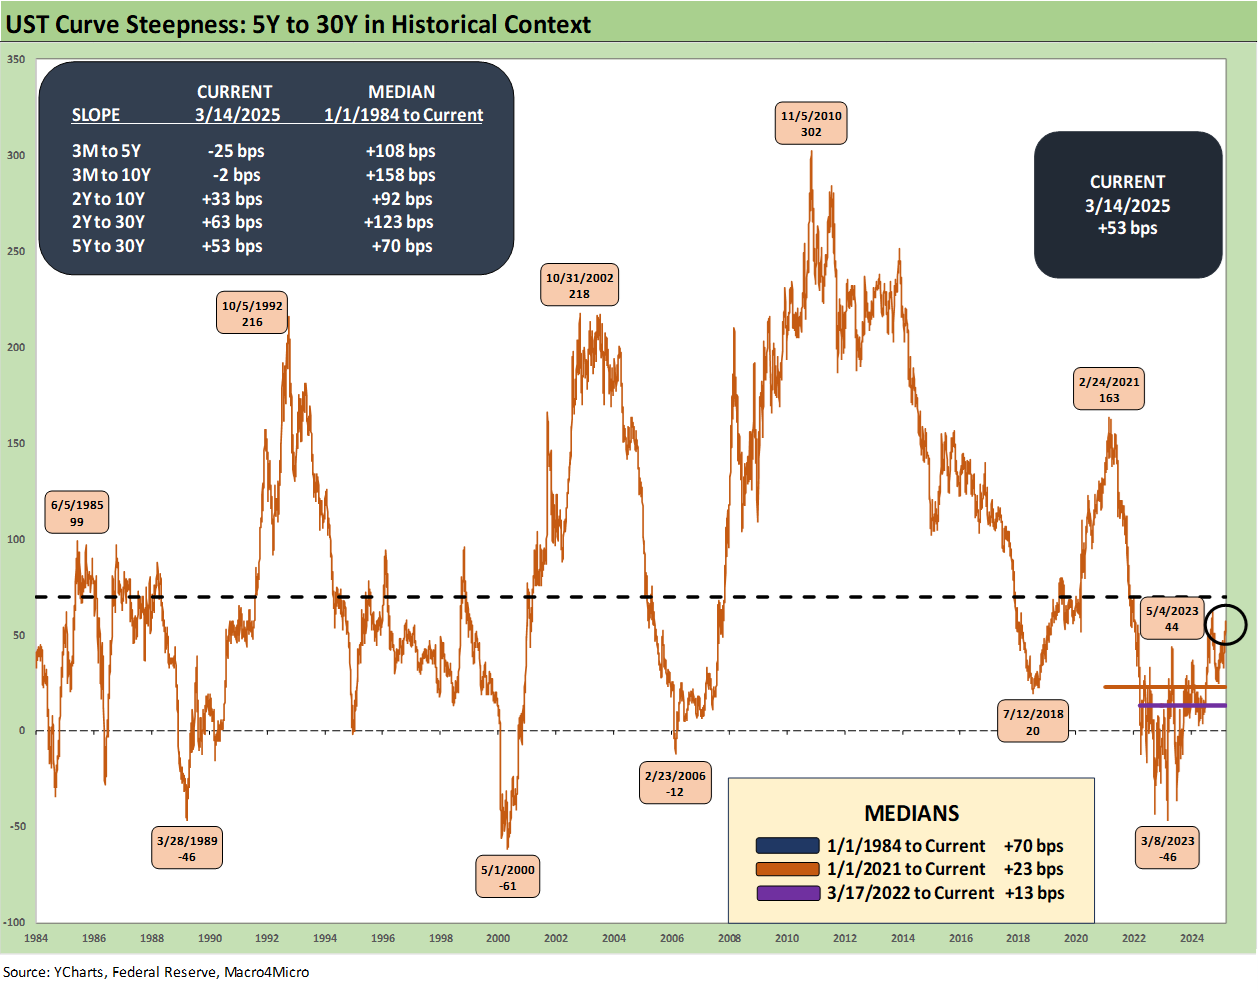
The above chart updates the UST slope from 5Y to 30Y from 1984 for an update on the term premiums for extending. This slope has been normalizing and is now at +53 bps, which is inside the long-term average of +70 bps but well above the inversion. The chart shows the peak inversion in early March 2023 at -46 bps.
The peaks and lows each have their own story with early 2021 steep as the post-COVID boom was getting underway and the front end was still in ZIRP. The 2010 peak was also in ZIRP world with an improving set of prospects coming off the crisis lows.
The 2002 peak was with Greenspan in full support mode but into an expansion set against the back end of an ugly credit default cycle (TMT, Enron, WorldCom et al). Oct 1992 was also into an expansion with very strong Fed support to help banks face a real estate crisis. The market was also seeing a range of industries making a comeback alongside a wave of bank consolidation getting underway.
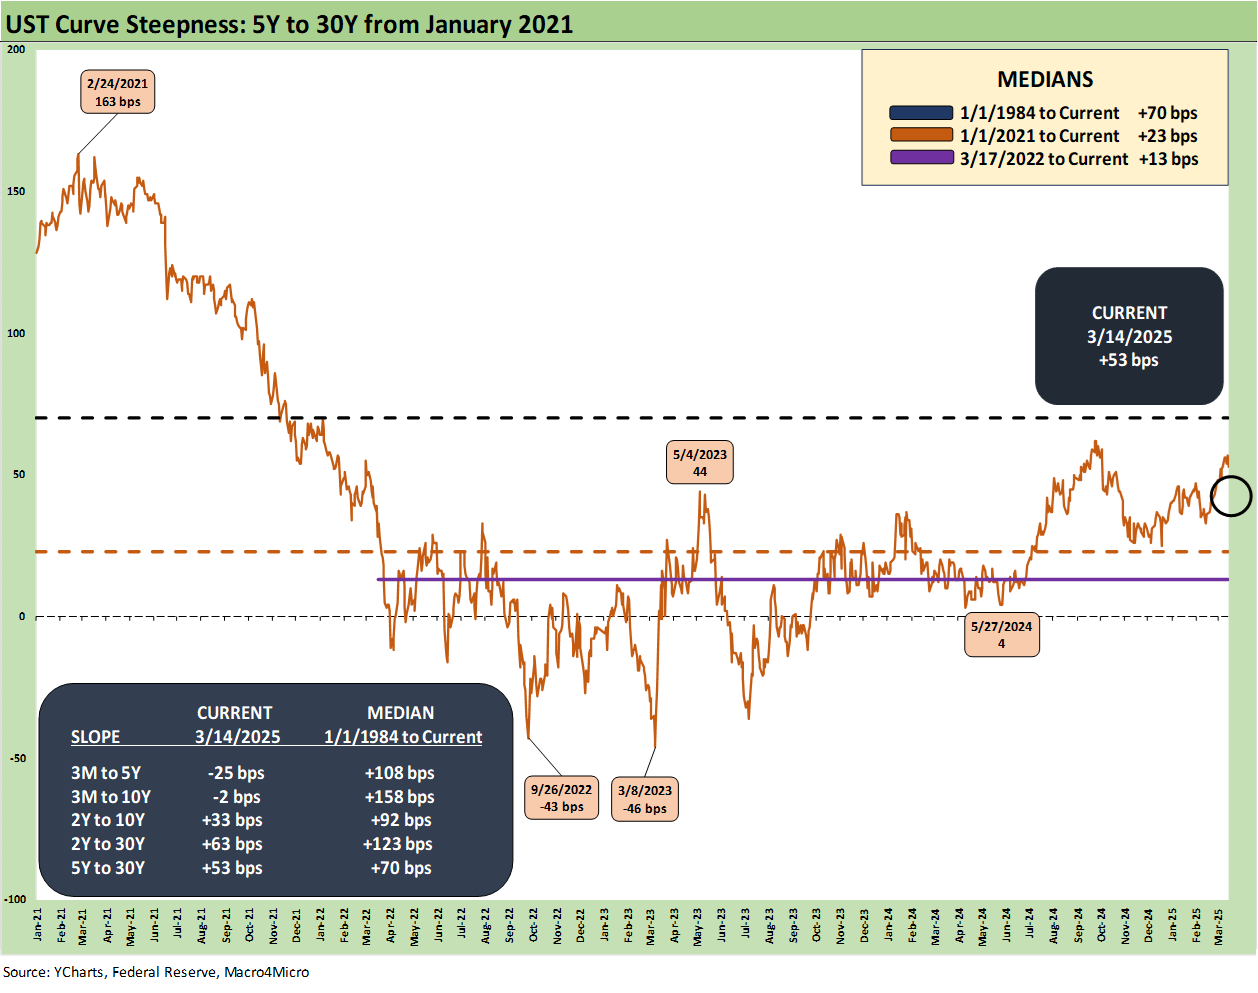
The above chart shortens up the 5Y to 30Y slope time horizon. We see +163 bps in Feb 2021 down to -43 bps in Sept 2022 as the tightening cycle was underway and then back to -46 bps in March 2023.

We wrap this week’s State of Yields with an update of the running UST deltas since March 1, 2022 just ahead of the end of ZIRP (effective 3-17-22). We include the 12-31-20 UST curve and 10-19-23 peak UST curve as frames of reference.
See also:
Footnotes & Flashbacks: Asset Returns 3-16-25
Mini Market Lookback: Self-Inflicted Vol 3-15-25
Credit Spreads: Pain Arrives, Risk Repricing 3-13-25
Trade: Betty Ford Tariff Wing Open for Business 3-12-25
CPI Feb 2025: Relief Pitcher 3-12-25
JOLTS Jan 2025: Old News, New Risks in the Market 3-11-25
Credit Spreads Join the Party 3-10-25
Footnotes & Flashbacks: Credit Markets 3-10-25
Footnotes & Flashbacks: State of Yields 3-9-25
Footnotes & Flashbacks: Asset Returns 3-9-25
Mini Market Lookback: Tariffs Dominate, Geopolitics Agitate 3-8-25