
Footnotes & Flashbacks: State of Yields 3-9-25
As stagflation scenarios creep into the asset allocation debate, the past week sees another steepener.


DOGE: Pinhead offers new Lament Configuration box for terminating veterans
The risk checklist just keeps on growing subject to stark revisions at the whims of Trump even as Elon Musk complicates relations with Europe and Trump gets closer to Putin. A lot more overriding tariff risks need relative specificity if not certainty.
The idea that Europe and Canada will need to ramp up borrowing for multiple needs (fiscal relief for tariff victims, defense spending, infrastructure) promises a record-shattering supply of high-quality sovereign borrowing from even more NATO allies (or soon-to-be-former NATO allies) at a time of other-worldly funding needs for US deficits. A soaring supply of sovereign alternatives to UST in theory creates yield competition in all markets with more “former” allies’ debt available as alternatives to UST.
Marketing the “strong dollar tariff cost offset” in one room is a challenge while quietly debating the need for a weaker dollar in another room. The “Mar-a-Lago Accord” idea is getting some focus in a throwback to the Plaza Accord of 1985, where US allies saved America’s bacon. In today’s world, they don’t make allies like they used to – with the US as Exhibit A.
Quietly pitching a weak dollar plan is not exactly a marketing aphrodisiac for UST demand after trade war threats weakened some material trade partner currencies and alienated many offshore investors.
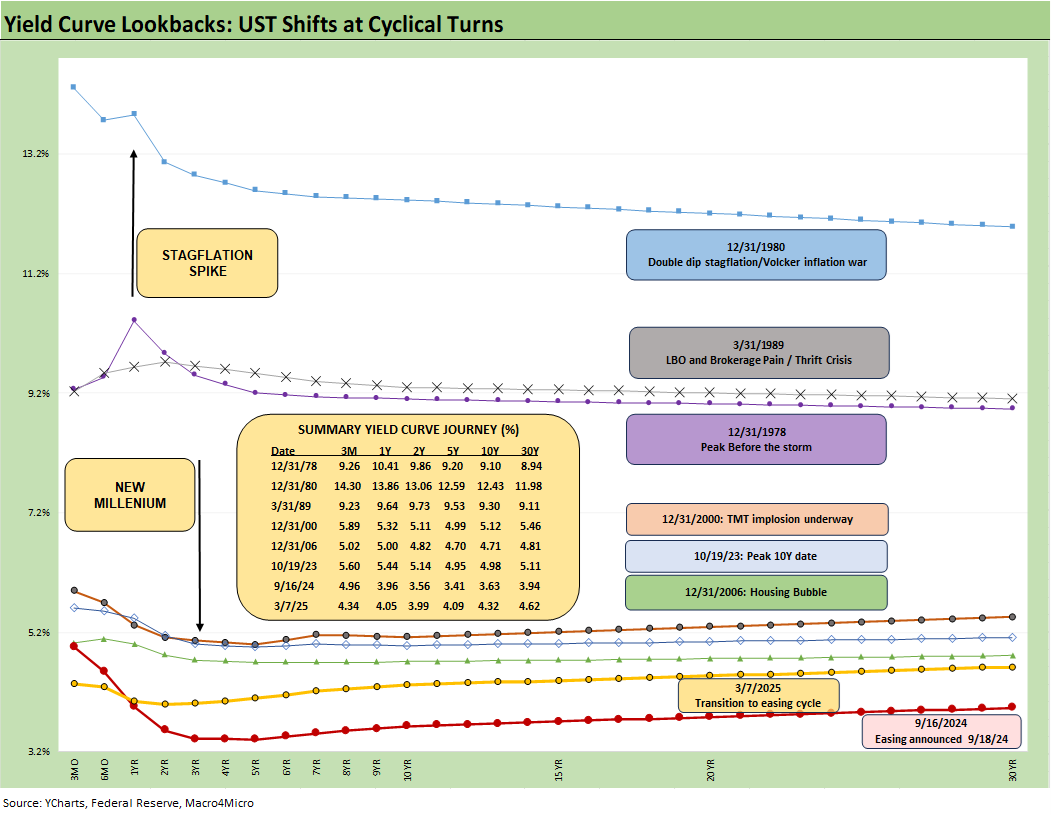
The above chart updates the UST migration across some key periods since the Carter inversion of 1978. We select periods that we find among the more interesting transition points in monetary, economic, or credit market cycles. We label the periods and include the yields in the box.
We see the recent bear steepener off the Sept 2024 rally lows after we also experienced a similar steepener in 1H24 off the late-2003 rally. The current inversion has the UST slope watchers flagging recession fears yet again, and this time around it is easier to make that case than in the fall of 2022 when PCE was solid and payroll/employment was strong.
The X-factor this time is the tariff threat. There are many variables, but the scale, breadth, and scope of the supplier chain tax and consumer tax has never been seen in the postwar period of more globalized markets. The fact that the architect keeps saying “seller pays” the tariff is not helping confidence (in his grasp of the economic issues) as evidenced in rising consumer inflation expectations.

The above chart shows the journey from 10-19-23 when the 10Y UST peaked on the way into an impressive UST rally in Nov-Dec 2023. Then a bear steepener in 1H24 bucked consensus before the plunge into the easing period of the Sept 2024 lows which then saw a fresh bear steepener period follow.
The current battle seems to be settling in on a “recession risk vs. stagflation risk” debate with the soft landing and moderate inflation scenario falling behind on the list for now. That soft landing was in the lead before Trump went off the rails on tariff threats.

The above chart updates the UST migration since the end of 2021, across the tightening cycle and now into the easing cycle. We include a memory box in the chart for the FOMC tightening and easing and related dates and scale.
We get an FOMC meeting and dot plot later this month (March 19). The FOMC is expected to hold the line. As of now, CME odds are at 97% unchanged for the March meeting, 67% for May, and almost 58% for June. The delays in tariff launches will keep the expectations murky. See the tariff links at the bottom of this commentary for more details on the tariff circus.
The inflation vs. one-time price hike has muddied the economic dialogue. The main counterpoint from tariff apologists is that it is a one-time hike. In plain language that would mean a major reduction in purchasing power and a recurring unit cost hit to companies with supplier chains sensitive to the tariffs. The tariff advocates just won’t say it that way.
Since there are no major one-time increases in wages that come with the 25% tariffs, we notice the evasion of the wage expectation topic and pricing strategies of corporations at sea level. Economists reverse engineer their views on this. It all starts with “who pays” and the White House won’t even admit “buyer pays” in plain language.
Economists rather divert the attention back to monetary policy double-talk only (their comfort zone) and evade questions of sea-level manufacturer reality or household needs to address that one-time increase as their purchasing pie shrinks materially. That flows into demand and pricing for somebody somewhere.
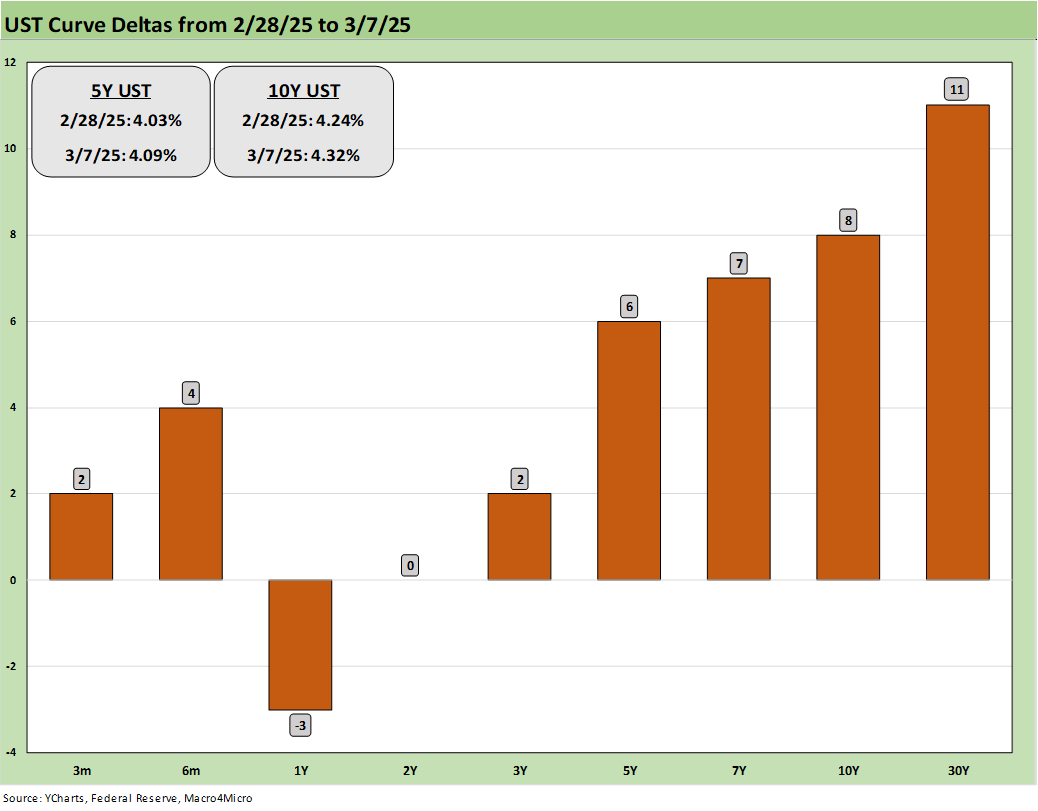
The above updates the UST deltas for the week. We see a mini bear steepening that sent 6 of 7 bond ETFs we track into the red (see Footnotes & Flashbacks: Asset Returns 3-9-25).
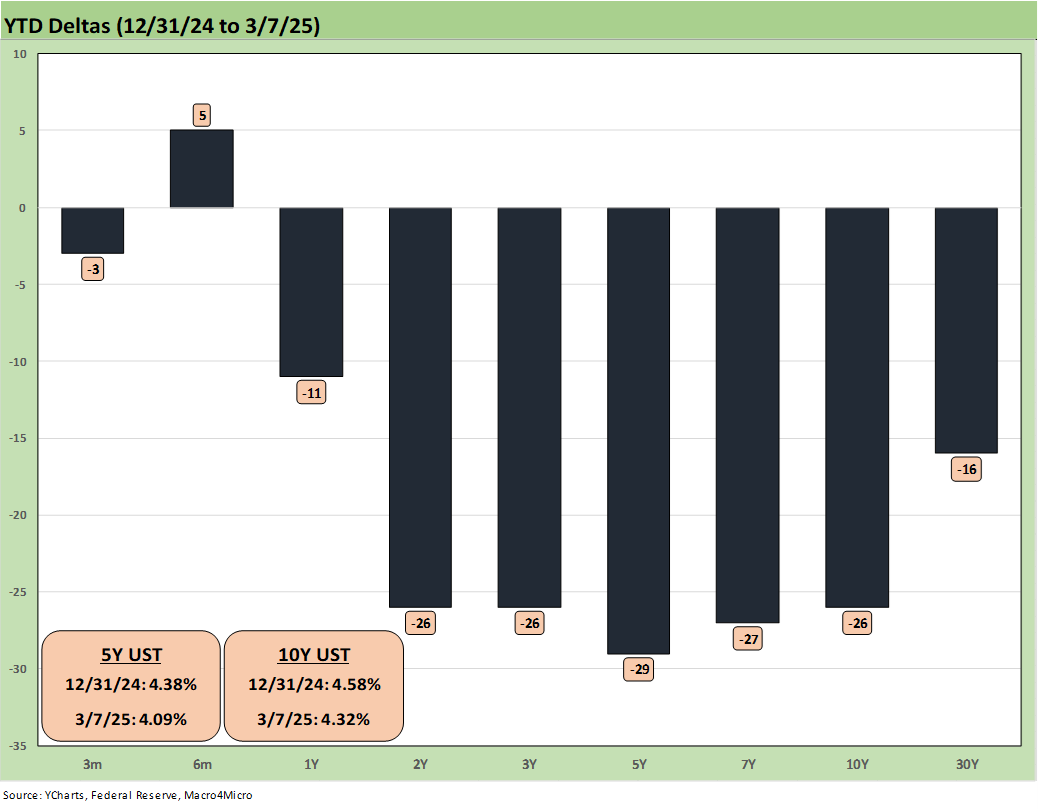
The above chart updates the YTD deltas and the bull flattener that has held in on economic jitters around the consumer and tariff fallout while inflation metrics have not moved much (see PCE Jan 2025: Prices in Check, Income and Outlays Diverge 2-28-25). We get a fresh CPI number this week.

We present the UST shifts off the 9-16-24 UST curve earlier in this piece. The above shows the UST deltas along the curve since then. UST bulls would like to revisit that 3.6% handle 10Y UST and so would homebuilders as that Sept 2024 curve also saw the Freddie Mac 30Y mortgage rate down close to 6.0%.

The above chart updates the UST deltas from the end of 2023 after the market saw a massive rally in the UST curve into the end of the year after the 10-19-23 peak. That rally came alongside a major rebount in both equities and credit (see Footnotes & Flashbacks: Asset Returns 1-1-24, Footnotes & Flashbacks: State of Yields 1-1-24).
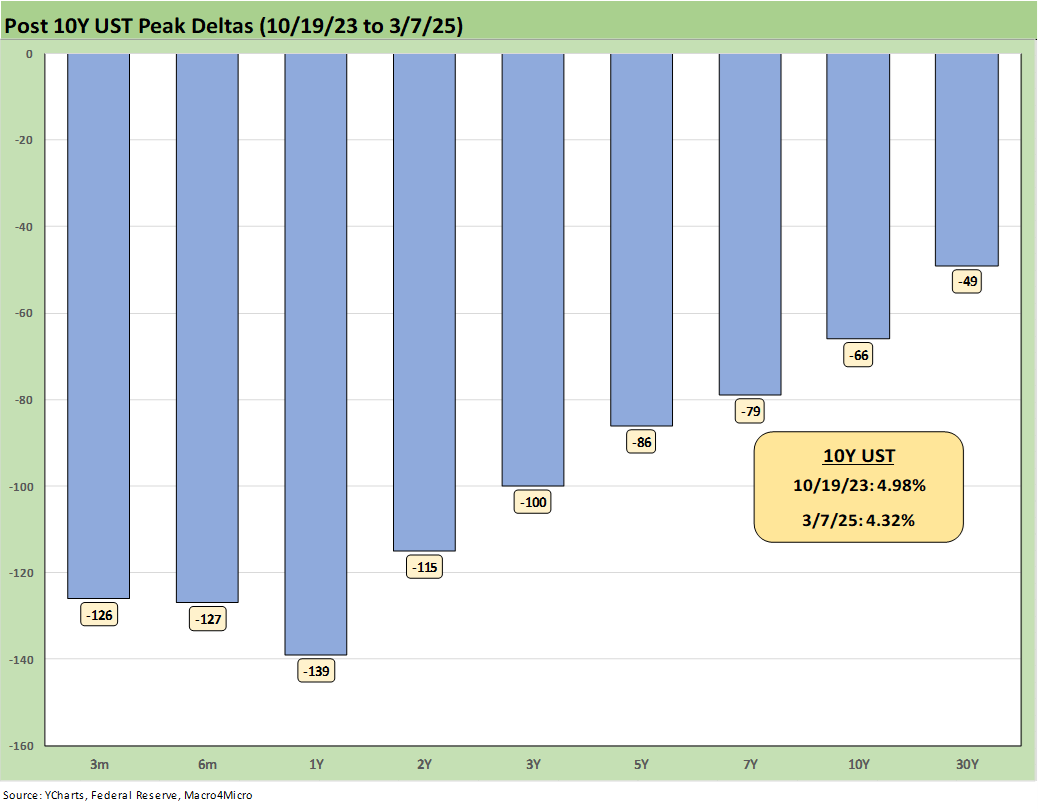
The above chart updates the run rates from the UST peak in Oct 2023 when the 10Y UST hit its highs (10-19-23). That is an impressive bull steepener.

The above chart updates the UST curve for this past Friday and Freddie Mac 30Y Mortgage benchmark rate (noon Thursday release). We highlight two useful historical periods including the peak homebuilder year end of 2005 and mid-2006 when RMBS quality concerns were catching headlines as the housing bubble was peaking. We post UST curves for each period in the chart.
We are seeing mortgage rates slowly coming down again to the current 6.63%, but the mortgage spreads remain a headwind vs. earlier periods. The materially lower UST curve and 10Y UST now vs. 2006 still see current mortgage rates closer to but slightly below mid-2006 (6.63% mortgages now vs. 6.78% then). The Dec 2005 Freddie Mac 30Y rate at 6.2% is well below current mortgage rates despite a slightly higher 10Y UST in Dec 2005 vs. the past Friday close.

We look at the UST slope for 2Y to 10Y across the timeline from 1984, and the slope is now back to +33 bps vs. the long-term median of +92 bps. We still see inversions from the front end with the 3M UST to 10Y UST slope at -2 bps this week. This configuration makes it tough to make a case for the 10Y UST to move materially lower without some notable economic trouble or lower inflation that gives the FOMC room to maneuver on the front end. The expected supply of longer dated UST will be a work in process as the budget battles unfold in the coming days.

The above chart shortens up the timeline with a start during the ZIRP period in early 2021. We see the spike in the slope to +159 bps in March 2021 on the way to the inversion of -108 bps in July 2023 back to the current modestly upward sloping +33 bps. The differential in slope vs. the long-term median is +59 bps (92 bps minus 33 bps).
Some FOMC easing might send us back closer in the direction of the median slope, but that is a very low 10Y UST yield relative to the pre-crisis, pre-ZIRP cycles as we detail in the earlier charts. Easing by the FOMC in tandem with a downward shift on the long end takes a lot to go the way of the UST bulls. That also could imply much would go wrong for equity and credit risk bulls.

We wrap this week’s State of Yields with an update of the running UST deltas since March 1, 2022 just ahead of the end of ZIRP (effective 3-17-22). We include the 12-31-20 UST curve and 10-19-23 peak UST curve as frames of reference.
See also:
Footnotes & Flashbacks: Asset Returns 3-9-25
Mini Market Lookback: Tariffs Dominate, Geopolitics Agitate 3-8-25
Payrolls Feb 2025: Into the Weeds 3-7-25
Employment Feb 2025: Circling Pattern, Lower Altitude 3-7-25
Tariffs: Enemies List 3-6-25
Gut Checking Trump GDP Record 3-5-25
Trump's “Greatest Economy in History”: Not Even Close 3-5-25
Asset Returns and UST Update: Pain Matters 3-5-25
Happy War on Allies Day 3-4-25
Footnotes & Flashbacks: Credit Markets 3-3-25
Footnotes & Flashbacks: Asset Returns 3-2-25
Footnotes & Flashbacks: State of Yields 3-2-25
Mini Market Lookback: Collision Courses ‘R’ Us 3-2-25
PCE Jan 2025: Prices in Check, Income and Outlays Diverge 2-28-25
Durable Goods Jan25: Waiting Game 2-27-25
GDP 4Q24 Second Estimate: PCE Inflation the Main Event 2-27-25
New Homes Sales Jan 2024: Homebuilders Feeling Cyclical Signals? 2-26-25
Existing Home Sales Jan 2025: Prices High, Volumes Soft, Inventory Up 2-21-25
AutoNation: Retail Resilient, Captive Finance Growth 2-21-25
Toll Brothers 1Q25: Performing with a Net 2-20-25
Housing Starts Jan 2025: Getting Eerie Out There 2-19-25
Herc Rentals: Swinging a Big Bat 2-18-25
UST Yields: Sept 2024 UST in Historical Context 2-17-25
Tariff links:
Auto Tariffs: Japan, South Korea, and Germany Exposure 2-25-25
Mini Market Lookback: Tariffs + Geopolitics + Human Nature = Risk 2-22-25
Reciprocal Tariffs: Weird Science 2-14-25
US-EU Trade: The Final Import/Export Mix 2024 2-11-25
Aluminum and Steel Tariffs: The Target is Canada 2-10-25
US-Mexico Trade: Import/Export Mix for 2024 2-10-25
Trade Exposure: US-Canada Import/Export Mix 2024 2-7-25
US Trade with the World: Import and Export Mix 2-6-25
The Trade Picture: Facts to Respect, Topics to Ponder 2-6-25
Tariffs: Questions to Ponder, Part 1 2-2-25
US-Canada: Tariffs Now More than a Negotiating Tactic 1-9-25
Trade: Oct 2024 Flows, Tariff Countdown 12-5-24
Mexico: Tariffs as the Economic Alamo 11-26-24
Tariff: Target Updates – Canada 11-26-24
Tariffs: The EU Meets the New World…Again…Maybe 10-29-24
Trump, Trade, and Tariffs: Northern Exposure, Canada Risk 10-25-24
Trump at Economic Club of Chicago: Thoughts on Autos 10-17-24