
Footnotes & Flashbacks: Credit Markets 3-10-25
Credit spreads settled into a slow quality spread widening mode with HY OAS still slightly inside the end of June 2007.


You can only do so much to dress up high tariffs and pending trade wars…
Equity weakness has not been enough to meaningfully shake HY credit spreads in historical context with lag times and questions around the full delivery of the tariff pain, the eventual flow into the corporate and consumer sector, and the more visceral tariff retaliation to much higher and wider tariffs this time.
The situation with Canada and EU seems the ugliest given the NATO history and Trump behavior patterns, the betrayal themes, and the hostile geopolitical tone of Trump vs. the ongoing trend to “former ally” status for some (most) European nations and Canada. The embrace of Putin cannot help but be a factor in retaliation and raises material domestic political risk.
The +28 bps widening in a month for HY OAS and quality spread decompression tells a story of modest defensiveness, but IG spreads have been muted with Trump dragging out the lag time on tariff and retaliation effects to this point. Healthy banks help. Cyclical anxiety will be rising with tariffs and eventual guidance warnings.
The exceptional spread compression history has a long way to go on decompression relative to past cycles even to get close to the long-term median. That will take more ugly catalysts and tariff escalation, which Trump seems inclined to deliver.
The last two major credit cycles saw material financial system weakness and highly exposed, interconnected banks and securities firms. Financial sector interconnectedness is a lower risk factor in this cycle. It is not gone.

The above chart updates the YTD total returns and excess returns for IG and HY as well as the credit tiers. We see that the UST moves have dominated the total return side of the equation with spreads slightly wider in IG and excess returns negative. In HY, the higher coupons give the excess return edge to HY vs. IG but with the CCC tier wider on the year at +45 bps vs. only +1 bps for the BB tier after the moving parts of constituent changes rolled in.

IG spreads had what in recent history has been a mild stretch of extremely tight, resilient spreads. This past week saw +1 bps widening in IG to +89 bps after the prior week had posted a rare (in recent context) widening of +7 bps to +88 bps. The double-digit IG OAS levels remain around the levels seen in numerous cyclical lows with the June 2014 lows of +106 bps marking a higher point before Feb 2018 saw +90 bps and Sept 2021 at +86 BPS.
The current +89 bps is only modestly above the +77 bps lows of 4Q24. Considering the size of the BBB tier in absolute and relative terms, these spreads are tight considering the very noisy headlines of late around the cycle. For IG, the banks are the anchor for IG credit market calm at this point, but we will begin to see more worries around consumer credit quality from cards to autos.
Autos and Manufacturing are in the tariff crosshairs. If Trump gets his desired ties to Putin fully on track, we could eventually see Russia return to the oil markets at significant risk to oil prices in a major BBB tier sector.

HY had another widening week at +10 bps this week after +9 bps last week with HY OAS now up to +297 bps. That HY OAS level is still just inside the +300 bps demarcation line that is seldom crossed as noted in the chart above.
The +297 bps is also inside (barely) the June 2007 month-end levels. HY is +28 bps wider over the trailing 1-month period and is +37 bps above the +260 bps lows of Nov 2024.
As a reminder, HY OAS hit lows of +244 bps in Oct 1997 (IG had hit +53 bps) and closed that year at +296 bps in Dec 1997. For June 2007, the HY OAS low was +241 bps on June 1, 2007 (and June 5) and then closed June 2007 at +298 bps. The +300 bps handles of Dec 2021, Jan 2020, Oct 2018, and June 2014 offer other reminders of how tight this market remains.

As we covered in Mini Market Lookback: Tariffs Dominate, Geopolitics Agitate (3-8-25) quality spreads across the HY-IG differential widened by +9 bps on the week to +208 bps and are wide to the low of 2021, 2018, and inside the lows of June 2014. June 2007 at +147 bps remains in a different zip code.

The BB OAS minus BBB OAS quality spread differential widened by +4 bps to +77 bps with BBBs +1 bps wider and BBs +5 bps wider.

The BB tier OAS saw a modest spread widening of +5 bps as part of what was a typical (but mild – so far) quality spread widening pattern in HY with the BB tier +5 bps wider to +187 bps, the B tier +12 bps wider to +300 bps, and CCC tier +31 bps wider to +791 bps.

The B tier OAS is now sitting on the +300 bps line, which is +46 bps above the Nov 2024 lows but is still below the B tier OAS lows of Dec 2021, Jan 2020, Oct 2018, and June 2014 as noted in the chart above. The long-term median of +466 bps is a long way off (+166 bps away).
Looking back to the 2007 bubble period, the June 2007 low tick for the B tier was in the sub-240 bps range at +236 bps. We highlight that June 2007 ended that month with the B tier at +296 bps or slightly below current levels. The B tier lows of 1997 stood at +292 bps back in the TMT years. In other words, the B tier OAS is still tight even after the material widening over the past 4 months and much of it recently.

The above chart updates the comparative histories of the B tier and CCC tier and highlights major points of divergence between the two. The current +791 bps is pushing wider with the CCC tier at +81 bps wider the past month and +45 bps YTD (vs. +954 bps long-term median).
The CCC tier is always subject to the constituent migration patterns including dropouts (defaults) and exchanges (coercive or otherwise) that can move the needle (see The B vs. CCC Battle: Tough Neighborhood, Rough Players 7-7-24).

The above chart shortens the timeline from the period just before the March 2022 tightening cycle for better visuals on more recent B vs. CCC OAS action.

The quality spread differential of “CCC OAS minus B OAS” of +491 bps is slightly wide to the +482 bps long-term median. The differential has narrowed impressively since the peak of +741 bps during the cyclical anxiety period of the tightening cycle in fall 2022. Some of that tightening is tied to exits and some to distressed exchanges but also to a broader risk asset rally that had been mirrored in equities and other credit markets. As of now, equities are reconsidering life in the face of tariffs.
The current +491 bps quality spread differential is modestly wide to 4 of the 6 timeline medians broken out in the box with the notable exception of the TMT bubble and collapse of that market into early 2001. The current level is also inside the “COVID to current” median of +537 bps.

The above chart zeroes in on the 2022-2025 timeline for the CCC-B tier quality spread differential. The constituent shifts across some notable exchanges and dropouts and a major credit rally are evident in multiple material swings along the way. Executing on distressed exchanges has generated its share of headlines (e.g. Carvana) but much less than would have been seen if inflation had held in longer and even more tightening was needed.
A look at yields…

The HY index and IG index yield histories swung around with the credit cycles but were notably distorted across the ZIRP and QE years after late 2008. The current yield curve backdrop is very distinct now but still is best framed against the pre-ZIRP years.
We regularly make the case that the 9.3% pre-crisis (pre-ZIRP) median for HY and 6.1% in IG make for the most relevant frames of reference. That is backed up by framing median spreads vs. current spreads and index yield benchmarks.
Current yields for HY of 7.31% and 5.18% for IG reflect the low UST levels relative to past cycles as well as historically tight spreads (even it not as close to the all-time lows). Median spreads would put all-in yields in HY closer to pre-crisis medians, so that is a frame of reference for historical context.
For example, the long-term median for HY OAS is +165 bps above the current HY OAS of +297 bps. For the sake of simplicity, if we add +165 bps to the HY Index we get to just under the 9% line. In other words, we are in the zone with the lower UST being the swing factor.
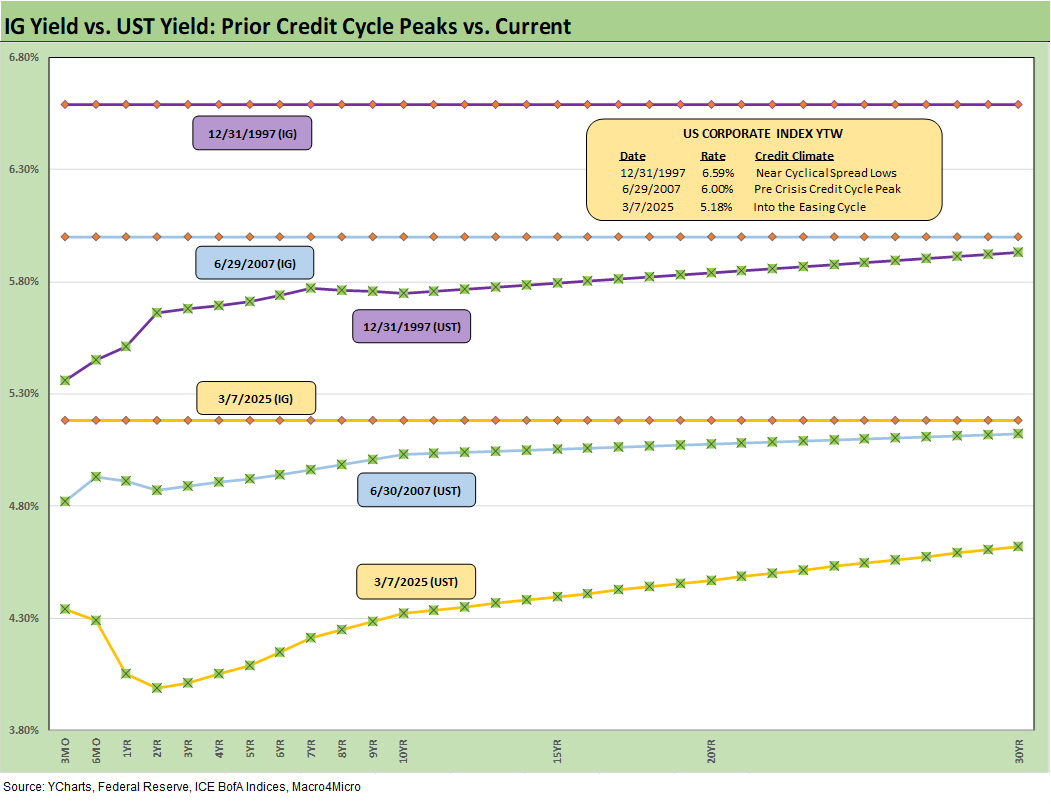
The above chart frames IG index yields and the related UST curve for the Friday close. We include two useful comps from prior credit cycle peaks in June 2007 and Dec 1997 for some credit cycle peak context. Those periods in 1997 and 2007 reflect market backdrops when credit markets were hot, risk appetites high, and spreads were down near multiyear lows.
For IG yields, the relative yield story is heavily dictated by the UST curve differentials with spreads tight in all three markets. For those who believe the post-crisis ZIRP was an anomaly, the current UST curve is exceptionally low in historical context (see Footnotes & Flashbacks: State of Yields 3-9-25).
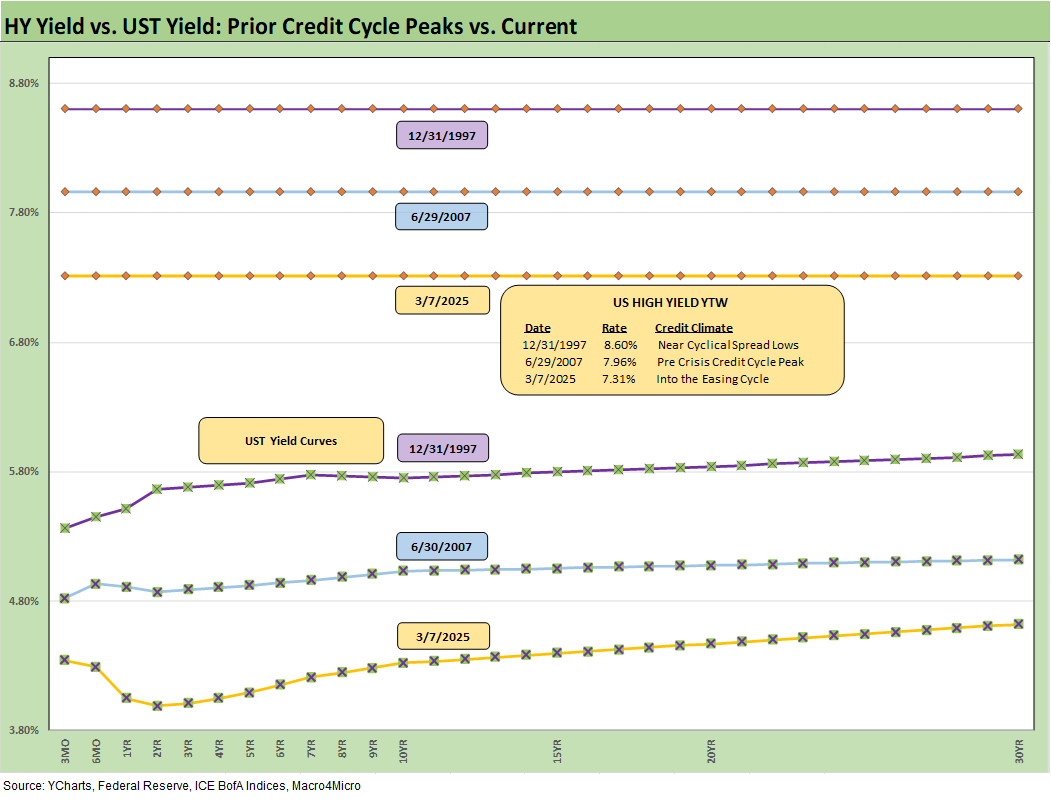
The above chart does the same drill as the prior chart but for HY index yields. The low UST curve vs. history and extremely tight spreads put the current HY index yield below the earlier peak credit cycles. The volatility of 1998 and the experience of late 2007 on the way into the 2008 crisis period offers a reminder that risk repricing can come on with a vengeance. That was true in earlier cycles as well (1990 as securities firms started to collapse).
The summer of 2007 was the start of major problems in the credit markets, but the equity markets kept on rallying into Oct 2007. Later in the turmoil and well after the fact, the start of the recession was tagged as Dec 2007 (see Business Cycles: The Recession Dating Game 10-10-22).
See the Select Histories links below for anyone who wants to revisit good and bad old days.
See also:
Footnotes & Flashbacks: State of Yields 3-9-25
Footnotes & Flashbacks: Asset Returns 3-9-25
Mini Market Lookback: Tariffs Dominate, Geopolitics Agitate 3-8-25
Payrolls Feb 2025: Into the Weeds 3-7-25
Employment Feb 2025: Circling Pattern, Lower Altitude 3-7-25
Tariffs: Enemies List 3-6-25
Gut Checking Trump GDP Record 3-5-25
Trump's “Greatest Economy in History”: Not Even Close 3-5-25
Asset Returns and UST Update: Pain Matters 3-5-25
Happy War on Allies Day 3-4-25
Footnotes & Flashbacks: Credit Markets 3-3-25
Footnotes & Flashbacks: Asset Returns 3-2-25
Footnotes & Flashbacks: State of Yields 3-2-25
Mini Market Lookback: Collision Courses ‘R’ Us 3-2-25
PCE Jan 2025: Prices in Check, Income and Outlays Diverge 2-28-25
Durable Goods Jan25: Waiting Game 2-27-25
GDP 4Q24 Second Estimate: PCE Inflation the Main Event 2-27-25
New Homes Sales Jan 2024: Homebuilders Feeling Cyclical Signals? 2-26-25
Existing Home Sales Jan 2025: Prices High, Volumes Soft, Inventory Up 2-21-25
AutoNation: Retail Resilient, Captive Finance Growth 2-21-25
Toll Brothers 1Q25: Performing with a Net 2-20-25
Housing Starts Jan 2025: Getting Eerie Out There 2-19-25
Herc Rentals: Swinging a Big Bat 2-18-25
UST Yields: Sept 2024 UST in Historical Context 2-17-25
Tariff links:
Auto Tariffs: Japan, South Korea, and Germany Exposure 2-25-25
Mini Market Lookback: Tariffs + Geopolitics + Human Nature = Risk 2-22-25
Reciprocal Tariffs: Weird Science 2-14-25
US-EU Trade: The Final Import/Export Mix 2024 2-11-25
Aluminum and Steel Tariffs: The Target is Canada 2-10-25
US-Mexico Trade: Import/Export Mix for 2024 2-10-25
Trade Exposure: US-Canada Import/Export Mix 2024 2-7-25
US Trade with the World: Import and Export Mix 2-6-25
The Trade Picture: Facts to Respect, Topics to Ponder 2-6-25
Tariffs: Questions to Ponder, Part 1 2-2-25
US-Canada: Tariffs Now More than a Negotiating Tactic 1-9-25
Trade: Oct 2024 Flows, Tariff Countdown 12-5-24
Mexico: Tariffs as the Economic Alamo 11-26-24
Tariff: Target Updates – Canada 11-26-24
Tariffs: The EU Meets the New World…Again…Maybe 10-29-24
Trump, Trade, and Tariffs: Northern Exposure, Canada Risk 10-25-24
Trump at Economic Club of Chicago: Thoughts on Autos 10-17-24
Facts Matter: China Syndrome on Trade 9-10-24
Select Histories:
Annual and Monthly Asset Return Quilt 2024 Final Score 1-02-25
Spread Walk 2024 Final Score 1-2-25
HY and IG Returns since 1997: Four Bubbles and Too Many Funerals 12-31-24
HY OAS Lows Memory Lane: 2024, 2007, and 1997 10-8-24
The B vs. CCC Battle: Tough Neighborhood, Rough Players 7-7-24
HY Spreads: Celebrating Tumultuous Times at a Credit Peak 6-13-24
Credit Markets Across the Decades 4-8-24
Credit Cycles: Historical Lightning Round 4-8-24
Histories: Asset Return Journey from 2016 to 2023 1-21-24
HY Multicycle Spreads, Excess Returns, Total Returns 12-15-23
HY Credit Spreads: Migration, Medians, and Misdirection 11-6-23
Credit Spreads: Proportions Matter in Risk Compensation 8-14-23
Fed Funds vs. Credit Spreads and Yields Across the Cycles 6-19-23
Wild Transition Year: The Chaos of 2007 11-1-22
Greenspan’s Last Hurrah: His Wild Finish Before the Crisis 10-30-22