
Footnotes & Flashbacks: Asset Returns 3-9-25
We look back at a tough week all around for equities and duration with a mild spread widening in HY.


The Battle of Little Big Tariff: Overconfidence has a mixed history
Equities took a beating this past week from small caps to large caps while duration took a modest hit on a fresh steepening move. Tariff spikes are finally being seen as more of a reality than a tactic and the partisan hope that it is only a “negotiating tactic” is fading.
The pricing of risk naturally gets tricky when the “creators” of the risk keep changing the underlying assumptions and timing. Tariffs are the key drivers of near-term fundamental risk across industries, the consumer sector (notably in sentiment metrics and inflation expectations), fixed investment (capital budgeting plans and supplier chain risk), and yield curve risk (stagflation debates picking up).
The securities markets can react immediately, but Trump forgets that companies need to plan inventories, frame capital budgets and capex priorities, place orders, and enter into contracts. Putting such activities on hold will flow into the economy as more “pause buttons” get pushed and underlying assumptions get a makeover in top line and earnings estimates.
For now, Trump is enjoying the flexing exercise and psychic rewards he gains by beating on allies, but companies need more certainty. Otherwise, they will behave like they did when the market was pounded in 2018, and we saw exports and capex suffer in 2019 which in turn drove the Fed to ease.
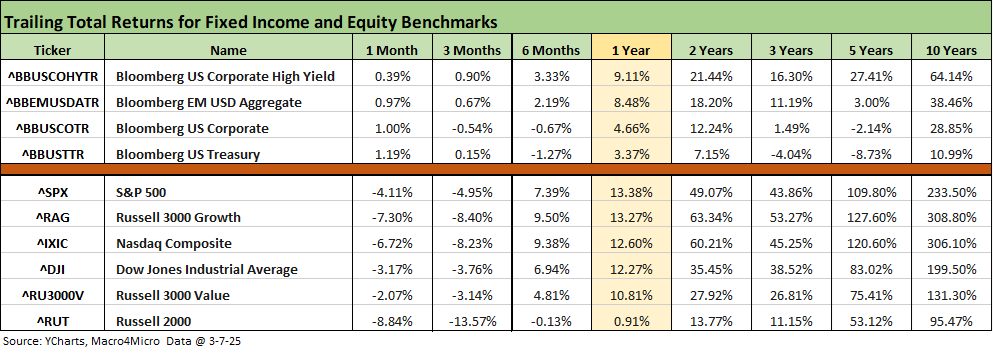
The above table updates the high-level debt and equity benchmarks we track each week. We see the debt benchmarks all positive for the trailing 1-month period but more “mixed and minimal” looking back over 3 months with IG Corporates negative and UST barely positive.
Equities have been all negative and very sloppy over the 1-month and trailing 3-months periods. Russell 2000 and NASDAQ and growth stocks have been hit hard for the 1-month and 3-months periods. The recent timeline returns of the US-centric small caps are certainly not signaling confidence in the efficacy of the Tariffs ‘R’ US game plan. The -13% handle returns since Dec 2024 on Russell 2000 offer a bad signal for growth and earnings expectations in the post-election period.
The rolling return visual
In the next section, we get into the details of the 32 ETFs and benchmarks for a mix of the trailing periods. Below we offer a condensed 4-chart view for an easy visual on how the mix of positive vs. negative returns shape up. This is a useful exercise we do each week looking for signals across industry groups and asset classes.
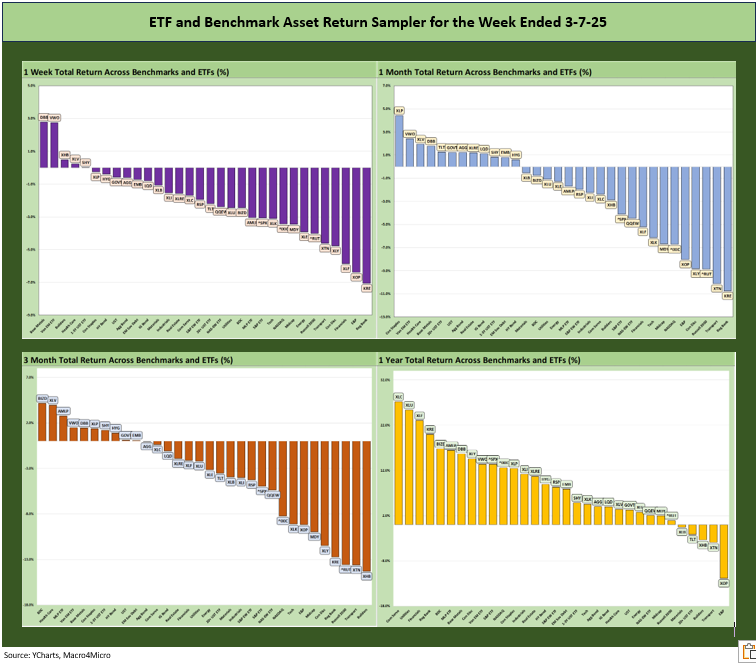
The symmetry is moving the wrong way in the above snapshot of the time horizon returns. We see 5-27 for 1 week, 12-20 for 1 month, 10-22 for 3 months, and we even see some erosion over LTM with negative LTM returns up to 5 from 2 last week and 1 in the prior week. The LTM was 32-0 in mid-Feb.
The Magnificent 7 heavy ETFs…
Some of the benchmarks and industry ETFs we include have issuer concentration elements that leave them wagged by a few names. When looking across some of the bellwether industry and subsector ETFs in the rankings, it is good to keep in mind which narrow ETFs (vs. broad market benchmarks) get wagged more by the “Magnificent 7” including Consumer Discretionary (XLY) with Amazon and Tesla, Tech (XLK) with Microsoft, Apple, and NVIDIA, and Communications Services (XLC) with Alphabet and Meta.
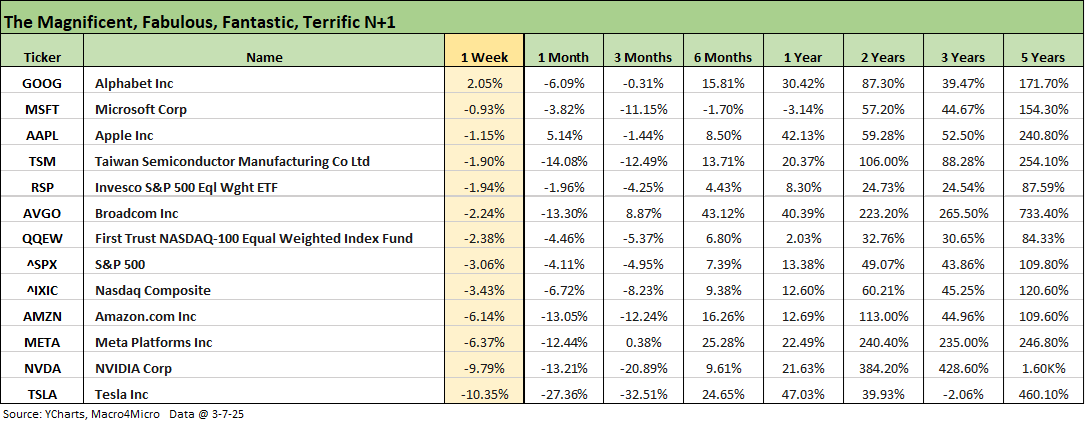
We looked at the tech bellwethers in the Mini Market Lookback: Tariffs Dominate, Geopolitics Agitate (3-8-25), and the trend is no mystery with returns overwhelmingly negative for the week at 1 positive (Alphabet), 1 positive over the 1-month period (Apple) and 2 positive over 3-months (Broadcom, Meta).
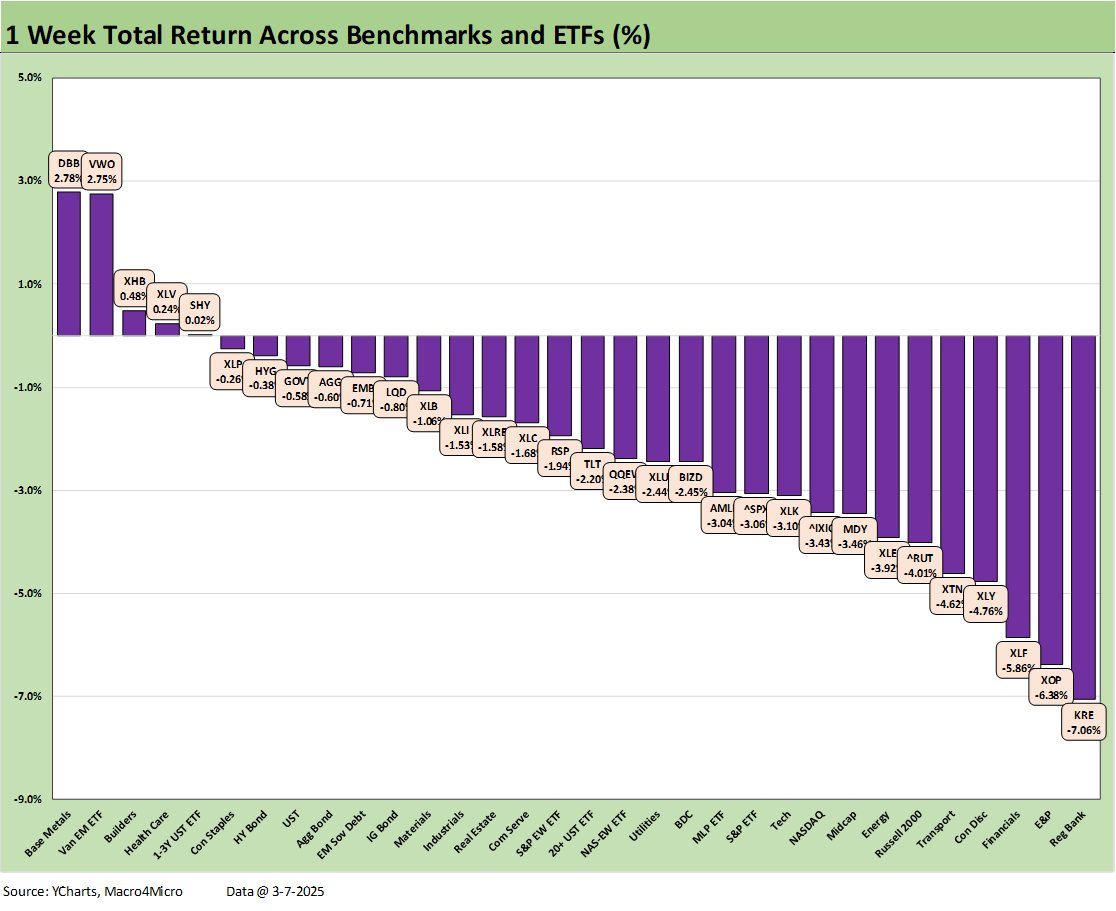
The 1-week return mix did not hold much mystery at a score of 5-27 as already detailed (see Mini Market Lookback: Tariffs Dominate, Geopolitics Agitate 3-8-25). This week showed Financials (XLF) and Regional Banks (KRE) taking a hit. The E&P ETF (XOP) is easily explained by oil prices tanking and more weakness expected. The cyclical anxiety is reflected in the bottom quartile with Transports (XTN) and Russell 2000 (RUT) and Midcaps (MDY).
The real noise will begin with guidance in 1Q25 earnings season when we get some clarity (or more delays and sleights of hand) in April when tariffs are actually semi-finalized. The fact that Trump can change them at any time he wants through readily available legal “excuses.”
We also might have some sense by April and May on the alchemy of what constitutes “reciprocal tariffs” given how those get framed with the array of more subjective inputs and non-tariff practices of the trade partner (see Reciprocal Tariffs: Weird Science 2-14-25). We will see creative challenges to areas like VAT taxes that hit all products, so reciprocal tariffs will be a nightmare spearheaded by a leader who still claims (as recently as this past week in writing) that the “seller pays.”
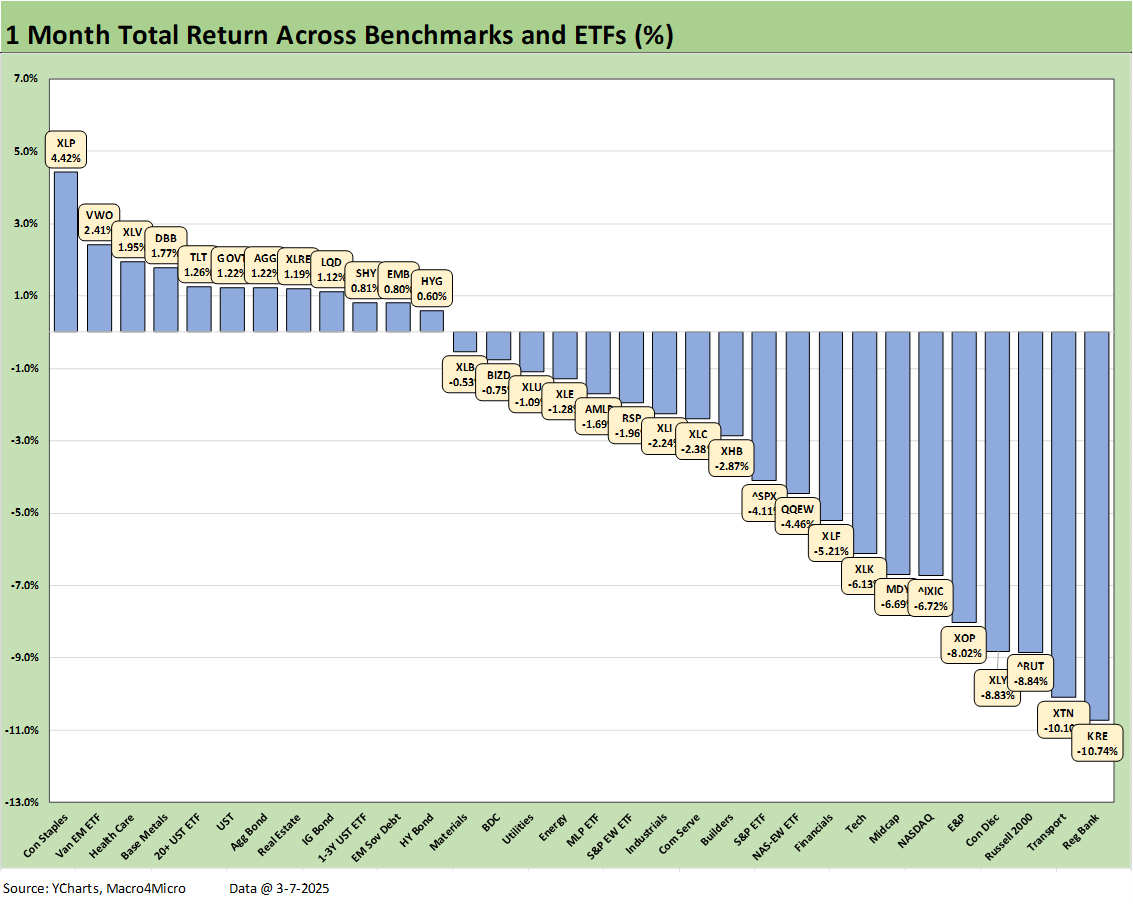
The 1-month period weighed in at 12-20 with the bottom performer being the Regional Bank ETF (KRE) at -10.7%, a full 15 points behind the #1 performer, which is the defensive Consumer Staples ETF (XLP) at +4.4%.
The bottom quartile shows a range of broad benchmarks including Russell 2000, NASDAQ, and Midcaps with the S&P in the lower half of the third quartile. The median asset performances for the 1-month and 3-months periods were negative.
The bond ETFs were all in positive range, which means that only 5 of the ETFs (XLP, VWO, XLV, DBB, and XLRE) from the equity side were positive with 2 of those (VWO, DBB) more tied into China story lines. We need to put an asterisk on DBB as more of a commodity ETF than an equity or bond ETF even if it also hold liquid UST and agencies as it shifts allocations.
As noted, the defensive Consumer Staples ETF (XLP) ranked #1 with Health Care (XLV) in the top quartile and Real Estate (XLRE) and its income stock heavy mix (REITs) making the bottom of the top quartile.
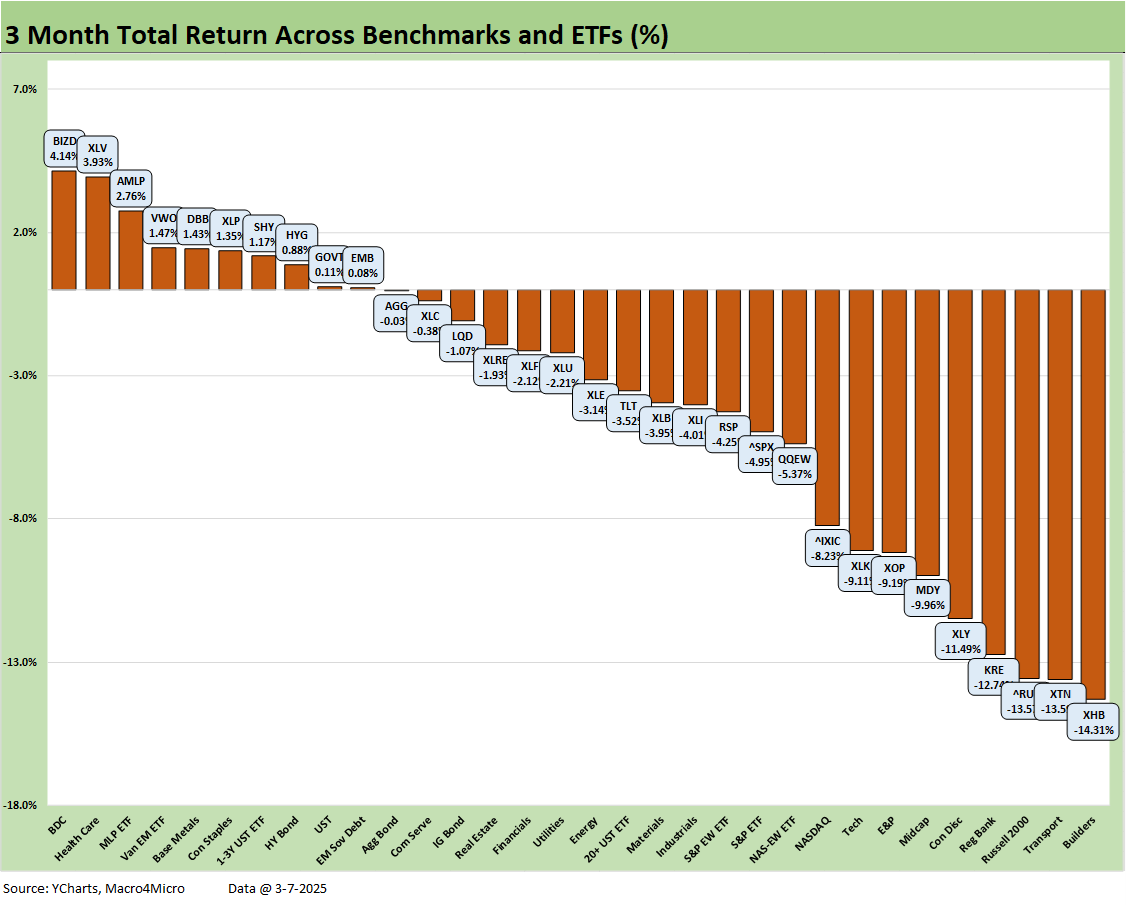
The 3-month returns include part of a weak Dec 2024 to wrap the year (see Footnotes & Flashbacks: Asset Returns for 2024 1-2-25). The score of 10-22 does not offer bragging rights with the starting point of the measurement period coming a few weeks after the Trump trade rallies. The bottom quartile features Small Caps and Midcaps with the lower half of the third quartile including NASDAQ and the S&P 500.
The recent tariff noise roiling markets has undermined broad benchmarks while leaving room for industry level outperformance (see Asset Returns and UST Update: Pain Matters 3-5-25). The Homebuilder ETF (XHB) is sitting on the bottom of the rankings with Transports (XTN), Russell 2000 (RUT), Regional Banks (KRE), and Consumer Discretionary (XLY) sitting in the bottom 5.
Consumer Discretionary (XLY) comes with the asterisk of a high issuer weighting of Tesla in the mix. The “Musk brand” is doing well with the US extreme right wing, Hungary, Russia, and the AfG in Germany, but there are some questions on whether that is the main target market for EVs. In addition, there are other EVs available for the environmentally oriented buyer. As detailed in the earlier tech bellwether table, TLSA’s running 3-month return is now -32.5% as he dropped his chainsaw on the TSLA stock price.
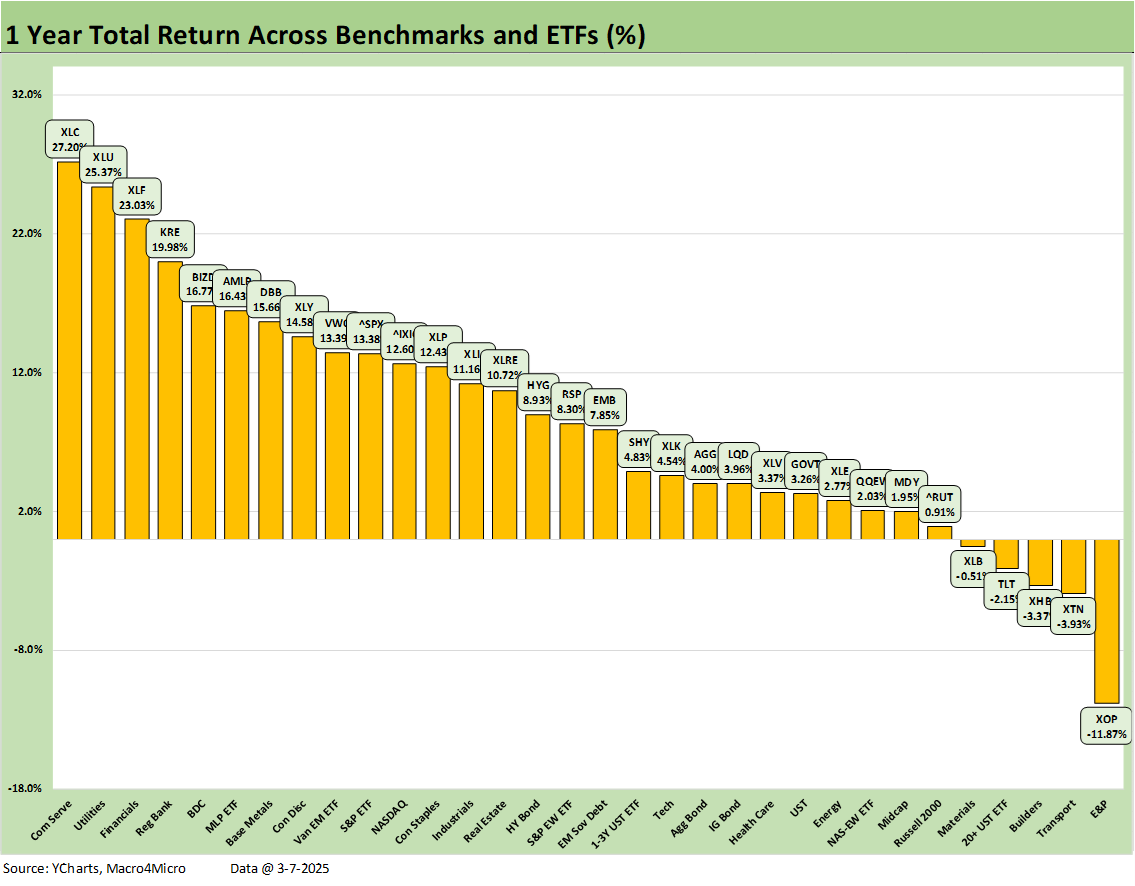
The trailing 1-year return picture is still impressive after two banner years (under Biden) for the S&P 500 not seen since the late 1990s. However, recent periods are starting to catch up on the low end after the mix of benchmarks and ETFs stood at 32-0 all positive vs. negative in mid-Feb 2025.
We see the latest 5-27score at the most recent close with the volatile E&P ETF (XOP) in double-digit negative range. We see some variety on the low end in negative range with E&P (XOP), Transports (XTN), Homebuilders (XHB), long duration UST (TLT) and Materials (XLB). Other line items in the bottom quartile include the Russell 2000 (RUT) and Midcaps (MDY) and the Equal Weight NASDAQ 100 (QQEW).
See also:
Mini Market Lookback: Tariffs Dominate, Geopolitics Agitate 3-8-25
Payrolls Feb 2025: Into the Weeds 3-7-25
Employment Feb 2025: Circling Pattern, Lower Altitude 3-7-25
Tariffs: Enemies List 3-6-25
Gut Checking Trump GDP Record 3-5-25
Trump's “Greatest Economy in History”: Not Even Close 3-5-25
Asset Returns and UST Update: Pain Matters 3-5-25
Happy War on Allies Day 3-4-25
Footnotes & Flashbacks: Credit Markets 3-3-25
Footnotes & Flashbacks: Asset Returns 3-2-25
Footnotes & Flashbacks: State of Yields 3-2-25
Mini Market Lookback: Collision Courses ‘R’ Us 3-2-25
PCE Jan 2025: Prices in Check, Income and Outlays Diverge 2-28-25
Durable Goods Jan25: Waiting Game 2-27-25
GDP 4Q24 Second Estimate: PCE Inflation the Main Event 2-27-25
New Homes Sales Jan 2024: Homebuilders Feeling Cyclical Signals? 2-26-25
Existing Home Sales Jan 2025: Prices High, Volumes Soft, Inventory Up 2-21-25
AutoNation: Retail Resilient, Captive Finance Growth 2-21-25
Toll Brothers 1Q25: Performing with a Net 2-20-25
Housing Starts Jan 2025: Getting Eerie Out There 2-19-25
Herc Rentals: Swinging a Big Bat 2-18-25
UST Yields: Sept 2024 UST in Historical Context 2-17-25
Tariff links:
Auto Tariffs: Japan, South Korea, and Germany Exposure 2-25-25
Mini Market Lookback: Tariffs + Geopolitics + Human Nature = Risk 2-22-25
Reciprocal Tariffs: Weird Science 2-14-25
US-EU Trade: The Final Import/Export Mix 2024 2-11-25
Aluminum and Steel Tariffs: The Target is Canada 2-10-25
US-Mexico Trade: Import/Export Mix for 2024 2-10-25
Trade Exposure: US-Canada Import/Export Mix 2024 2-7-25
US Trade with the World: Import and Export Mix 2-6-25
The Trade Picture: Facts to Respect, Topics to Ponder 2-6-25
Tariffs: Questions to Ponder, Part 1 2-2-25
US-Canada: Tariffs Now More than a Negotiating Tactic 1-9-25
Trade: Oct 2024 Flows, Tariff Countdown 12-5-24
Mexico: Tariffs as the Economic Alamo 11-26-24
Tariff: Target Updates – Canada 11-26-24
Tariffs: The EU Meets the New World…Again…Maybe 10-29-24
Trump, Trade, and Tariffs: Northern Exposure, Canada Risk 10-25-24
Trump at Economic Club of Chicago: Thoughts on Autos 10-17-24