
PCE Jan 2025: Prices in Check, Income and Outlays Diverge
Jan PCE release shows inflation in line, DPI soars for some bulls, but consumer bears can look at lower outlays for support.


Cheer up Eeyore, look at that personal income…
The PCE price index was in line with market expectations but still at levels that are a material distance from the 2.0% YoY goal as Jan 2025 posted +2.5% for headline PCE and 2.6% Core. The Goods price index inflated by +0.6% YoY, which was up from prior months of deflation. Durables was still deflating but Nondurables was at +1.6 MoM. Services stayed at a 3% handle of +3.4%, which was down from +3.9% in Dec 2024 with the next lowest month since the summer at +3.7% in Sept and July. That at least was a better trend for Services even if still high.
The outliers in the release included the major MoM jump in Personal Income at +0.9% in current dollars set against -0.2% in Personal Consumption Expenditure dollars. Real PCE was down by -0.5% in Jan 2025 vs. +0.5% for Dec 2024. The question on the consumer sector fading will get more airtime with these line items in light of other recent indicators.
The income vs. outlays divergence sent savings rates soaring to 4.6% for the highest saving rates since June 2024 (4.8%). The question will be whether that high savings rate reflects a defensive consumer and that such an impulse might stick around for a while. That comes after Walmart headlines, weaker color from the homebuilders, consumer sentiment and confidence setbacks, and higher inflation expectations.
We head into March with tariffs escalating at the 10,000 foot level but soon will be plunging into the trenches during March and April. We have one section 232 review potentially dragging on for some new threats such as copper, which will likely join steel and aluminum in material cost pressures for domestic buyers.
Tariffs remain a wildcard embedded in disinformation central…
The tariffs are being rolled out on a larger scale and at a multiple of what we saw back in 2018-2019. The USMCA will essentially be dead in substance (will any party make it official?), and the WTO will be even more of a fading hologram as this all plays out.
We have a hard time seeing the consumer feeling better when the word “Medicaid” and “cuts” so frequently show up in the headlines after the House bill. You can look for the Medicaid line item in Table 1 of the PCE report under personal income and transfer receipts. The Medicaid line was $988 billion.
Meanwhile, the overhaul of Social Security was all over the headlines and anyone on any Social Security program was blitzed with emails highlighting the mass layoffs kicking into gear. When people have Medicare signups or issues, the ability to get service will make a Stalin era soup line look like a Disney ride (It’s a mean world after all…).
Trump’s desire to control the news cycle just keeps on bringing more tariff threats at more than 1 a week with a few recurring head fakes on when the tariffs will start to keep life interesting. We saw more tariffs on China, the EU, and copper this week following the earlier references to Autos, Pharma, and Semis (see Mini Market Lookback: Tariffs + Geopolitics + Human Nature = Risk 2-22-25). We are still waiting for some intrepid soul who is allowed in the room to ask Trump “Does the buyer pay? Yes or No?” Anyone that asked with a loud voice would likely join the Associated Press in banishment.
Overall, the half-empty view is that the outlays decline in Jan 2025 fits in with the broader question marks around the consumer. It also fits in with the theories around household anxiety tied to the fallout from tariffs and various other actions not in the usual economic models (deportation, mass Federal level payroll purges, the shutdown on a wide range of Federal disbursements with the related multiplier effects).
Some questions to ponder from the Jan 2025 PCE report…
Is the absence of negative surprises in the PCE price index and consensus report enough to leave status quo and wait for the final tariff plots to unfold?
Is the reality of 2% handles on headline PCE and Core PCE index good enough since the long-term history shows PCE price inflation only gets to 2.0% when the backdrop is uglier (oil market crash or recession) or on the other side of a crisis (post-2008)?
Will the market look past the current softening indicators and just sit and wait for the final tariff score? If so, what does that mean for more soft PCE and the type of corporate sector retrenchment we saw in industry pockets in 2018-2019?
Does the spike in the savings rate and contraction in consumption dovetail with what we are hearing from Walmart or the homebuilding sector? Or should we take the strong exit from 2024 for auto sales as more reassuring on soft landing comfort?
Is the chaos of DOGE, mass deportation, and the unprecedented level of tariffs enough to scare any business and/or any household and encourage defensiveness as they wait for multiplier effects to unfold?
Is the exorbitant array of tariffs in place and soon-to-be-in-place across all of the US major trading partners simply too big to ignore? Is the retaliation risk from those partners and potential for a multifront, multi-ocean trade clash too much of a risk?
Will today’s fiasco in the White House with Ukraine make tensions with the EU in trade and geopolitics that much worse? Will that stiffen resolve in retaliation since Trump might panic on inflation risk?

The above chart updates the Fed Funds rate vs. Core PCE for somewhat of a proxy on “real fed funds” and how that flows into a timeline of relative tightening. We think back to the fall of 2022 when many were screaming “PAUSE!” at a time when negative real fed funds in fact was still more like accommodation in economic substance. The long-term differential of +1.4% noted above is below the January level of +1.7%. That leaves some room but not a lot.
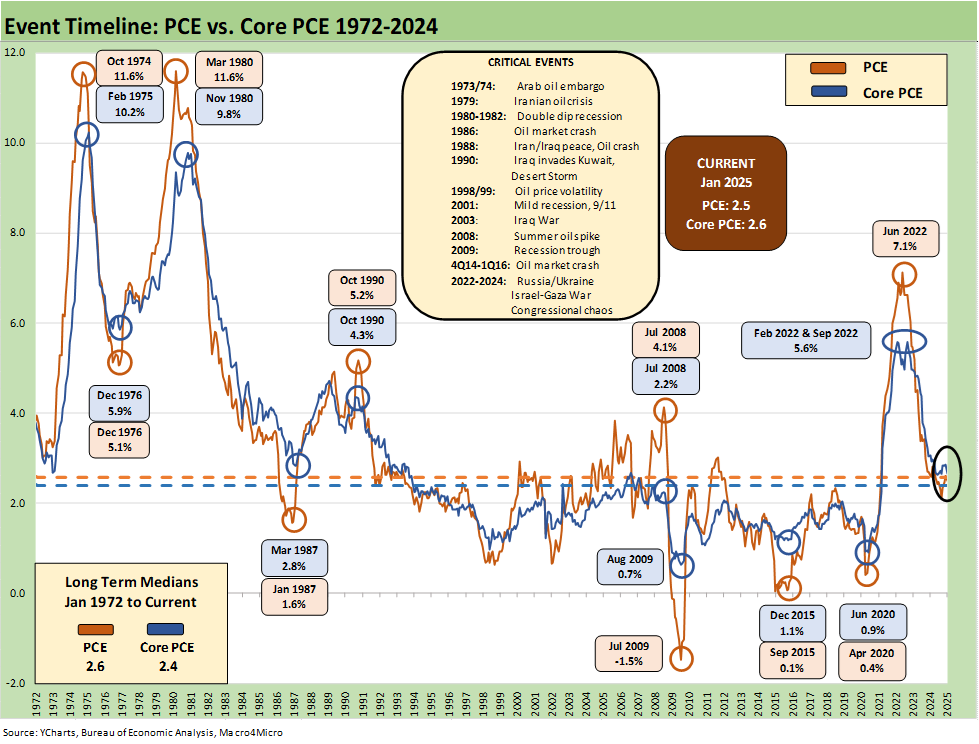
The above chart updates the long-term time series for PCE vs. Core PCE across the decades and cycles. We include a box of events to jog memories for the older crowd and a historical checklist for the new folks on the block. The 1973 to 1975 period was a turbulent one for domestic politics and geopolitics (Israeli war, Arab Oil embargo, the fall of Saigon, etc.) while 1979 offers some intense history in the Middle East also (Iran, fall of Shah). The1980 to 1982 double dip recession saw the peak inflation fighting of the Volcker years.

The above chart frames the long-term differential history between PCE and Core PCE. The long-term differential is zero and we currently stand at a -0.1. The volatility around that compressed long-term median flows into the energy wildcard with some food distortions also back in the 1970s. We look at some of the CPI energy and food inflation moves in separate commentaries (see Inflation: The Grocery Price Thing vs. Energy 12-16-24, Inflation Timelines: Cyclical Histories, Key CPI Buckets11-20-23).

The above chart looks at a shorter timeline from 1997 to offer some better visual scale separate from the wild 1970s and 1980s. We see the deflation at the post-crisis recession trough in mid-2009. We see the collapse in oil prices in late 2015 and then the COVID impact in 2020.
The 1997 to Jan 2025 period also shows a rare period at sub-2.0% PCE and Core PCE. It took a lot to go wrong including oil crashes and a financial systemic crisis to get us there.

The above chart covers the time horizon for DPI vs. PCE from early 2022 as the tightening cycle kicked into gear after March 2022. Life in Jan 2022 was still quiet for Disposable Personal Income, and we see Consumption still running ahead of DPI coming off bullish macro headlines in 2021. The 2021 period was a big macro rebound in GDP off the COVID peak period.
Oil was a problem after the Putin invasion of Ukraine in late Feb 2022, and inflation hit a high in June 2022 at +9.1% for CPI as a headline grabber (headline PCE at +7.1% in June 2022) before the steady inflation slide to current rates. The Core PCE has dueling peaks at +5.6% for Feb 2022 and Sept 2022.

The above chart plots MoM Disposable Personal Income vs. PCE as a read on how wild things got during and right after the pandemic peak. These comments are somewhat of a replay each month with some edits and updates. This is a chart we use each month to revisit the DPI swings that came with the three COVID relief/stimulus packages. That included two under Trump and one under Biden. The most recent month (Jan 2025) shows a relatively material disconnect between DPI and PCE.
As a reminder, Trump signed the CARES Act in March 2020 (shows up in the DPI in April 2020) and Trump also signed the Dec 2020 legislation disbursed in Jan 2021 (he seldom mentioned that one since it was easier to blame Biden and Powell). Biden signed the America Rescue Plan (disbursed in March 2021) that was somewhat of a demand pile-on in a supply constrained environment (thus inflation). The DPI and PCE wave tied to each of those shows up in the chart above.
The vaccine was announced in early Nov 2020 just ahead of two stimulus actions. That was soon to be a factor in PCE patterns and lag effects. The quarterly numbers in 2021 on the post-COVID bounce were numbers generally not seen since the Reagan and Clinton years (see Presidential GDP Dance Off: Clinton vs. Trump 7-27-24, Presidential GDP Dance Off: Reagan vs. Trump 7-27-24).
The typical political game into the 2024 election was to concentrate inflation cause-and-effect on the March 2021 disbursement. The idea is that a single stimulus plan signed by Biden in early 2021 was the cause of all inflation, which is a case of “dumbassery” and the “politically axed.” That Biden plan certainly made things worse from the demand side. The invasion of Ukraine by Russia in Feb 2022 also drove the ensuing spike in inflation to a June 2022 CPI high of 9.1%. That invasion was caused by Putin, who is the hero of the current White House.

The above table plots the monthly Disposable Personal Income MoM change numbers vs. the Personal Consumption Expenditure numbers across the years from 2019 through Jan 2025. It is an easy scan across key time periods for a look at turns in DPI (e.g. stimulus payments) or PCE.
One exercise to do from time to time is to look at Table 1 in the monthly “PCE release” for the granular dollar amount on each line. While this month’s personal income pop of +0.9% is good news (see line 32 for the DPI total), the line items can show some volatility. We like to look for gaps between DPI and PCE.
Any reader of Table 1 can simply tick off which lines might come under pressure in coming weeks with DOGE and deportations and budget decisions and how those will flow into the various lines. There are some major lines such as Medicaid that serves a broad array of people on the lower rungs of the economic ladder (including a massive number of seniors and sick children).
That Medicaid topic will be a brawl in the Senate and reconciliation between the House and Senate bills. The lovely House extremists with their deep cuts in Medicaid sent their bill to the Senate. The changes will make a difference on DPI and for PCE for the households that get crushed by medical needs and nursing home expenses where they no longer can get coverage.

The above chart takes the Personal Savings line from Table 1 in the PCE release after framing income vs. outlays. The 4.6% savings rate is the highest since 4.8% in June 2024. We have looked at the savings rate dynamics in earlier commentaries (see Savings Rates: Context Across the Cycles 10-27-23). Savings rates peak in times of worry (occasionally panic) as evident on the chart above. The period leading into May 1975 was no picnic while Nov 1981 and Dec 1992 had a raft of issues.
Sometimes there are anomalies during expansions such as in 1987 when the oil patch had basically crashed starting in 1986. Regional stress was high and banks and thrifts were failing. People had to draw down savings or they saved to weather the storm. COVID and the various stimulus actions had a distorting effect on the numbers in 2020. The exercise is one of looking at the numbers and seeking out trend lines across the income and outlays disclosure.
The long-term median savings rate is 6.9%, and we remain well inside that level. Adjustments to income at the industry levels or stress in major regions can move multiple lines in what is a derived number. Radical adjustments to transfer payments tied to political tides (like the attack on Medicaid by the House this past week) should be watched. The same for income lines as more get deported.
See also:
Durable Goods Jan25: Waiting Game 2-27-25
GDP 4Q24 Second Estimate: PCE Inflation the Main Event 2-27-25
New Homes Sales Jan 2024: Homebuilders Feeling Cyclical Signals? 2-26-25
Auto Tariffs: Japan, South Korea, and Germany Exposure 2-25-25
Footnotes & Flashbacks: Credit Markets 2-24-25
Footnotes & Flashbacks: State of Yields 2-23-25
Footnotes & Flashbacks: Asset Returns 2-23-25
Mini Market Lookback: Tariffs + Geopolitics + Human Nature = Risk 2-22-25
Existing Home Sales Jan 2025: Prices High, Volumes Soft, Inventory Up 2-21-25
AutoNation: Retail Resilient, Captive Finance Growth 2-21-25
Toll Brothers 1Q25: Performing with a Net 2-20-25
Housing Starts Jan 2025: Getting Eerie Out There 2-19-25
Herc Rentals: Swinging a Big Bat 2-18-25
UST Yields: Sept 2024 UST in Historical Context 2-17-25
Tariff links:
Auto Tariffs: Japan, South Korea, and Germany Exposure 2-25-25
Mini Market Lookback: Tariffs + Geopolitics + Human Nature = Risk 2-22-25
Reciprocal Tariffs: Weird Science 2-14-25
US-EU Trade: The Final Import/Export Mix 2024 2-11-25
Aluminum and Steel Tariffs: The Target is Canada 2-10-25
US-Mexico Trade: Import/Export Mix for 2024 2-10-25
Trade Exposure: US-Canada Import/Export Mix 2024 2-7-25
US Trade with the World: Import and Export Mix 2-6-25
The Trade Picture: Facts to Respect, Topics to Ponder 2-6-25
Tariffs: Questions to Ponder, Part 1 2-2-25
US-Canada: Tariffs Now More than a Negotiating Tactic 1-9-25
Trade: Oct 2024 Flows, Tariff Countdown 12-5-24
Mexico: Tariffs as the Economic Alamo 11-26-24
Tariff: Target Updates – Canada 11-26-24
Tariffs: The EU Meets the New World…Again…Maybe 10-29-24
Trump, Trade, and Tariffs: Northern Exposure, Canada Risk 10-25-24
Trump at Economic Club of Chicago: Thoughts on Autos 10-17-24
Facts Matter: China Syndrome on Trade 9-10-24