
Footnotes & Flashbacks: Credit Markets 7-21-25
We update our rolling credit markets commentary and history summary as cyclical trends and tariff mechanics get spun.


Macro fog up ahead. Just keep paddling.
Spreads grinded modestly tighter with IG tighter by -3 bps and HY -4 bps in a quieter week that saw the heavy launch of the June quarter earnings. The first round of bank earnings echoed a healthier consumer sector signaled from both retail sales and consumer sentiment as initial inflationary tariff expectations started to moderate. Inflation evidence is there in some product categories, but the real test lies ahead.
Inflation data early this week carried mixed messages with a +2.7% headline and +2.9% Core CPI but showing early signs of inflation for line items more exposed to tariff impacts (see CPI June 2025: Slow Flowthrough but Starting 7-15-25). The Aug 1 tariff countdown continues with over 70% of US goods trade subject to 20-50% rates, and major partners Mexico and EU at 30% and Canada at 35%. Though the search for major impacts may be slow, there is plenty of commentary from numerous trade groups – notably in small business and retail – warning of the harm tariffs will cause (and are already causing) that will eventually flow through to the hard data. The question for now is expense harm vs. pricing flowthrough.
Credit market performance in 2H25 is tied to the ability to weather another stretch of risky asset volatility as the fall season comes around. Given such compressed spread levels now (inside the 10th percentile for IG and HY), the risk is skewed towards some widening as the tariff realities flow through to bottom lines. There is also the risk of trade partner retaliation and a fresh tit-for-tat sequence. In addition, the next round of Section 232 tariffs lurk just ahead. The pharma and semis tariffs are the most concerning as covered in other commentaries.
For this week, eyes will be on the influx of 2Q earnings for color on shifting supply chain and pricing strategies and any better guidance around estimated tariff effects. On the economic front, New and Existing Home Sales get another read (after poor Single Family starts last week) followed by Durable Goods on Thursday.
Below we update our rolling weekly credit markets commentary and spread recap. We already addressed a range of moving parts in our earlier posts over the weekend:
Footnotes & Flashbacks: State of Yields 7-20-25
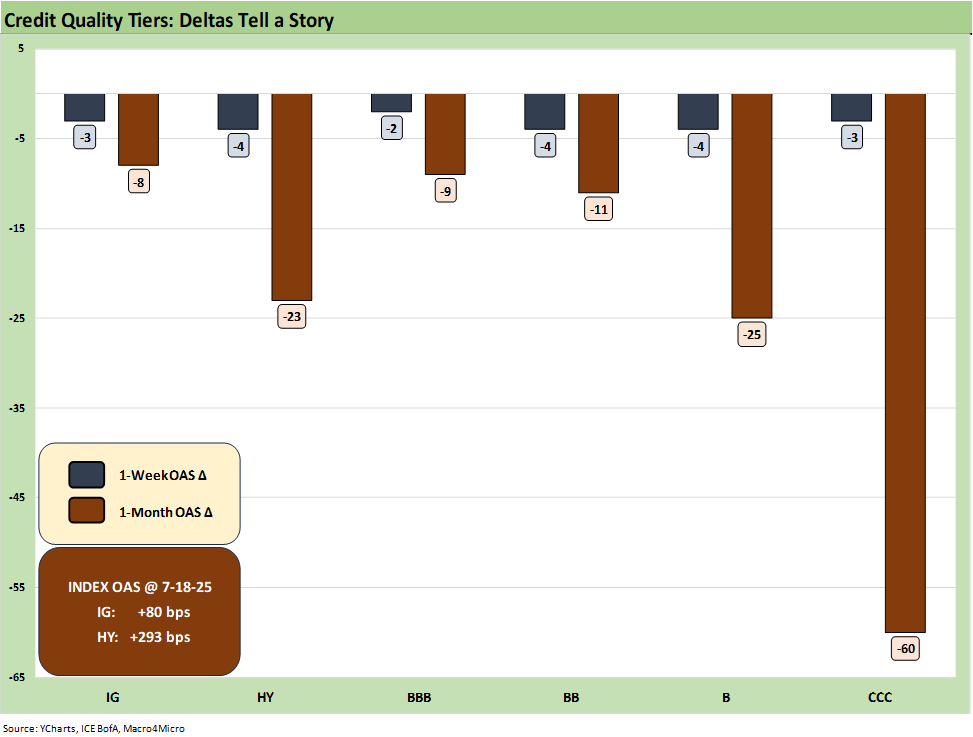
The above chart updates the credit spread deltas for 1-week and 1-month, where spreads resumed a slow tightening trend as HY spreads are hovering below +300 bps near the upper end of the June 2007 range. Spreads this week tightened across the board in fairly uniform fashion with strong relative performance of US IG at -3 bps as the early bank earnings came in strong.
After the multi-month stretch mired in tariff driven volatility, the market is resuming more of a wait-and-see pattern with muted sensitivity to trade headlines. The Aug 1 date is looming but for now the immediate focus will be on the 2Q earnings numbers that are unlikely to show any major shifts just yet. The shift in focus is expected, but working through the on-the-ground implications of tariffs to portfolios will be a continued effort as the year progresses.
We are about to get a fresh read on where the effects of tariffs have worked through earnings reports across expense and revenue lines as corporate planners adjust strategies and adapt to shifting consumer behavior. What forward-looking color is provided in company reports will get “market tested” in pricing strategies at sea level in the later summer and fall as economic releases and pricing data show up at a lag. That is when the tariff impact will rise back up into the inflation debate and Fed policy battles.
To date, tariffs have become politicized and information focus tapered to the needs of the parties debating the topic. We are most disturbed by the lack of focus on the small business sector fallout and how that rolls up to the macro level (see Footnotes & Flashbacks: Asset Returns 7-20-25).
For HY spreads, the rally back to sub +300 level in HY has been a vote of confidence in the balanced credit picture and the better positioning in higher income, shorter duration assets during a period of UST uncertainty. The BB heavy weighting of the HY index has been supportive of returns as noted in the next chart.
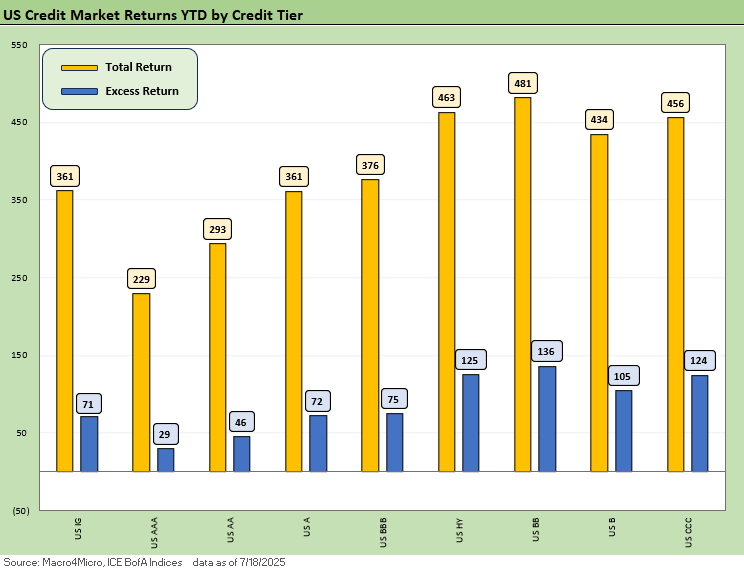
The above chart updates the YTD total return and excess return for IG and HY as well as the credit tiers. Excess returns are not impressive with little upside potential from spread compression, but IG and HY are at least solidly positive at this point. New issues in HY also have the “coupon edge” for income seekers. A 7.1% composite HY YTW tells a favorable story of cash income in new issue flows and refi-and-extension actions. The current composite HY coupon is 6.55%. There is a wide range of coupons in the post-ZIRP world, so new issues in HY hold a lot of allure.
Total returns show the benefits of the modest bull steepener that has supported the short to intermediate UST curve segment (see Footnotes & Flashbacks: State of Yields 7-20-25). That duration angle can support the trade-off along the BBB/BB divide for the now well-established HY Light strategy.
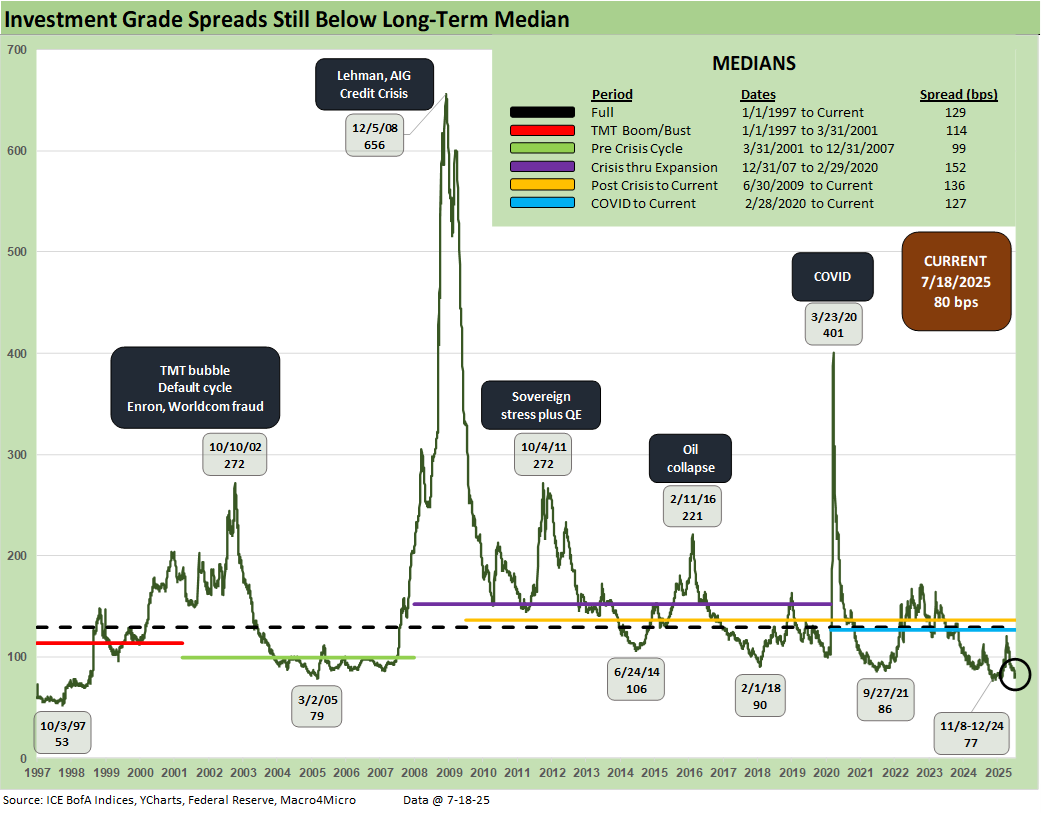
The double-digit IG spreads at +80 bps are back near prior cyclical lows but still just above the 4Q24 lows of +77 bps. The long-term IG OAS median of +129 bps leaves a lot of room but drives home how this market is priced in a rarefied spread range. With a 5.11% yield offered by the IG index, current coupon new issues whether “new money” or refinancing low coupon bonds bring a very solid base of demand after years of ZIRP and normalization coupon levels in portfolios. Income is back in the picture this credit cycle.
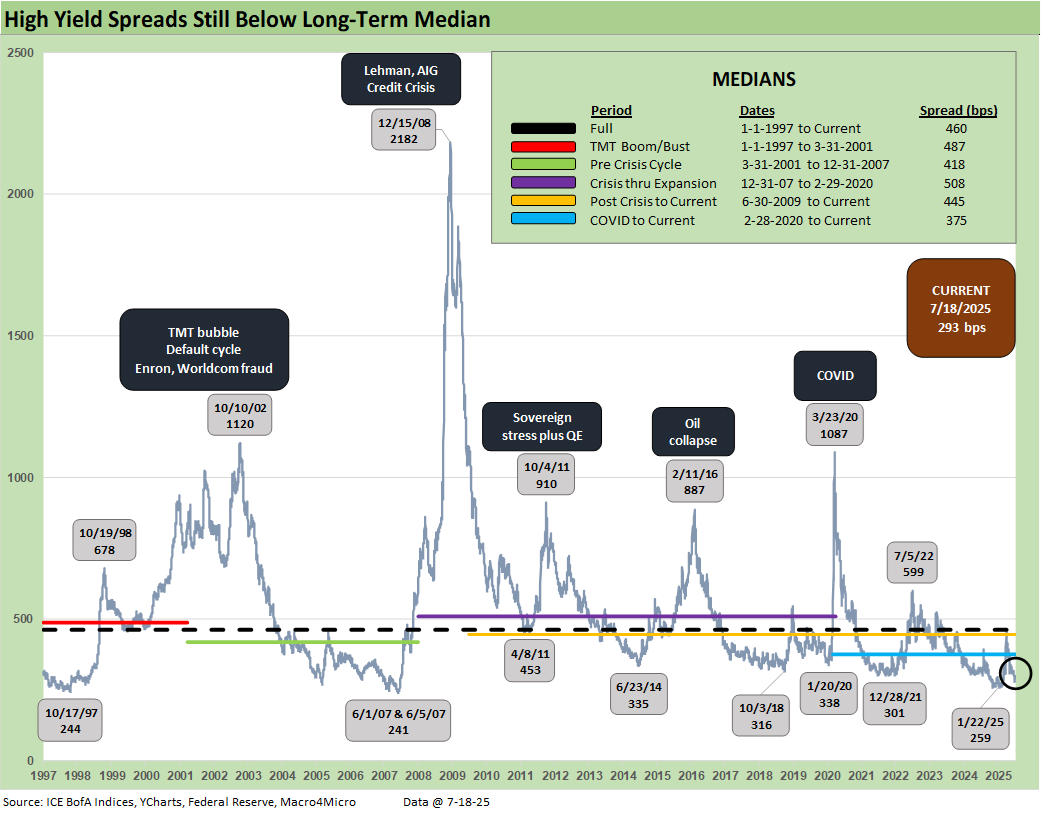
Grinding tighter to +293 bps, the HY OAS is in an increasingly rare territory with a 200-handle that only the June 2007 and recent 1Q25 lows share. These levels are inside the pre-COVID Jan 2020 levels and the prior cyclical lows of Oct 2018 and Jun 2014. The recent 2024 lows of +260 bps and +259 bps in Jan 2025 mean the uber-bulls will stay in the game, but the tariffs are slated to come in force as of Aug 1, and the consumer is slowing down as noted in numerous recent releases. We get the new set of personal income and outlays data late this month with PCE inflation that will test the constructive retail sales numbers from this past week. That presents a delicate balancing act for the FOMC amid stagflation concerns.
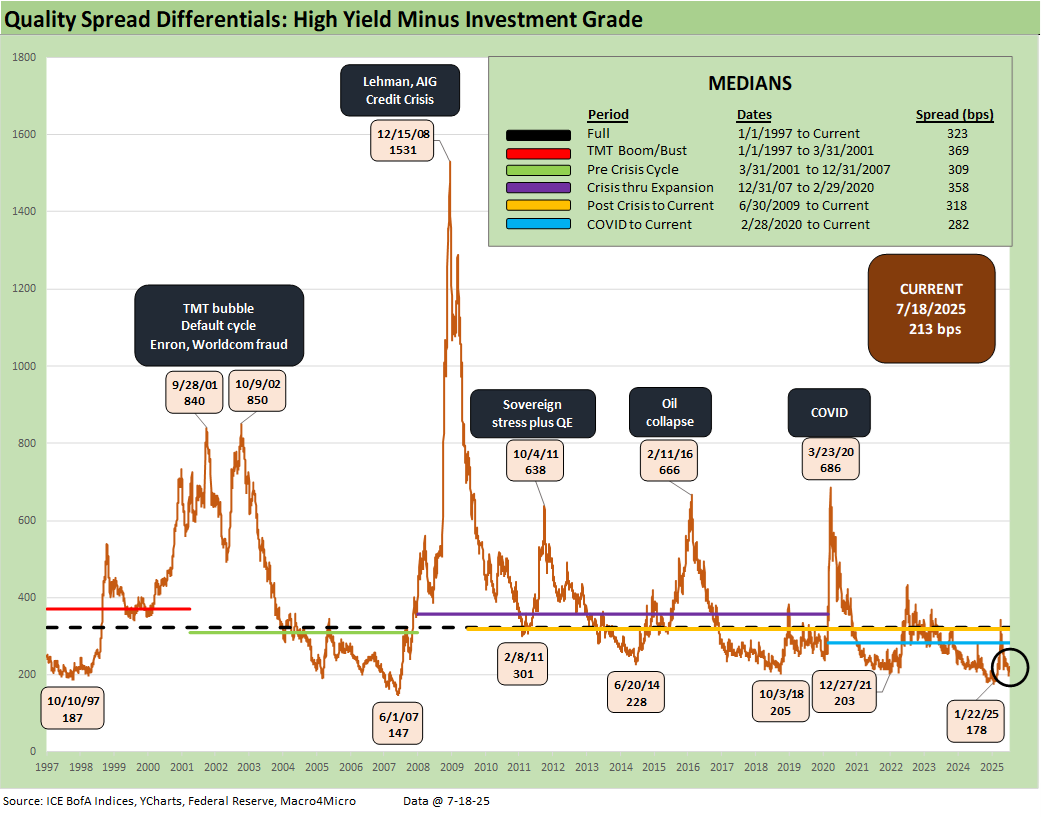
The “HY OAS minus IG OAS” quality spread differential at +213 bps did not move much this week but still is comparable to the Dec 2021 and early Oct 2018 levels. The compressed level still allows little room for setbacks in fundamentals at the macro level and the new aggressive tariff levels are a clear catalyst for some pain if those tariff impacts flow into pricing. Correlation with potential equity volatility is a constant companion for HY as seen in April, but the overall fundamentals are solid in the IG and HY issuer base with earnings signaling still-healthy banks.
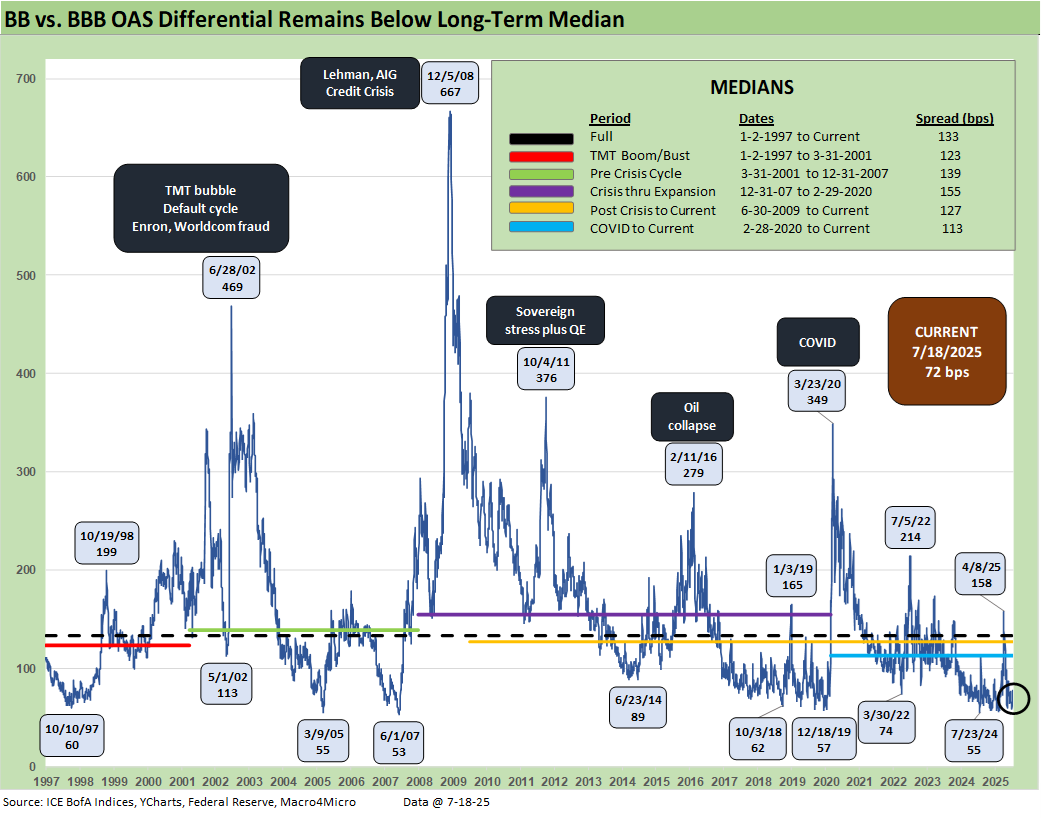
The “BB OAS minus BBB OAS” quality spread differential narrowed -2 bps this week to +72 bps. The BB/BBB divide can swing around as we saw with the spike to +158 bps after Liberation Day. Autos and Energy will be important sectors to watch for potential volatility in those tiers.
The oil price story is always a tricky one for issuers with high commodity exposure with Iranian and Russian supplies no small wildcards. OPEC actions also have been less than friendly to energy bulls in 2025. At just over $67 today (WTI) oil is below the Iran bombing highs but well above the late May $60 level.
For autos, it is very hard to see any good news coming out of the trade policies. We see Stellantis headlines kicking in, and we get GM earnings this week along with some important suppliers for some color (Lear, Allison, Visteon). There is only “degrees of bad” for the OEMs from tariffs and potential catastrophe for some OE suppliers. Dealers and auto retail are the most resilient and the OEMs will need to take action to support their customer strategies.
The Trump tariffs are unwinding global supplier chains it took decades to build. Japan and South Korea just saw 25% tariffs in addition to the existing Section 232 actions that remind us that Trump deals like the “KORUS” deal in 2018 are often fleeting.
There will be much to sort through in the auto sector in 2H25 including the cost impact of high tariffs on steel, aluminum and copper. The Mexico impact on production chains will be an especially important variable for US suppliers and OEM cost structures with GM’s exposure on light vehicle supply a critical factor.
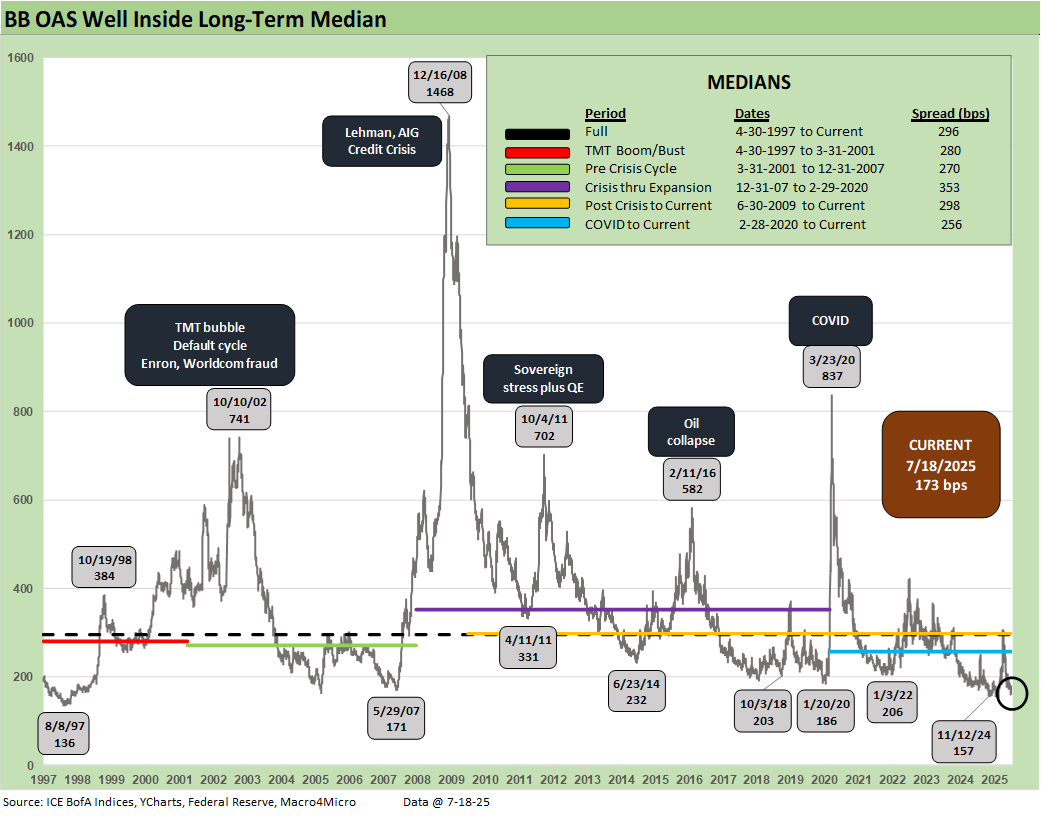
The sub-200 BB tier OAS line is a rare one to cross and we remain there after a -4 bps move this week back to +173 bps. That is not too far above the dazzling +157 bps low of Nov 2024 but still in line with the May 2007 low. Oct 2018 lows of +203 bps is a notable comp for a frame of reference, given the timing of the fresh sell-off in energy into Dec 2018. Though the current levels are vulnerable given the extraordinarily tight pricing, the higher quality index and low default rates leave plenty of room for rationalization of these levels. For longer time horizons, the BB tier has been a great place to be.
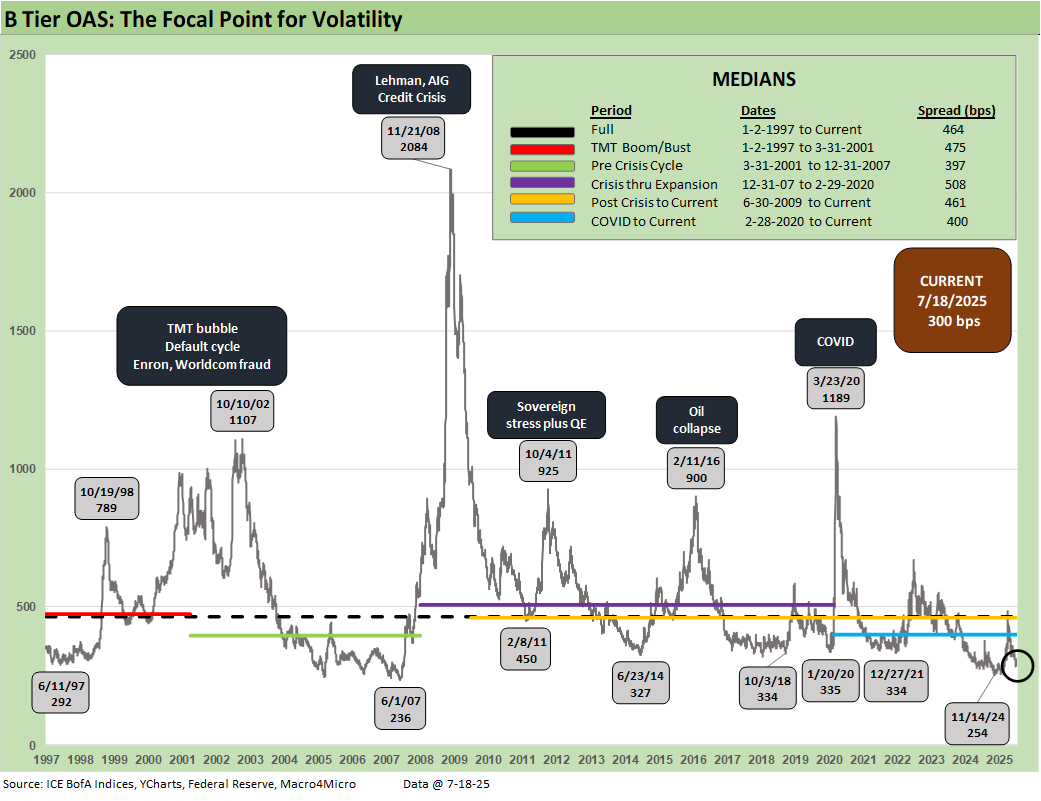
The B tier is the sweet spot of legacy HY fund investors and the current +300 bps is well inside Oct 2018 and June 2014 lows and -164 bps below the long-term median.
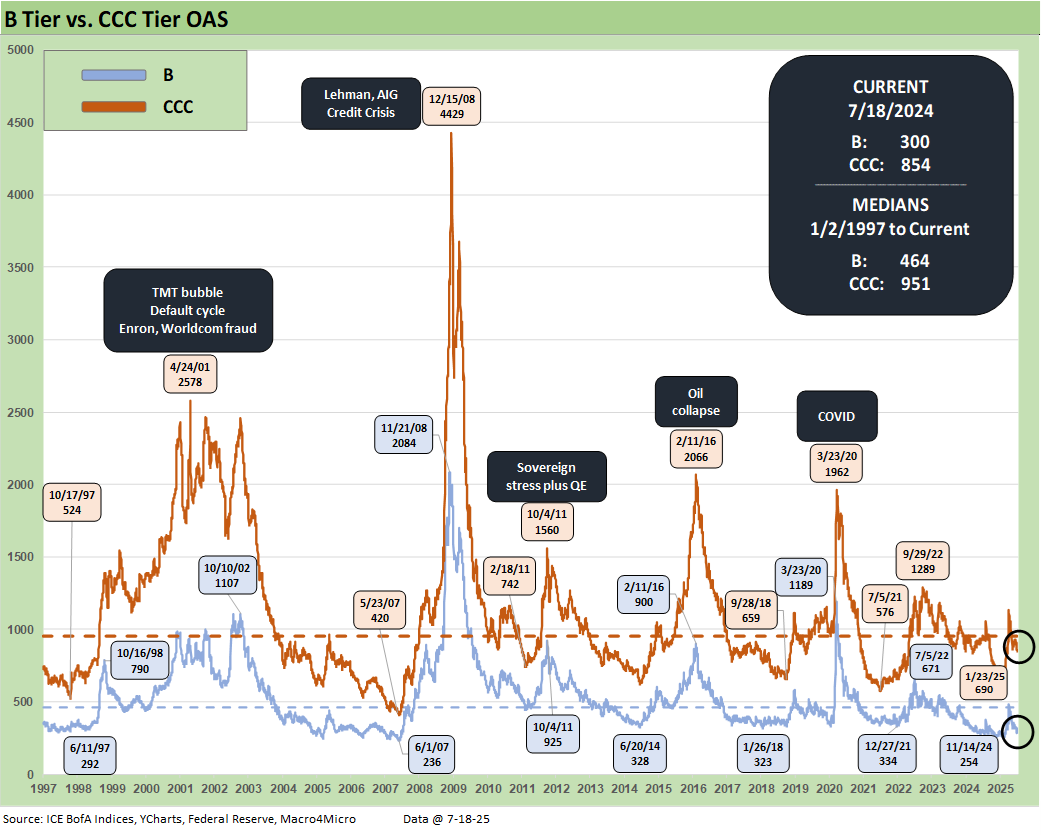
The B vs. CCC tier OAS time series is plotted above. The timeline for B and CCC spreads highlights the points of major divergence along the way (see The B vs. CCC Battle: Tough Neighborhood, Rough Players 7-7-24).
The current CCC tier OAS at +854 bps tightened by -3 bps the past week and remain well under the long-term median of +951 bps. The CCC YTW stayed below 13% at 12.59% after being above 14% in the Liberation Day sell-off. The underlying constituents are widely dispersed across an 83.3 composite dollar price. The CCC tier is still in the pricing zone of equity-like risk-returns with such yields.
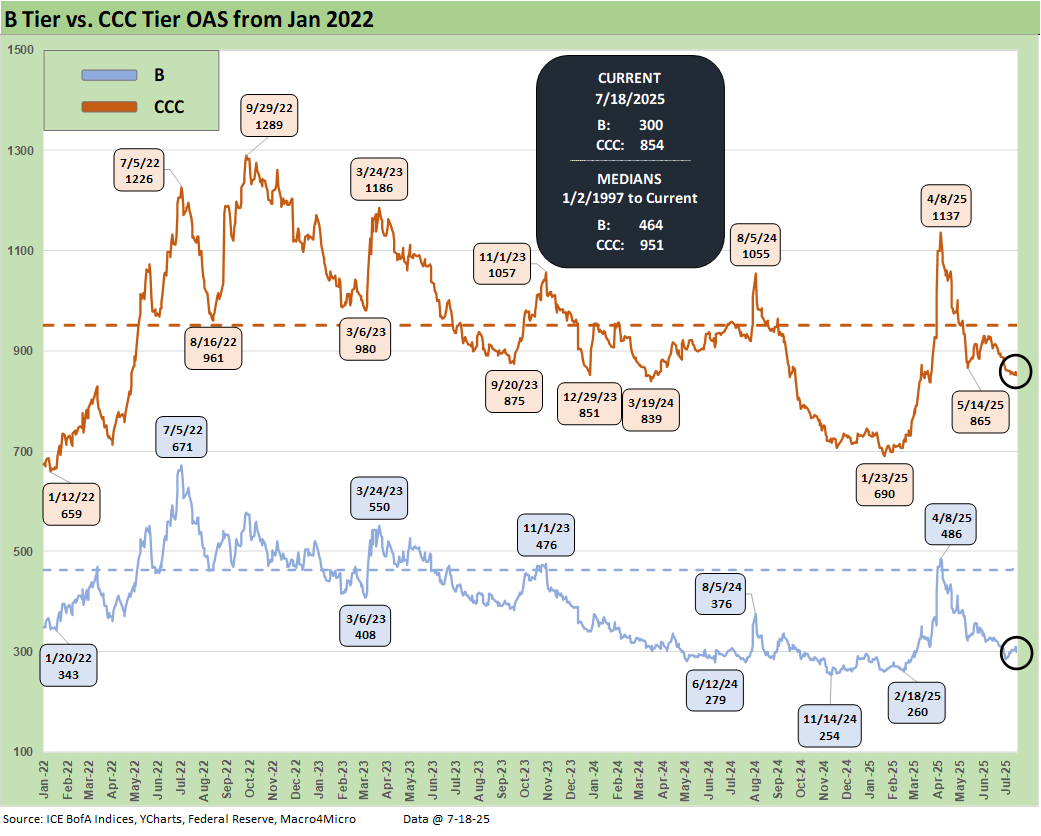
The shorter timeline from Jan 2022 just ahead of the end of ZIRP and start of the tightening cycle gives better granularity on the movements from a low for CCCs of +659 bps in Jan 2022 to a peak of +1226 bps in July 2022 and +1289 bps to end Sept 2022. Then spreads came down to the Jan 2025 tights of +690 bps ahead of the recent spike and whipsaw to current levels.
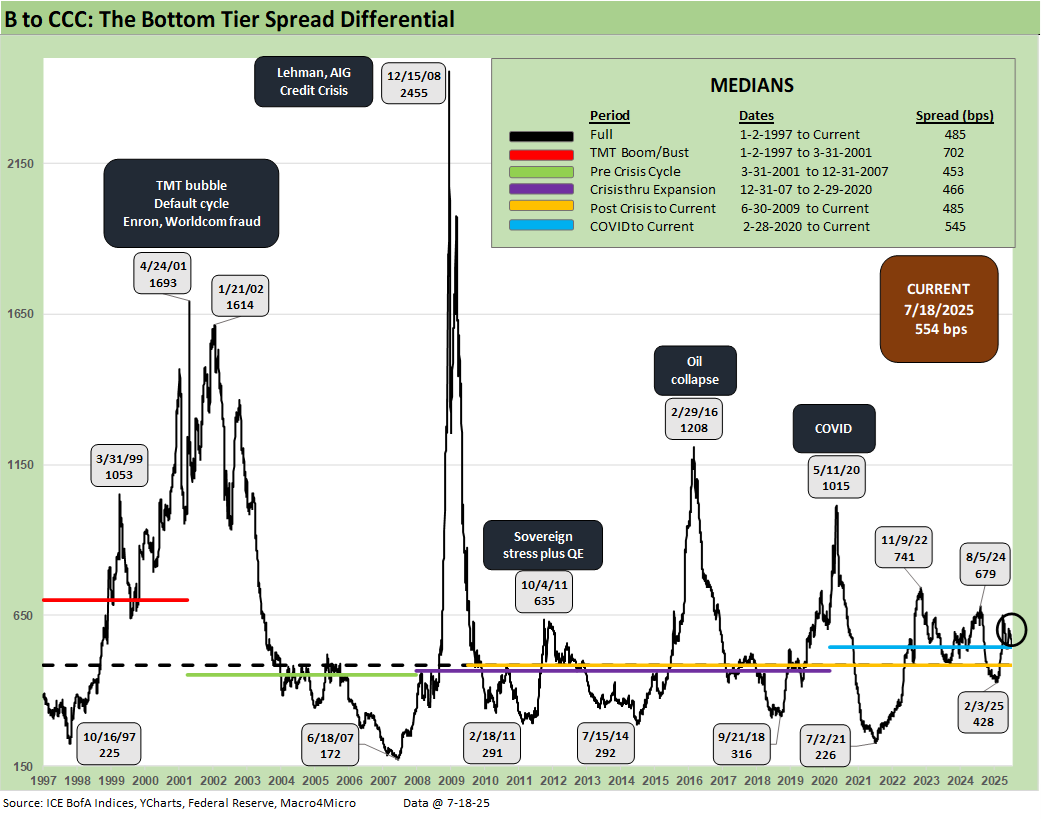
The B vs. CCC tier differential is broken out with the current +554 bps still higher than the long-term median of +485 bps and above the distinct market time horizons with the exception of the TMT HY credit cycle with its +702 bps median. The risks this year have seen CCC tier spreads remain wider by +108 bps YTD after the earlier whipsaw while the B tier is now +4 bps wider YTD.
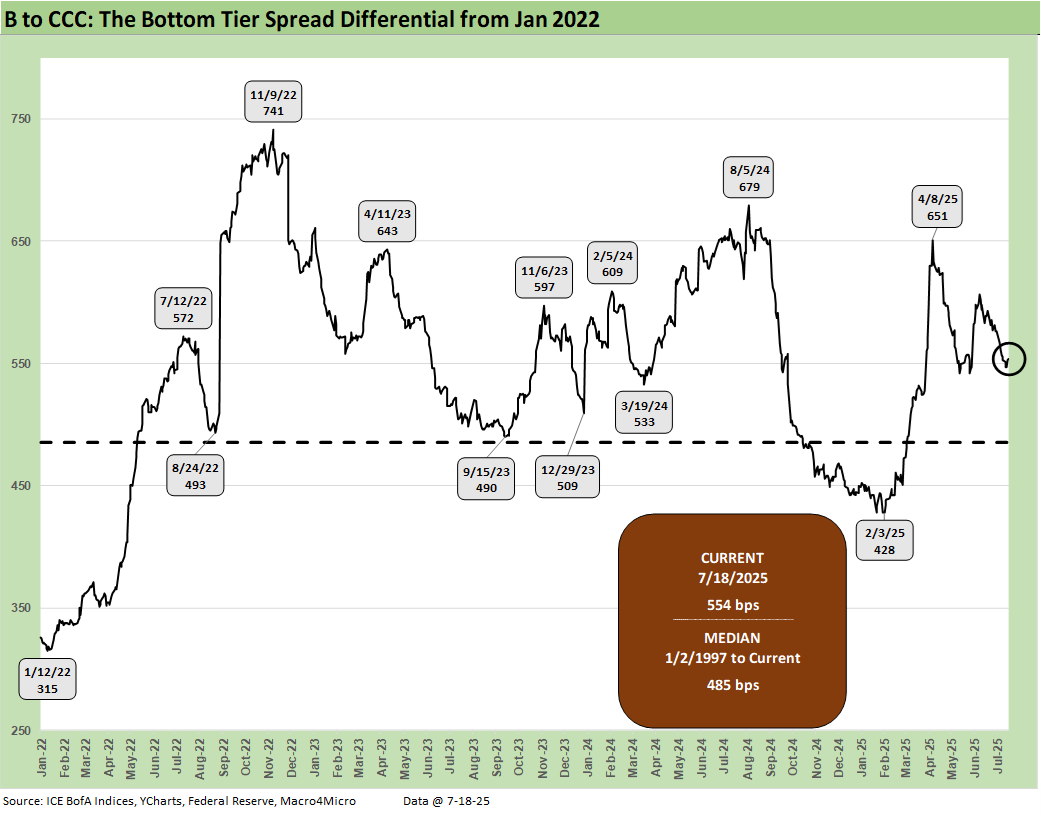
The above chart frames the “B vs. CCC tier” quality spread differential across the short timeline for better granularity. Quality spreads had widened with a vengeance since the low of Feb 2025 at +428 bps even if quality spreads recovered to +554 bps from the early April spike of +651 bps on April 8.
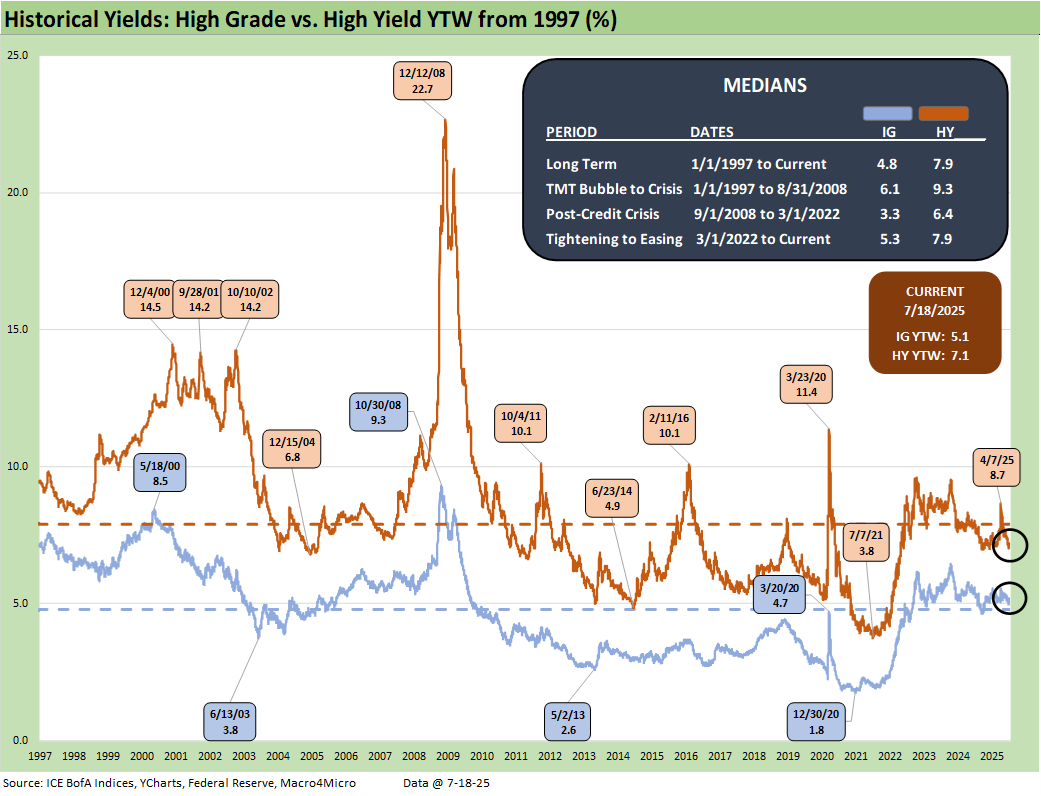
Moving away from spreads, which are well below long-term medians, yields for both IG and HY have a more complex story in historical context given the post-crisis distortions of ZIRP and “normalization.” The normalization period of Dec 2015 to Dec 2018 never really got on track with the economic weakness and Fed easing of 2019 followed by a COVID crisis and return to ZIRP in Mar 2020 (ZIRP ended March 2022). As a reminder, 2018-2019 was the “Greatest Economy in History” according to the current White House resident. As we’ve covered in past commentaries, the numbers do not agree with that assessment – not even close.
The current IG YTW at 5.11% (vs. 5.14% last week) moved lower with spreads as the UST was more mixed. IG YTW remains below the 6.1% pre-ZIRP median on overall YTD UST curve moves.
The HY YTW decreased to 7.11% this week (from 7.19%) vs. a pre-ZIRP 9.3% median. We consider the pre-ZIRP years the most rational frame of reference in light of the post-crisis ZIRP and QE as well as the COVID Fed reactions.
Spreads will remain a key swing factor for reaching those yield medians of pre-ZIRP years, and we just saw material volatility in credit risk pricing in HY since early April. Then came a fresh rally after Iran and optimism on how the tariff pause will play out after a Vietnam deal framework was in hand. The final round of tariffs to wind down the pause period fell well short of the tariff optimism, but the market has shown only a modest reaction in HY.
UST yields are a tougher call with the tariff backdrop still threatening stagflation as well as the potential for a further technically driven upward UST curve shift on the supply-demand fears. Stagflation risk remains in the debate.
Away from stagnation + inflation, old fashioned recession risk would pressure UST rates lower and credit spreads higher, but this is no ordinary cyclical turn. We cover the UST shapeshifting in our separate Footnotes publication on the State of Yields as the UST curve rallied in short to intermediate while the 30Y drove a steepening for long duration bonds.
The market could (and should) react negatively to any success by Team Trump to terminate Powell to complete the sweep of complete control over all fiscal, monetary, and trade policy by Trump. This past week saw another round of attacks launched on Powell by a myriad of talking heads. The Fed needs to be independent, especially when the main obstacle to easing is the Trump tariff excess. The market will not like a violation of that core principle.
Bessent was on the screen today as we go to print pitching a review of the entire Fed framework which was essentially a poor rehash of maybe a few lines of Project 2025’s Chapter 24. He made fun of PhDs (always a crowd pleaser) but said very little of substance. Bessent has been one of the disinformation channels on how tariffs actually work (see Tariffs: A Painful Bessent Moment on “Buyer Pays” 5-7-25).
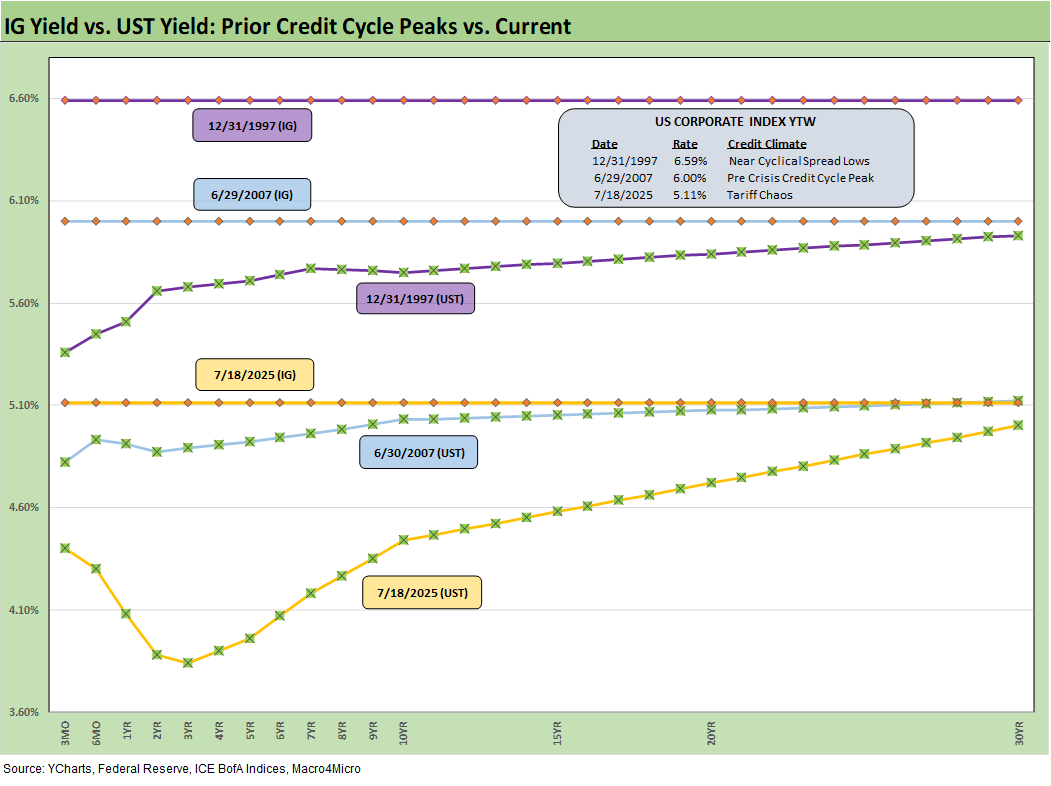
The above frames current IG index yields vs. previous credit peaks along with their respective UST curves. We include both prior credit peaks in June 2007 and Dec 1997 for context as prior peak credit cycles featured high risk appetites and saw investors chasing yields. Those 1997 and 2000 markets saw poor risk symmetry and low spreads.
Today’s UST curve is still low in the context of those historical credit peaks. We saw a recent glimpse of rising long yields along the timeline and the return pain that comes with it. The focus remains on the budget deficit and UST supply as the main driver for duration risk here as we get clarity on the size of the deficit increase. Expected revenues flowing into the US Treasury from tariffs come with the potentially conflicting impact of lowering imports and undermining domestic tax revenue if the cycle weakens.
Reagan got a taste of disappointing tax revenues in the 1980s that caused him to reverse some tax policies (notably on the corporate side). The growth stimulus from the One Big Beautiful Bill may fall well short with few forecasts above 2% GDP growth in the markets. The Fed, OECD, World Bank, and many major banks are calling for 1% handle US GDP growth this year and next.
Stagflation risks will stay in the mix with the current market beyond the credit cycle peak after the tariffs, and long-dated yields still could go easily higher along with spreads widening again for another round of return pain. The weak dollar has had the effect of making tariffs even more expensive for US buyers. The dollar at one point had seen its worst performance since the 1970s with a mild recent rebound. That is the exact opposite effect of what Ryan and Brady were promising back in 2017 with their Border Adjusted Tax proposals (aka BAT Tax or tariffs). That plan was supposed to replace corporate taxes. The GOP controlled Senate dissed their plan and did not even consider it. Times change.
The short to intermediate IG market is still the safest bond game for now. The funds that are asset class constrained to HY can take refuge in the higher quality layers. Overall corporate default risks in HY bonds remain in check (private credit is its own distinct story and mix).
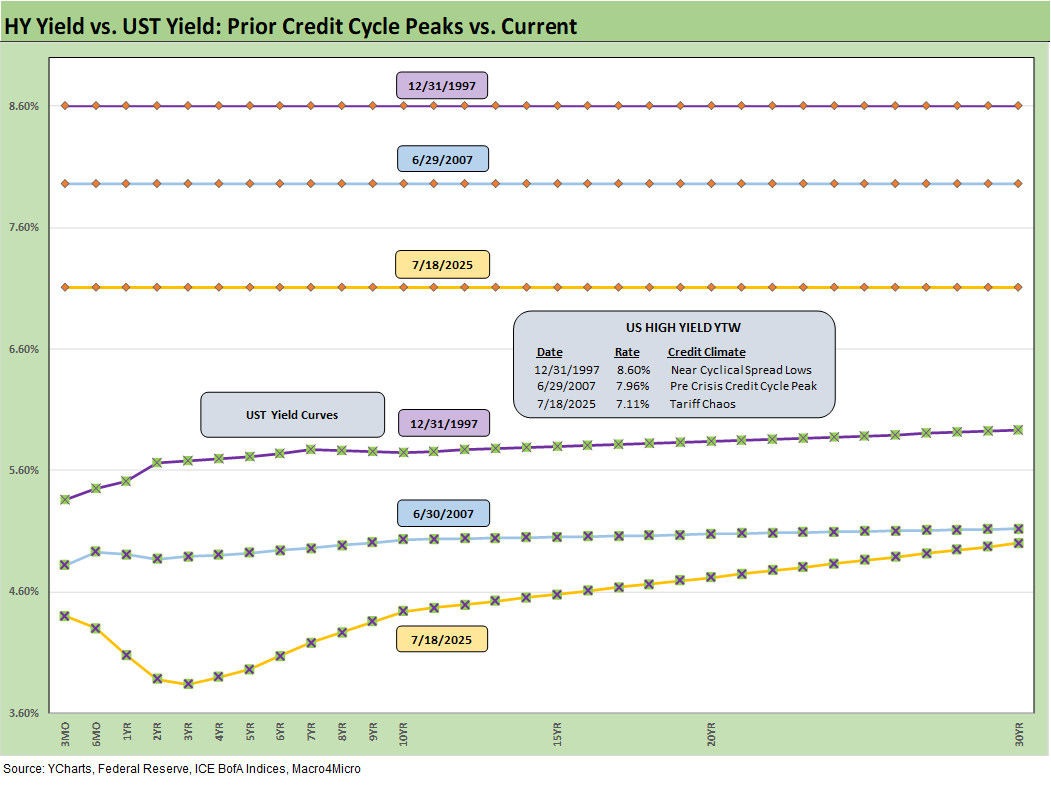
The final chart does the same 1997 and 2007 drill but for HY index yields. This week’s UST move leaves HY index yields below prior peak credit cycles at 7.11% as of Friday vs. 7.96% in June 2007 and 8.60% in Dec 1997. The recent spread widening had moved HY index yields higher, but the recent reversal and rolling UST moves leave the current HY index YTW well below both the 2007 peak and 1997 HY index levels.
The widening during April gave flashbacks to the volatility and major spread moves of the 1997-98 and 2007-08 periods that also posted triple-digit widening months. The sheer speed of risk repricing that has happened in earlier cycles and with the Liberation Day shock offers reminders even if those moves were for very different reasons.
We would highlight that the quality of the HY mix (industries and issuers) is superior today to those in 1997-1998 and 2007-2008. That is especially the case in the IG financial sector vs. 2008, where some securities firms and some banks were like a grenade with a loose pin.
Below we roll forward some updated commentary on the credit cycle…
The challenge is identifying a fundamental transmission mechanism to more trouble for financial metrics and relative risks of default. Identifying a catalyst for pain in the current market would highlight tariffs or trade wars hitting the macro drivers (the consumer) and micro drivers of corporate profitability and cost mitigation actions to offset the tariff expense. The oft misrepresented “buyer pays” reality will hit margins or require higher prices.
The recent tariff strategy is both unpredictable and unprecedented in modern capital markets, but at least the banks are much healthier. US-China trade talks calmed some troubling trade nerves and put out a fire, but the most recent Section 232 hike to 50% on steel, aluminum, and now copper reopens a fresh wound with a lot more to come in areas with a 200% tariff threat to pharma a notable one.
The tariff attack on pharma would come at a lag of more than a year to 1 ½ years, but a year in the life of global supply chains (e.g. China-based ingredients, EU production) for US and high value-added manufacturing in EU and Asia is not very long. Such policies also entail immediate disruption and higher costs. One can only guess the fallout in pharma pricing, more trade conflict across supplier chains, and basic logistics.
The latest round of tariffs set for an Aug 1 date now covers over 70% of US trade. EU, Mexico, and Canada all at or above the 30% tariff mark. That leaves exposure to reciprocal actions as one trade partner taking on the bully could quickly lead to more.
The trade deal actions remain a threat to inflation, the economic cycle, and corporate profitability. Reciprocal tariffs are now getting “assigned” again rather than negotiated with the “90 days, 90 deals” mantra one more credibility killer for those expecting economically rational conduct in the process. The approach damages alliances and creates a lot of justified distrust and potential animosity with major and minor trade partners. That creates opportunities for China to step into the relationship and geopolitical disarray.
The clock is ticking with little to show in final “deals.” Headlines await later this year on how many billions in tariffs will ultimately be an allocated cost by industry group and issuers and how “transitory” the inflation may be in macro context. The temptation of trade partners to retaliate and let Trump feel the full impact of the inflation toll and political costs might be running high for some. They can always blame him for the domestic fallout in their countries.
We also see higher quality levels in the HY bond index as a starting point vs. 2007 and the late 1990s TMT bubble years. The reality is the tariff impacts and supply-side disruptions are only now just beginning in substance.
China was a rough lesson for the markets. As we saw with Nike recently ($1 bn tariff costs) and Levis, we should see more quantified tariff cost estimates from more companies in June and July quarter earnings reports (Nike was a May fiscal 4Q), though the latest increase may complicate that picture again. Levis assumptions as detailed on their earlier earnings call appeared well below what unfolded in the ensuing tariff process.
It is useful for Trump to play his hand with pauses as the mood moves him in his own murky game theory plan, but corporate investment, big ticket purchase decisions by consumers, and FOMC policy setting can also take a protracted break beyond the pause.
The bad old days…
Looking back even more, the turn in the credit cycle always comes at some point and often with an external trigger or “assist” that can set it off. During 1990, securities firms started to collapse including Drexel’s Chapter 11 in Feb 1990 and bridge loan related bailouts of Shearson Lehman, First Boston, and Kidder Peabody. We do not face that type of financial intermediary meltdown risk here (at least not yet). In a protracted stagflation bout, eyes will return to the regional banks.
The summer of 2007 was the start of major problems in the credit markets with asset risk and leveraged counterparty exposure and bank/broker interconnectedness risk soaring. Despite that backdrop that worsened in August 2007, the equity markets and S&P 500 and NASDAQ kept on rallying into Oct 2007. Later in the turmoil and well after the fact, the start of the recession was tagged as Dec 2007 (see Business Cycles: The Recession Dating Game 10-10-22).
The 2007 experience reminds the market that credit leads the economic cycle and equity lags. The same was true in 1999 with the HY default cycle underway and NASDAQ at +86% that year. This time around, the credit markets did not expect the tariff insanity. The initial spread wave in April quickly reversed but there could be fresh rounds. The China downside scenario was the worst and is now a lower risk. What is shocking was the poor White House grasp on the risks. China had a lot more tricks up its sleeve in supply strategies (e.g. pharma).
Buyer “writes the check” on tariffs. Facts matter.
The real economic effects are more geared to the periods ahead when tariffs will be rolling in at the transaction level. That will be the reality point. We expect HY to be unhappy again in the fall and spreads to average wider as the tariffs roll into actual corporate fundamentals.
There are no frictionless wheels in high tariffs. The buyer pays the tariff at customs (literally “writes the check”). How that gets spread around the economic chain from the seller to buyer to wholesale and end customer has a lot of moving parts.
The “seller pays” and “selling country pays” has been a clear falsehood from the Trump camp, and he admitted as much when he demanded that Walmart “eat” the tariff cost. Why would there be anything to eat if the seller pays? He has been out again each week repeating that with the latest tariff wave on the march to the deadline.
Shady and misleading discourse is never new to Washington. Substitute the question “who writes the check to customs” for the “who pays the tariff” and it is easier to corral those who play semantics and tweak key words. The reality is that Trump never “collected hundreds of billions” from selling countries.
Trump recently highlighted his mega collection process yet again, reiterating the hundreds of billions he “collected” from selling countries. He even cited a hard number in one live session ($600 billion). We cannot tell what Trump remembers as a fact and what he made up. Until the tariff deals are put to bed, outsized “surprise risk” in tariffs remains high on the list. Since Trump essentially breached the USMCA, even a deal is not a reliable deal.
Markets:
Footnotes & Flashbacks: State of Yields 7-20-25
Footnotes & Flashbacks: Asset Returns 7-20-25
Mini Market Lookback: Macro Muddle, Political Spin 7-19-25
Housing Starts June 2025: Single Family Slips, Multifamily Bounces 7-18-25
Retail Sales Jun25: Staying Afloat 7-17-25
June 2025 Industrial Production: 2Q25 Growth, June Steady 7-16-25
CPI June 2025: Slow Flowthrough but Starting 7-15-25
Footnotes & Flashbacks: Credit Markets 7-14-25
Mini Market Lookback: Tariffs Run Amok, Part Deux 7-12-25
Mini Market Lookback: Bracing for Tariff Impact 7-5-25
Payrolls June 2025: Into the Weeds 7-3-25
Employment June 2025: A State and Local World 7-3-25
Asset Return Quilts for 2H24/1H25 7-1-25
JOLTS May 2025: Job Openings vs. Filling Openings 7-1-25
Midyear Excess Returns: Too little or just not losing? 7-1-25
Recent Tariff commentary:
US-Italy Trade: Top 15 Deficit, Smaller Stakes 7-18-25
US-France Trade: Tariff Trigger Points 7-17-25
Germany: Class of its own in EU Trade 7-16-24
US-Canada Trade: 35% Tariff Warning 7-11-25
India Tariffs: Changing the Music? 7-11-25
Taiwan: Tariffs and “What is an ally?” 7-10-25
US-Trade: The 50% Solution? 7-10-25
Tariff Man Meets Lord Jim 7-8-25
South Korea Tariffs: Just Don’t Hit Back? 7-8-25
Japan: Ally Attack? Risk Free? 7-7-25
US-Vietnam Trade: History has its Moments 7-5-25
US Trade in Goods April 2025: Imports Be Damned 6-5-25
Tariffs: Testing Trade Partner Mettle 6-3-25
US-UK Trade: Small Progress, Big Extrapolation 5-8-25
Tariffs: A Painful Bessent Moment on “Buyer Pays” 5-7-25
Trade: Uphill Battle for Facts and Concepts 5-6-25
Ships, Fees, Freight & Logistics Pain: More Inflation? 4-18-25
 |
|