
Home Starts August 2025: Bad News for Starts
Weak home starts and permits ended the summer on a bad note with double-digit declines YoY in 3 of 4 regions including the largest two.


With the Fed easing expectations and a softening economy helping mortgage rates get to a 6.1% handle at last night’s close (Mortgage News Daily survey), the hope is that additional home price and mortgage incentives will pair with better monthly payment math to get some of the pent-up demand back on track.
For August starts, only the Midwest avoided YoY double-digit % declines at -4.3% for single family. The sequential MoM volumes for single family weakened and were down by -7.0% in total. The critical South region (56% of total single family starts) posted -17.0% MoM from July to August.
Permits were also dismal with single family permits off -11.5% YoY, but sequential MoM single family declines were more muted at -2.2% YoY. YoY variances showed the massive South region at -10.8% and the second largest region – the West – at -20.9% YoY for single family permits. We see 3 of 4 regions with negative MoM variances in permits for single family with only the Midwest posting a slight uptick of +1.6% YoY.
Multifamily was also negative in permits with -10.8% in total YoY and -6.7% MoM. Multifamily starts posted +15.8% YoY for August and +17.5% YTD on a not seasonally adjusted basis (NSA). The MoM multifamily for August is -11% in another sign of the relative volatility of the multifamily starts lines.
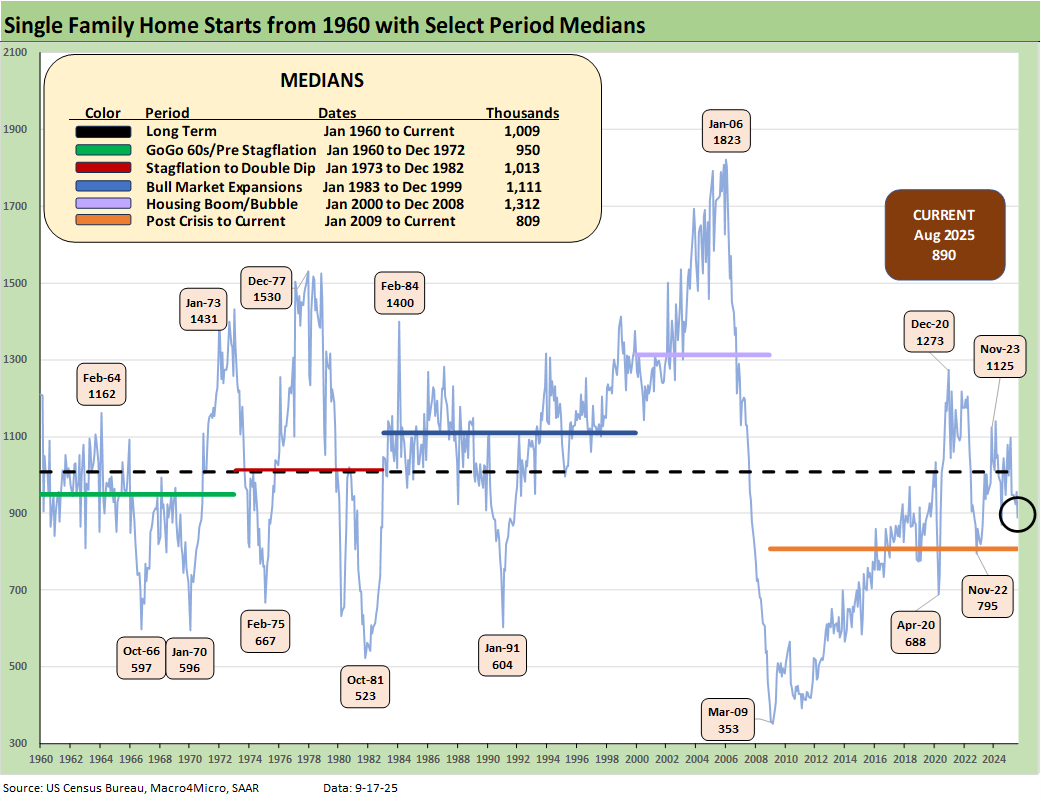
The single family home starts time series certainly shows a wild ride across the cycles considering the intrinsically high demand for housing tied to demographics. The weakness after the COVID cycle is colored by the sharp rise in home prices that came with supply-demand imbalances as well as the extensive yield curve damage and ensuing volatility that has seen a 200 bps Hi-Lo range for 30Y mortgages since the fall of 2023 through 2025.
In the GDP report, residential investment shows up in the Gross Private Domestic Investment (GPDI) line and has been negative in both 1Q25 and 2Q25 (see 2Q25 GDP: Second Estimate, Updated Distortion Lines 8-28-25). Housing starts are important as critical indicators of macro conditions from the consumer to the yield curve, but they don’t wag the headlines (or the Fed) like payroll numbers that fall under the Fed dual mandate. Later today we will get the FOMC decision, market color, and forecasts of the line items in the SEP report.
We need to keep in mind that 100 bps of easing in late 2024 saw a major mortgage rally initially before the market saw a bear steepener unfold into 2025 that sent mortgages much higher. We have looked at those topics in our weekly yield curve work and housing sector research, but the tariff plot line vs. the payroll pressure does not lend itself to easy assumptions (see The Curve: FOMC Balancing Act 9-14-25). Recent history reminds us.
By the numbers…
The current 890K for single family starts is detailed in the chart above along with the trend line across the cycles. The August single family starts tally was lower by -7.0% MoM and down by -11.7% YoY. Separately, total starts overall were -8.5% MoM with Multifamily at +15.8% YoY and -11.0% MoM. We also saw a big increase sequentially in June following a big decline in May. Multifamily starts show their usual volatile lumpy pattern.
The South region at 56% of single family starts (SAAR) was -17.0% MoM and -11.7% YoY while the West as the #2 region was +1.6% MoM and -15.8% YoY. The Midwest was +8.2% MoM for single family and -4.3% YoY. The very small Northeast market was +42.3% from July and -12.9% YoY.
The homebuilder June quarter reporting season saw a lot of soft guidance across many (not all) homebuilders (see links at bottom). The financial priority of the homebuilders is prudent working capital management with a balance of starts vs. sales/deliveries. The homebuilders are successfully managing their way through the cycle and managing their finances prudently.
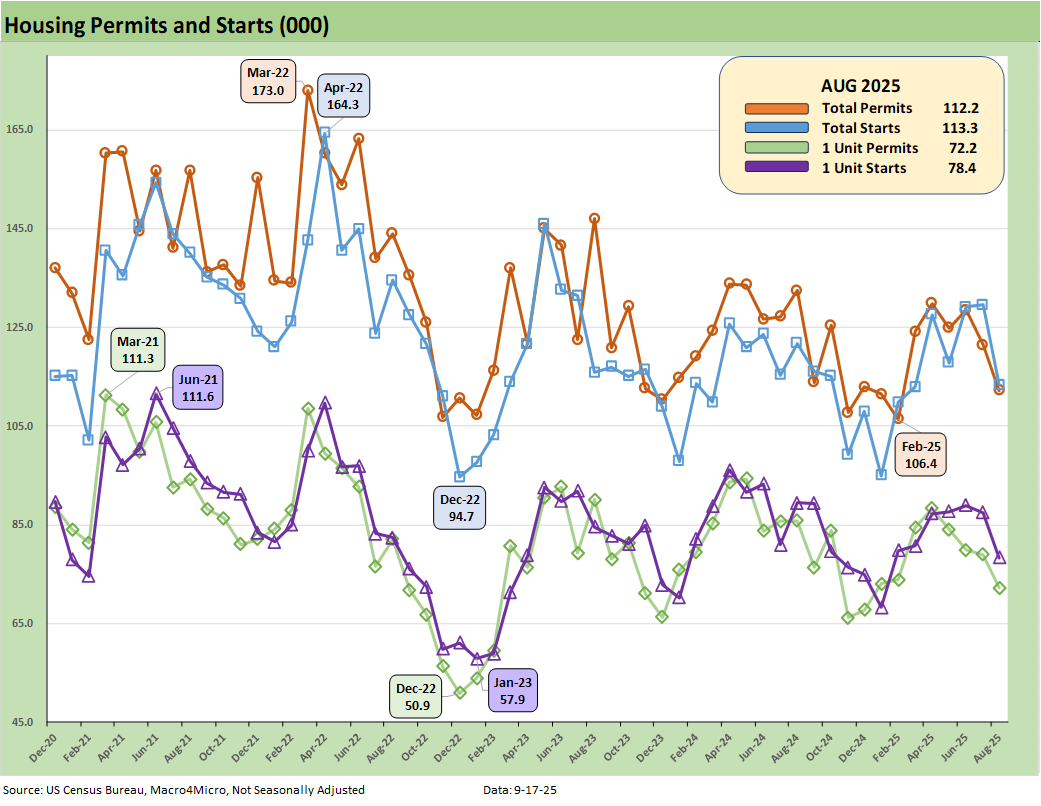
The above chart plots total permits and total starts on a Not Seasonally Adjusted (NSA) basis, and for August, we see NSA total permits lower (-7.7%) and single family permits down by -8.6%. NSA Year-to-Date permits were -5.0% for total permits and a decline of -7.0% for single family permits for YTD August. NSA is viewed as closer to what is going on in the trenches without the SAAR model assumptions.
For total starts and single family starts on an NSA basis, we see total starts down sharply at -12.6% MoM and single family lower by -10.4%. The YTD NSA starts is +0.7% for total starts and down by -4.9% for single family starts YTD.
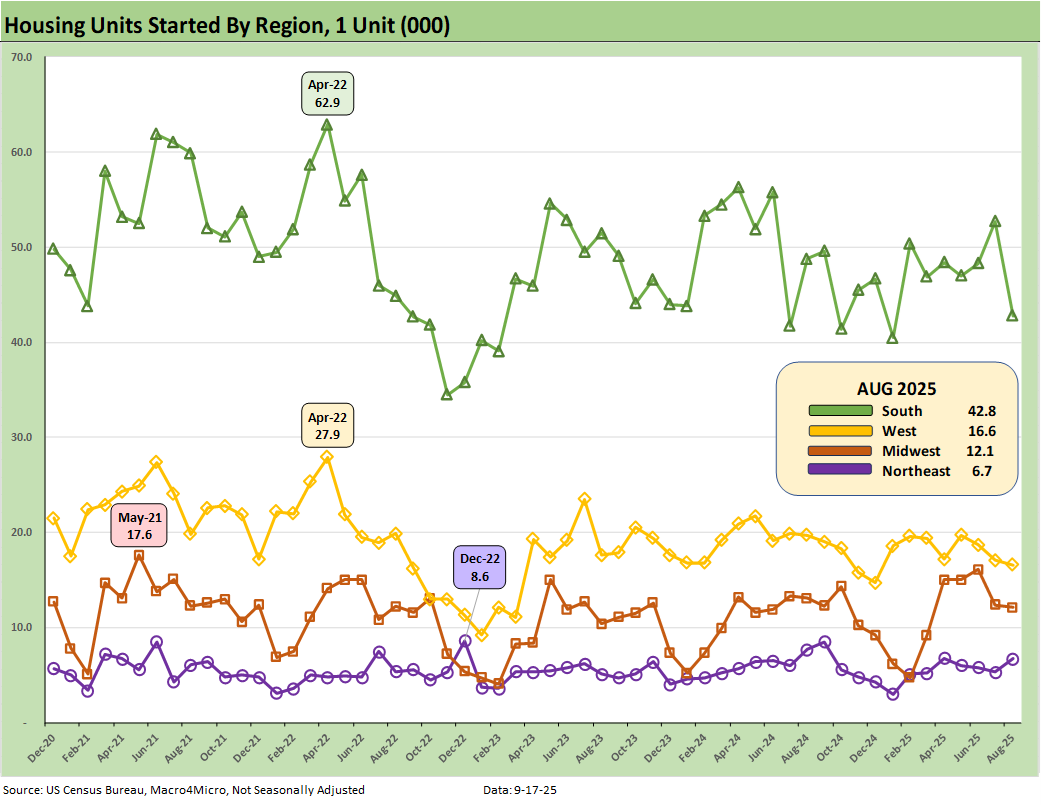
The above plots the single family starts by region on an NSA basis. The two largest regions (South and West) were both lower in the NSA numbers. The Midwest moved slightly lower, and the small Northeast market ticked higher.
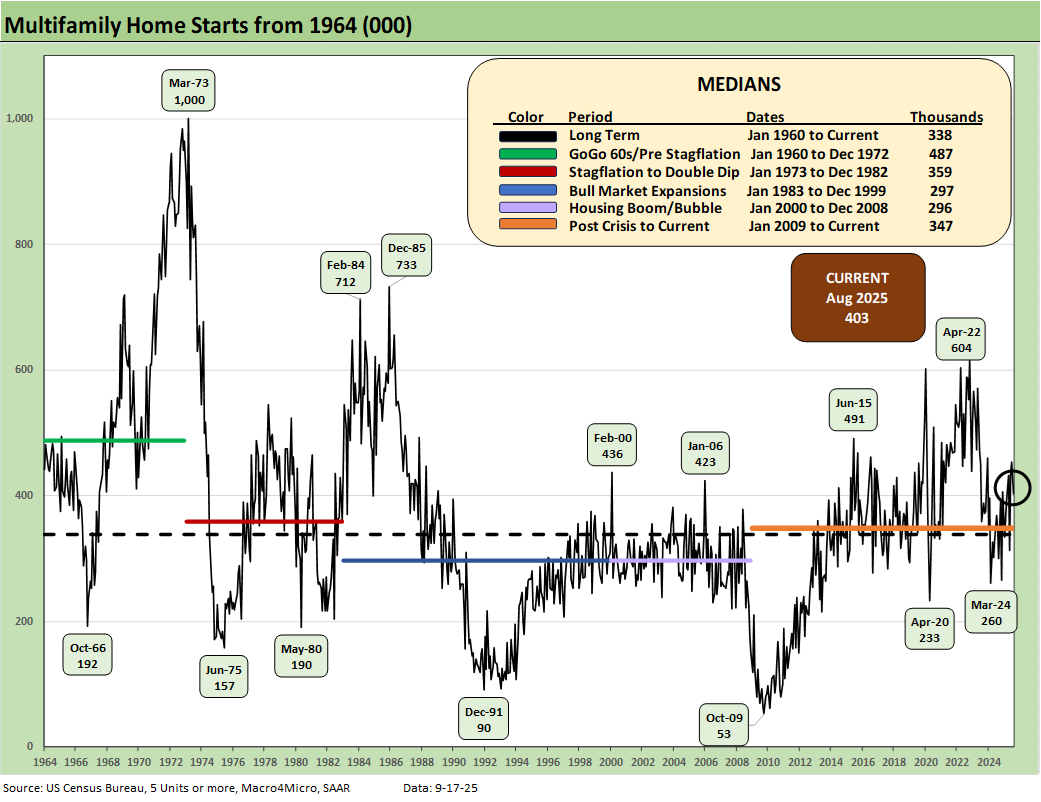
The above chart updates running multifamily starts. At +403K (SAAR), August 2025 declined by -11.0% sequentially and was up by +15.8% YoY. The 403K is still above the long-term median of 338K, above the median from Jan 2009 to current (347K), and above the median from 2000 to 2008 (296K).
The 1960s was a boom period for multifamily with the postwar explosion of urbanization and high racial migration from the south to the north. On an NSA basis (not shown), the YTD multifamily starts is +17.5%.
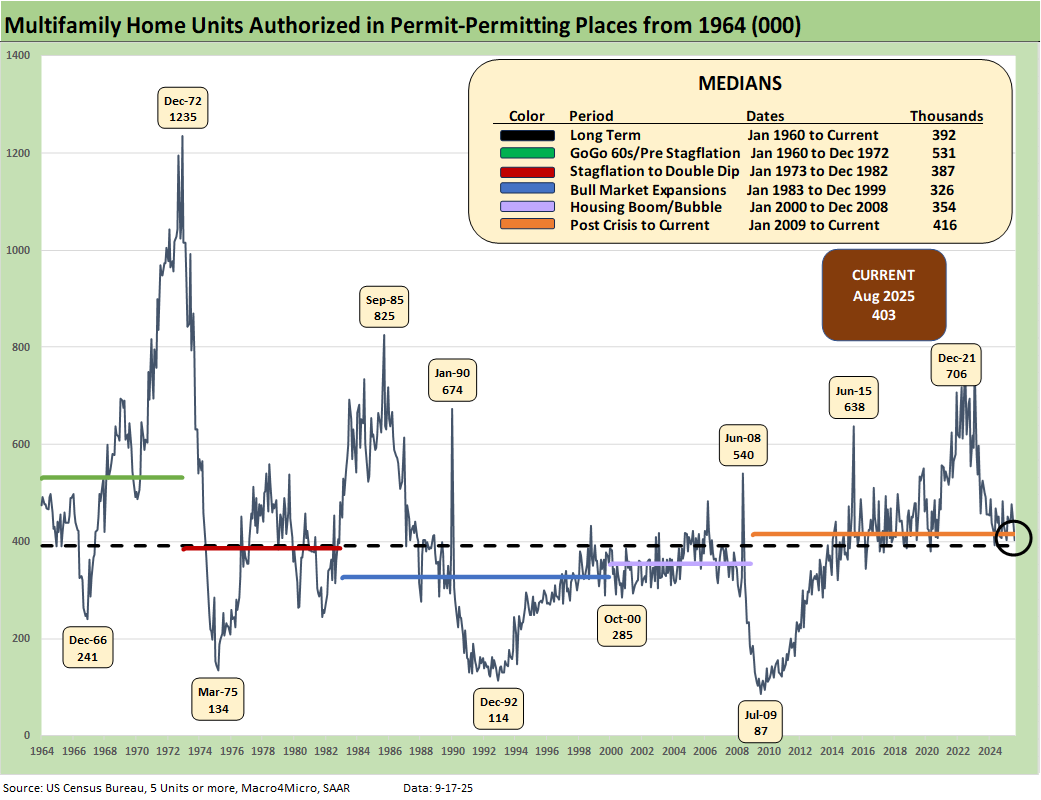
The above chart updates Multifamily permits (SAAR). The 403K is down in August by -6.7% MoM and down by -10.8% YoY. The YTD change on an NSA basis for multifamily permits (not shown) is -1.0%.
Housing sector:
New Home Sales July 2025: Next Leg of the Fed Relay? 8-25-25
Existing Home Sales July 2025: Rays of Hope Brighter on Rates? 8-21-25
Homebuilders:
Toll Brothers Update: The Million Dollar Club Rolls On 8-26-25
Taylor Morrison 2Q25: Resilient but Feeling the Same Macro Pressure 7-25-25
PulteGroup 2Q25: Still-Lofty Margins see a Mild Fade 7-23-25
D.R. Horton 3Q25: Material Slowdown Still Good Enough 7-22-25
KB Home 2Q25: Negative Industry Trends Keep Coming 6-25-25
Lennar 2Q25: Bellwether Blues 6-20-25
Credit Snapshot: Meritage Homes (MTH) 5-30-25
Homebuilder Rankings: Volumes, Market Caps, ASPs 5-28-25
Credit Snapshot: PulteGroup (PHM) 5-7-25
Credit Snapshot: D.R. Horton (DHI) 4-28-25
Credit Snapshot: Lennar (LEN) 4-15-25
Credit Snapshot: Taylor Morrison Home Corp (TMHC) 4-2-25
KB Home 1Q25: The Consumer Theme Piles On 3-25-25
Lennar: Cash Flow and Balance Sheet > Gross Margins 3-24-25
Toll Brothers 1Q25: Performing with a Net 2-20-25
Credit Crib Note: Lennar Corp (LEN) 1-30-25
D.R. Horton: #1 Homebuilder as a Sector Proxy 1-28-25
KB Home 4Q24: Strong Finish Despite Mortgage Rates 1-14-25
See also:
Industrial Production Aug 2025: Capacity Utilization 9-16-25
Retail Sales Aug 2025: Resilience with Fraying Edges 9-16-25
Credit Markets: Quality Spread Compression Continues 9-14-25
The Curve: FOMC Balancing Act 9-14-25
Footnotes & Flashbacks: Asset Returns 9-14-25
Mini Market Lookback: Ugly Week in America, Mild in Markets 9-13-25
CPI August 2025: Slow Burn or Fleeting Adjustment? 9-11-25
PPI Aug 2025: For my next trick… 9-10-25
Mini Market Lookback: Job Trends Worst Since COVID 9-6-25
Payrolls Aug 2025: Into the Weeds 9-5-25
Employment August 2025: Payroll Flight 9-5-25
JOLTS July 2025: Job Market Softening, Not Retrenching 9-3-25
Hertz Update: Viable Balance Sheet a Long Way Off 9-3-25
Mini Market Lookback: Tariffs Back on Front Burner 8-30-25
PCE July 2025: Prices, Income and Outlays 8-29-25
2Q25 GDP: Second Estimate, Updated Distortion Lines 8-28-25
Avis Update: Peak Travel Season is Here 8-27-25
Durable Goods July 2025: Signs of Underlying Stability 8-26-25
Toll Brothers Update: The Million Dollar Club Rolls On 8-26-25
New Home Sales July 2025: Next Leg of the Fed Relay? 8-25-25
Mini Market Lookback: The Popeye Powell Effect 8-23-25
Existing Home Sales July 2025: Rays of Hope Brighter on Rates? 8-21-25
Home Starts July 2025: Favorable Growth YoY Driven by South 8-19-25
Herc Holdings Update: Playing Catchup 8-17-25
Mini Market Lookback: Rising Inflation, Steady Low Growth? 8-16-25
Retail Sales Jul25: Cautious Optimism in the Aisles 8-15-25
Iron Mountain Update: Records ‘R’ Us 8-11-25
Mini Market Lookback: Ghosts of Economics Past 8-9-25
Macro Menu: There is More Than “Recession” to Consider 8-5-25
Mini Market Lookback: Welcome To the New World of Data 8-2-25