
PPI Aug 2025: For my next trick…
August PPI showed the opposite trend of what we saw in July, but we get the bigger test with CPI in the morning.


The sequential MoM PPI action in August just upped the ante for tomorrow’s CPI as the last inflation metric before next week’s FOMC meeting (see Producer Price Index: A Snapshot of the Moving Parts 8-14-25). The news was bullish for the “more easing” story with some obvious asterisks around the IEEPA SCOTUS decision.
The FOMC handicapping is leaning toward more easing than the earlier forecast with the FedWatch estimates calling for 25 bps in Sept, Oct, and Dec 2025.
The slow turning of the wheel on tariff costs, mitigation strategies, margin impacts, and handicapping consumer demand in a slowing economy will keep on turning subject to the SCOTUS decision on IEEPA, the pace timing, and magnitude of pending Section 232 decisions.
To the extent the PPI is a useful leading indicator, there are a lot of evolving risk factors on what will weigh on corporate sector strategies and asset allocation decisions. There are also plenty of supply and demand factors still to be digested.
The PPI trend line each month will keep doing its thing, and there are so many line items it gets more than a little difficult to gauge the inflation effects and potential for finished goods price trends. The questions around how tariff cost pressures (paid by the buyer) remain as to how tariffs will generate responses along the supplier to OEM to customer chain (eat the cost, cut other costs, raise prices, change product mix plans, etc.). The timeline is set by the markets and not by “axed” policy advocates or partisan disinformation.
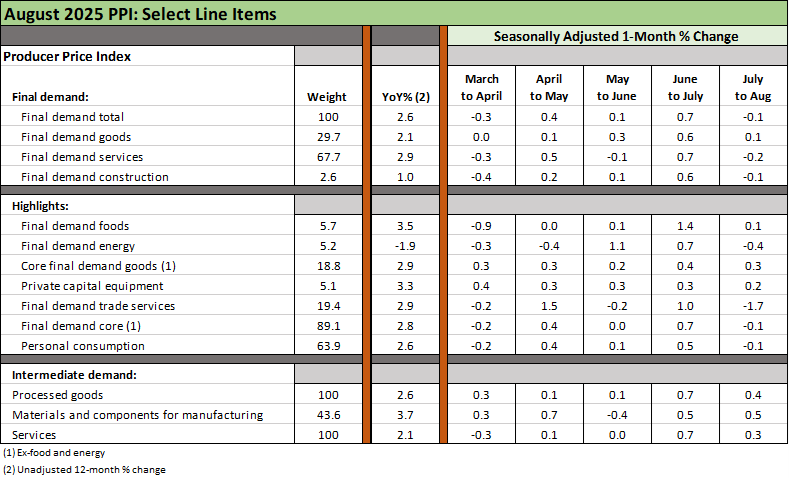
The above table is easy enough to scan for MoM deltas and the mix of “up vs. down.” This month shows a much different pattern than the July PPI trends. The final demand lines show a material reversal. On the intermediate side, materials and components stayed higher than the group in YoY trends as did private capital equipment, but the bulk remained low in YoY deltas.
Table 1 of the PPI release lends itself to an old fashioned vertical and horizontal scan process to look for YoY outliers and sequential moves. You don’t see much over 3% in the final demand YoY column. In intermediate processed goods, some lines such as “Materials for Manufacturing” (+26.7% weight) popped above 4% YoY (4.4%) while Materials for Durables hit +9.1%. One thing the PPI report does not lack is line items. It seems at times like a throwback to the old days of a Manhattan phone book.
See also:
Credit Markets: Spread Risk Lurks, but the World Waits 9-8-25
The Curve: The Road to Easing has been Long. 9-8-25
Footnotes and Flashbacks: Asset Returns 9-6-25
Mini Market Lookback: Job Trends Worst Since COVID 9-6-25
Payrolls Aug 2025: Into the Weeds 9-5-25
Employment August 2025: Payroll Flight 9-5-25
JOLTS July 2025: Job Market Softening, Not Retrenching 9-3-25
The Curve: Risk Tradeoff - Tariffs vs. UST Supply 9-1-25
Mini Market Lookback: Tariffs Back on Front Burner 8-30-25
PCE July 2025: Prices, Income and Outlays 8-29-25
2Q25 GDP: Second Estimate, Updated Distortion Lines 8-28-25
Durable Goods July 2025: Signs of Underlying Stability 8-26-25
The Curve: Powell’s Relief Pitch 8-24-25
Mini Market Lookback: The Popeye Powell Effect 8-23-25
Mini Market Lookback: Rising Inflation, Steady Low Growth? 8-16-25
Industrial Production July 2025: Capacity Utilization 8-15-25
Retail Sales Jul25: Cautious Optimism in the Aisles 8-15-25
CPI July 2025: Slow Erosion of Purchasing Power 8-12-25
Mini Market Lookback: Ghosts of Economics Past 8-9-25
Macro Menu: There is More Than “Recession” to Consider 8-5-25
Mini Market Lookback: Welcome To the New World of Data 8-2-25