Employment August 2025: Payroll Flight
Another bad month for payroll helps the FOMC see that the dual mandate is back on the front burner with the heat rising.
Round up the usual BLS suspects!
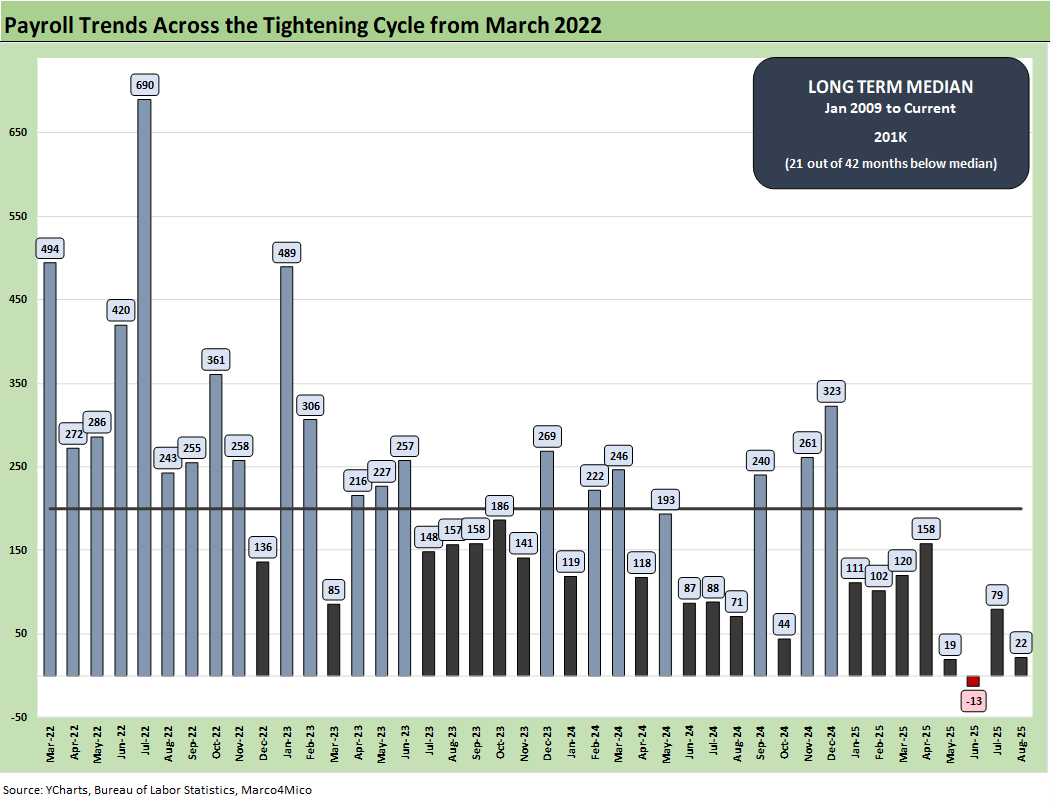
After the July report showed material weakness, August brought an even weaker rolling 4 months with 22K job adds total for August. The revisions even sent June into the first negative month (-13K) since Trump 1.0. That brings the rolling 4 months average to under 30K (see Employment July 2025: Negative Revisions Make a Statement 8-1-25 and Employment Cost Index 2Q25: Labor in Quiet Mode 7-31-25).
Last month’s July reaction brought a Trump tantrum and attack on the BLS and sacking of the “stat head.” That has not stopped economic reality from rolling into the numbers again from JOLTS to today’s Nonfarm Payroll (see JOLTS July 2025: Job Market Softening, Not Retrenching 9-3-25 ). We wonder if Trump is now set to fire the economy for working against his story line of the “greatest 8 months in Presidential history (see Happiness is Doing Your Own Report Card 8-1-25).
We get into the occupational line item deltas in a separate commentary, but there has been a lot of chatter during the week on potential weakness in health care line items. Health care is 18% of GDP and has been a key driver of jobs across the cycle on demographics and needs. The Medicaid and Medicare fears have raised some alarms for the trend line ahead – whether budgets or personnel.
The uptick to a 4.3% unemployment rate in August (from 4.2% in July) from the Household Survey comes after a +148K increase in the total unemployed to 7.38 million, up from the 7.01million unemployed in June and 7.24 million in July. The civilian labor force rose by 436K to 170.78 million and the participation rate rose by +0.1% to 62.3%. The 4.3% unemployment rate (7,384K/170,778K = 4.3%) is still strong in historical context and in a narrow range. The total employed in the labor force rose by 288K to 163.4 million. The U-6 notably saw 2 ticks higher in August to 8.1% after also rising 2 ticks in July to 7.9%. That U-6 trend is a bad sign.
With all the conflicting political agendas and creative mix of facts and fiction on how tariffs work in immediate context (buyer writes the check to customs) and what the tariffs might bring over a longer time horizon, troubling reports and market color such as what we saw in the ISM Manufacturing report and Beige Book this past week make the job weakness unsurprising. Just a minimal amount of time reading though small business trade publications and anecdotes (Chamber of Commerce, National Association of Manufacturers, etc.) make it clear that many private sector companies are rooting for SCOTUS to back up the 7-4 Appeals Court ruling on IEEPA (see Mini Market Lookback: Tariffs Back on Front Burner 8-30-25).
The White House is working hard to put some backspin on the tariff opposition with their Mad Max scenarios. Many much stronger US economies are recent memories without the tariff excess (see Presidential GDP Dance Off: Clinton vs. Trump 7-27-24, Presidential GDP Dance Off: Reagan vs. Trump 7-27-24). For those keeping score at home, Reagan hated tariffs and Clinton legislated NAFTA in 1993 (bipartisan vote) after George HW Bush signed it in 1992. Those economies crushed Trump 1.0 (and Biden’s single term) and likely will have the same comparison to Trump 2.0.
The above chart plots the payroll additions since the tightening cycle began in March 2022. May and June 2025 set new lows and August came in weak. We look at some more line item history in our review of occupational deltas (to be posted later), but this is the worst rolling 4-month average since COVID (see Employment Across the Presidents 8-15-23, Payroll % Additions: Carter vs. Trump vs. Biden…just for fun 1-8-25) and the credit crisis before that.
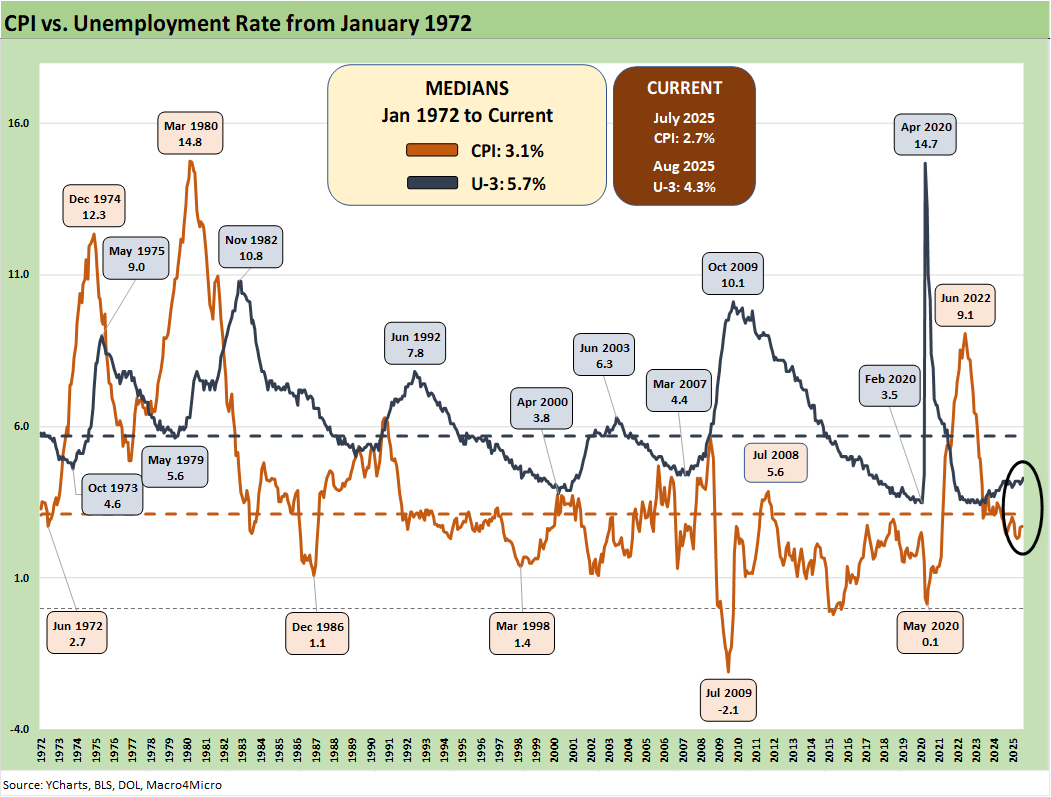
For many of us, the top 3 variables used in grading an economic record are GDP growth (the tailwinds or headwinds for payroll decisions, employment and consumer confidence, capex planning, equity market performance, etc.), unemployment rates (salary/wage totals), and inflation (rare events across the cycles with Ford, Carter, and Biden the main victims.
For now, the underlying GDP growth drivers such as PCE (consumer) and GPDI (investment) are weak and now payroll is flagging in Trump 2.0 (see 2Q25 GDP: Second Estimate, Updated Distortion Lines 8-28-25). Inflation is low but remains above target, and the next move in consumer purchasing power could tie into the IEEPA SCOTUS decision (see The Curve: Risk Tradeoff - Tariffs vs. UST Supply 9-1-25, PCE July 2025: Prices, Income and Outlays 8-29-25).
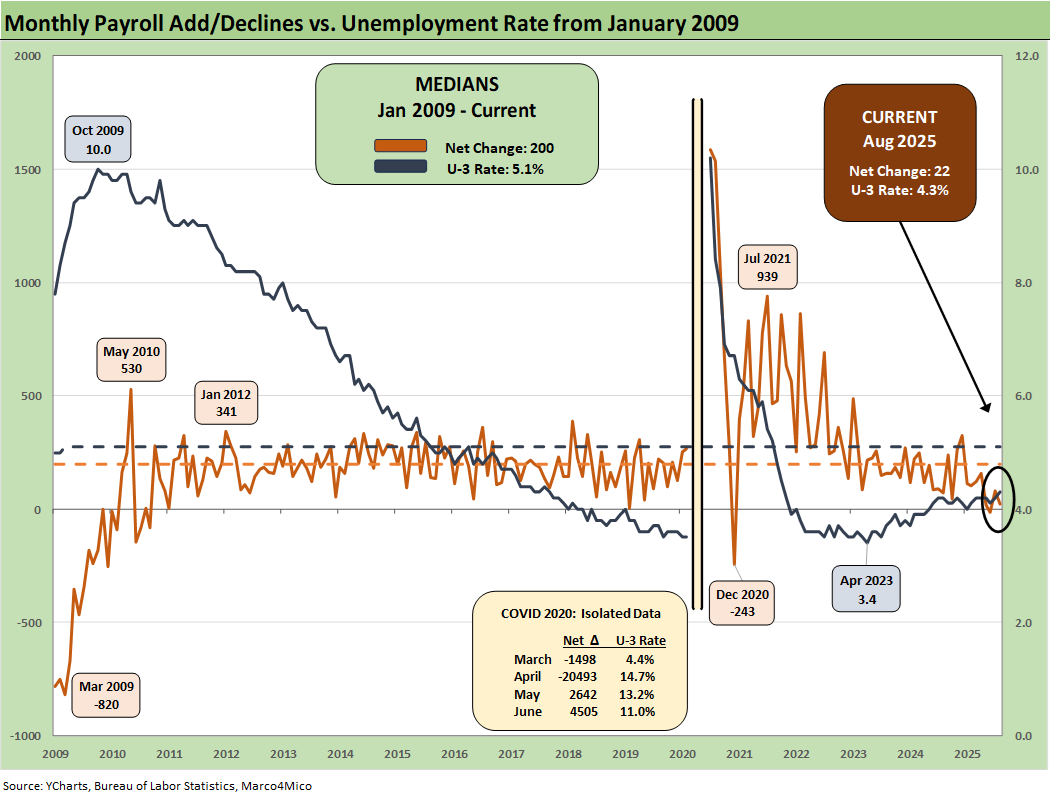
The above chart plots the running job adds/declines since Jan 2009 against the unemployment rate, which ticked higher to 4.3% from 4.2% MoM. We isolate the worst months of the COVID dislocations in the above box for better visuals to capture the other periods.
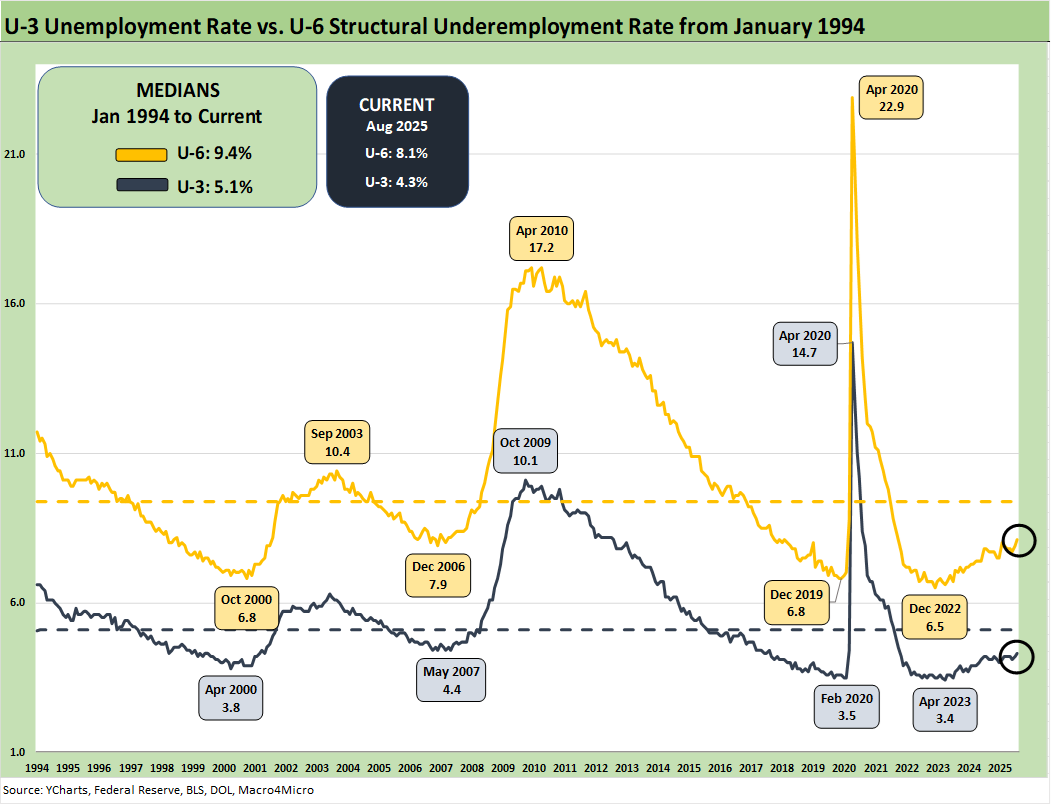
The above chart updates the time series for the U-3 unemployment rate and U-6 structural underemployment rate across the years from 1994. The current U-3 rate ticked higher to +4.3%. As a reminder, the U-6 metric is defined with the numerator as “total unemployed + persons marginally attached to the labor force + total employed part time for economic reasons.” The denominator is “civilian labor force + workers marginally attached to the labor force.”
The U-6 rose to 8.1% from 7.9% in July and 7.7% in June. The U-6 rose sharply in Feb 2025 to 8.0% from 7.5% in Jan 2025. The current 8.1% is well above the 6% handles seen in spring of 2023. The U-6 is also up from the 7.8% level of last year during August 2024. The 8.1% U-6 is below the median from 1994 of +9.4%. That 9.4% includes the post-crisis shock and the longest recession since the Great Depression.
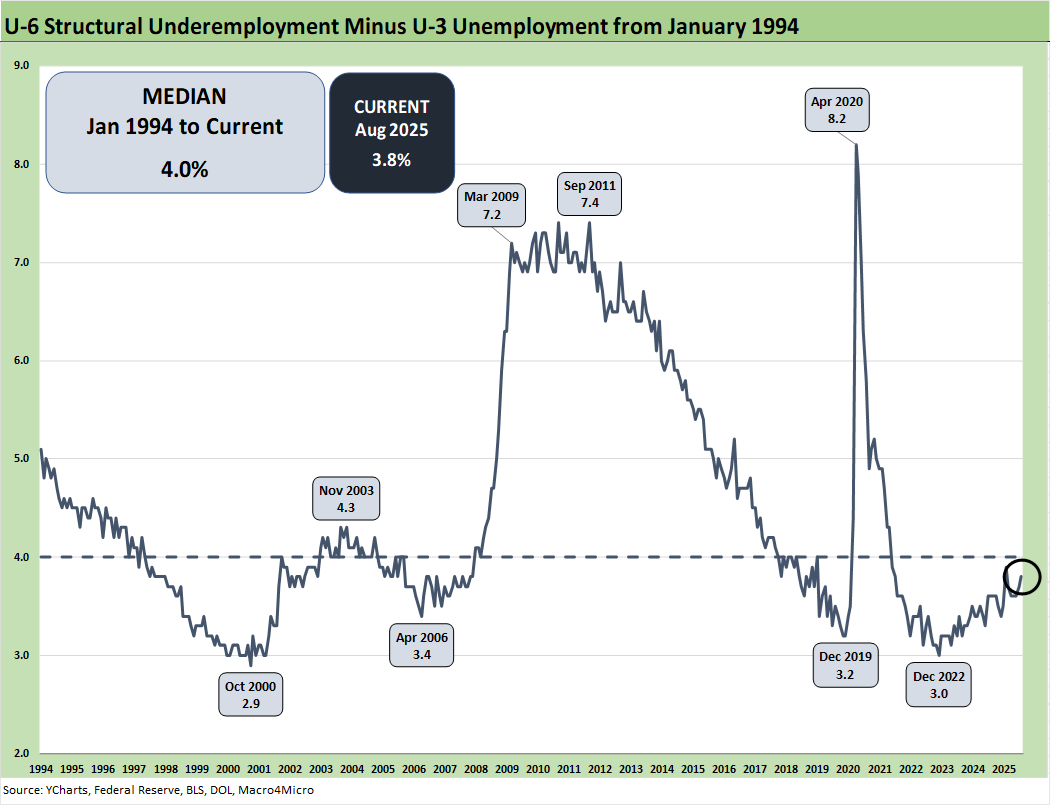
The time series above updates the U-6 minus U-3 differential as a measure of relative employment quality and to flag risks of major dislocations in large swaths of the economy (think oil patch in the late 1980s, tech bubble imploding 2001-2003, financial services and automotive in 2009).
The current 3.8% differential is modestly below the long-term median of 4.0%. The job ranks are weakening now but are also in a mixed period where tariffs are still getting worked out with trade partners and the courts. Many questions will get answers over the rolling forward period into 2026 with respect to how tariffs will flow into working capital cycles and new capacity planning.
Some of the risk issues get swept up in immigration and deportation numbers, but the analysis always comes back to the number of workers with paychecks. Employers will be making decisions to mitigate the tariff damage if they are not passing along the cost in prices or want to limit the scale of the price increase to customers. There is no hiding from the need for economic reactions along the supplier to customer ecosystem. Someone pays – including for some their employment in tariff cost mitigation decisions.
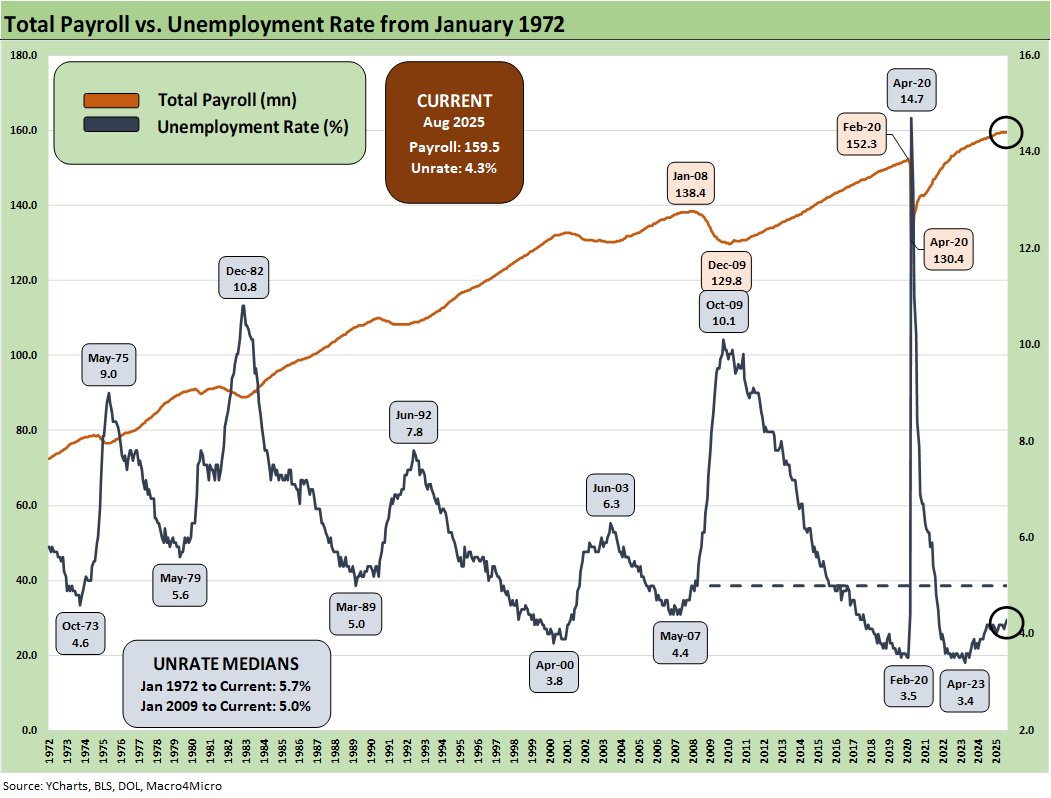
The above chart updates total payroll vs. the unemployment rate. More bodies with more paychecks is always a good thing. The trick from here is how the consumer deploys that paycheck.
We saw better trends in consumer income and consumption in the July PCE release (see PCE July 2025: Prices, Income and Outlays 8-29-25). That said, the consumer sector still has to be seen as weaker in 2025. Further, the 2Q25 GDP growth numbers failed to inspire in the consumer metric despite some upward revisions (see 2Q25 GDP: Second Estimate, Updated Distortion Lines 8-28-25). That followed more pronounced weakness in 1Q25 GDP (see 1Q25 GDP: Final Estimate, Consumer Fade 6-26-25).
Soft survey numbers for consumers remain an area of focus even if they have climbed off the bottom and eased after the worst of the post-Liberation Day nerves and China trade worries. The consumer still has ample reason to get defensive and push saving rates higher than what we saw in the monthly PCE numbers.
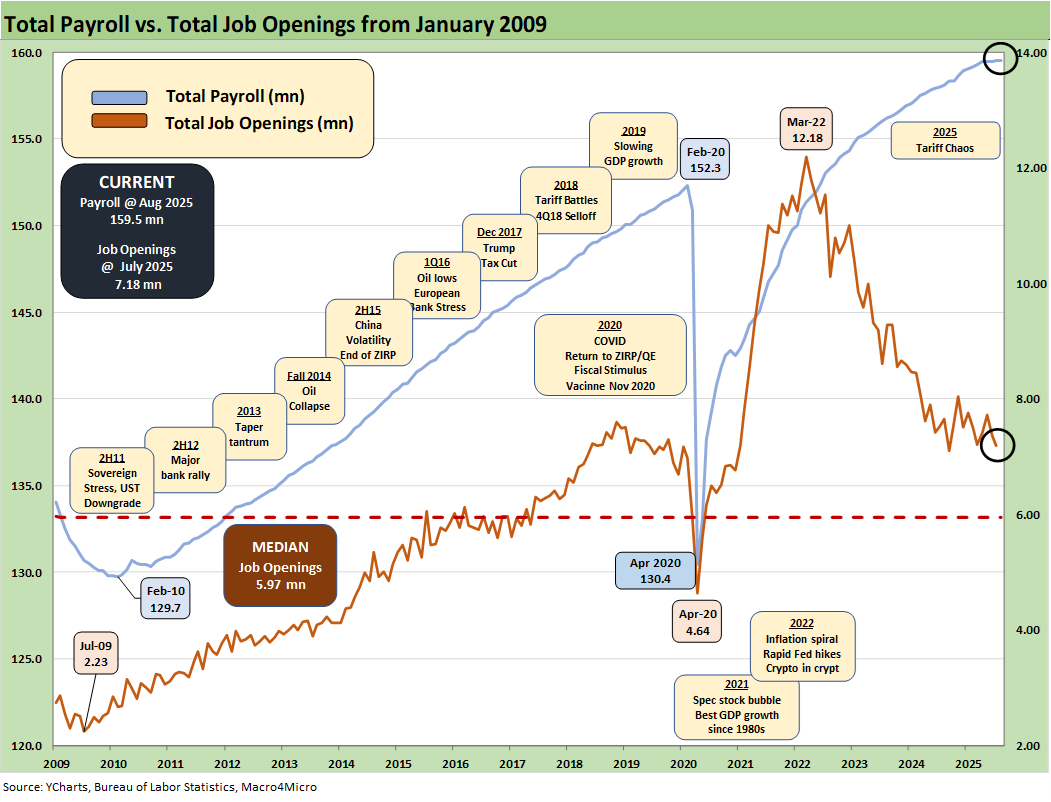
The above chart updates the total payroll number vs. job openings. The most recent JOLTS number was notably weaker in openings and the “hires vs. fires” balance was worse (see JOLTS July 2025: Job Market Softening, Not Retrenching 9-3-25).
The management teams have a lot of moving parts to factor into guidance whether quantitative or qualitative and now legal IEEPA questions. The color in the trade literature and in economic releases such as the Beige Book that drill down into the weeds are clearly signaling the tariffs are a major problem. For some (notably retail and many small businesses), the threat can be existential. The cash drain in “writing the tariff check” and the hit to earnings from the expense line can impair trade credit and fuel bank credit problems for small businesses that are the backbone of payroll counts in the US. The payroll impact is already showing up.
Recent inflation reports have generally brought good news relative to expectations given the scale of the forward threat and lagging effects to be seen across working capital cycles. That said, the inflation creep by product groups is clearly showing up in the data with more to come.
The process moves slower than the demands for immediate gratification and instant resolution of the debate. Working capital turns, order rates, delivery, movement along the supplier chain contracts, and even the phase-in of tariffs itself all take time. That said, there are a lot more coming. If the IEEPA SCOTUS decision goes the wrong way for Team Trump, more trade partners might dig in their heels and find their courage if he loses his blank check threat power he decided IEEPA allows him to deploy.
If there was no tariff threat, the FOMC would be easing more rapidly. The most recent FOMC meeting saw the Gang of 19 again raise median PCE inflation forecasts for 2025. We are curious to see how the next round of forecasts play out. The forecasts are under pressure from Trump, and any senior Fed player has to worry that Bill Pulte is hiding in their bushes or peeking in their window.
Trump complains, but he still does not even admit that the buyer writes the tariff check. Even with this recent news, he still paints the picture of “seller pays.” He occasionally implies the buyer bears more of the cost (which is separate from “who writes the check”), but then he defaults to the theme of collecting “hundreds of billions” from selling countries in Trump 1.0. One of his favorite terms is “taking in money” when he means transferring money from US buyers.
The 4.3% U-3 is in line with metrics that in the 1990s would have been called full employment. Being competitive in U-3 levels with the 1990s is a good thing, but we expect unemployment to keep rising across 2H25 as tariffs continue to elicit reactions and small businesses continue to suffer. The 1990s decade was actually the greatest economy in postwar US history with 7 years of NAFTA. The 1980s and 1990s crush the numbers of the post-2000 Presidents.
The slower-growth GDP of the new millennium gets into the broader discussions of how high sovereign systemic debt can undermine growth and how the post-2000 years have been a case study in rising US sovereign leverage. Despite tariffs, those sovereign metrics numbers will be worse by 2028 and worse again in 2032.
See also:
JOLTS July 2025: Job Market Softening, Not Retrenching 9-3-25
Hertz Update: Viable Balance Sheet a Long Way Off 9-3-25
Credit Markets: Will the Heat Matter? 9-1-25
The Curve: Risk Tradeoff - Tariffs vs. UST Supply 9-1-25
Footnotes & Flashbacks: Asset Returns 8-31-25
Mini Market Lookback: Tariffs Back on Front Burner 8-30-25
PCE July 2025: Prices, Income and Outlays 8-29-25
2Q25 GDP: Second Estimate, Updated Distortion Lines 8-28-25
Avis Update: Peak Travel Season is Here 8-27-25
Durable Goods July 2025: Signs of Underlying Stability 8-26-25
Toll Brothers Update: The Million Dollar Club Rolls On 8-26-25
New Home Sales July 2025: Next Leg of the Fed Relay? 8-25-25
The Curve: Powell’s Relief Pitch 8-24-25
Mini Market Lookback: The Popeye Powell Effect 8-23-25
Existing Home Sales July 2025: Rays of Hope Brighter on Rates? 8-21-25
Home Starts July 2025: Favorable Growth YoY Driven by South 8-19-25
Herc Holdings Update: Playing Catchup 8-17-25
Mini Market Lookback: Rising Inflation, Steady Low Growth? 8-16-25
Industrial Production July 2025: Capacity Utilization 8-15-25
Retail Sales Jul25: Cautious Optimism in the Aisles 8-15-25
PPI: A Snapshot of the Moving Parts 8-14-25
CPI July 2025: Slow Erosion of Purchasing Power 8-12-25
Iron Mountain Update: Records ‘R’ Us 8-11-25
Mini Market Lookback: Ghosts of Economics Past 8-9-25
Macro Menu: There is More Than “Recession” to Consider 8-5-25
Mini Market Lookback: Welcome To the New World of Data 8-2-25
Happiness is Doing Your Own Report Card 8-1-25
Payrolls July 2025: Into the Occupation Weeds 8-1-25
Employment July 2025: Negative Revisions Make a Statement 8-1-25


