
The Curve: FOMC Balancing Act 9-14-25
Decision time for the FOMC, but the real action will be in the commentary on tariffs and mix of forecasts.


The FOMC needs to do a balancing act with labor teetering, divergent legal pathways to navigate on tariffs (IEEPA appeal to SCOTUS), and inflation still well north of target (see Mini Market Lookback: Ugly Week in America, Mild in Markets 9-13-25).
The CPI and PPI details this week handed the market and Fed enough data points to turn attention back to labor weakness and the full employment mandate. The CPI data clearly shows some tariff impacts along select product lines in the sequential MoM moves (CPI August 2025: Slow Burn or Fleeting Adjustment? 9-11-25, PPI Aug 2025: For my next trick… 9-10-25).
We also saw some modest incremental weakness in Consumer Sentiment and inflation expectations. We get updates on Retail Sales, Industrial Production and Housing Starts this week for some additional color that flows into recession handicapping.
We update the 2Y to 30Y UST slope history this week as the long bond teed up a rare rally.
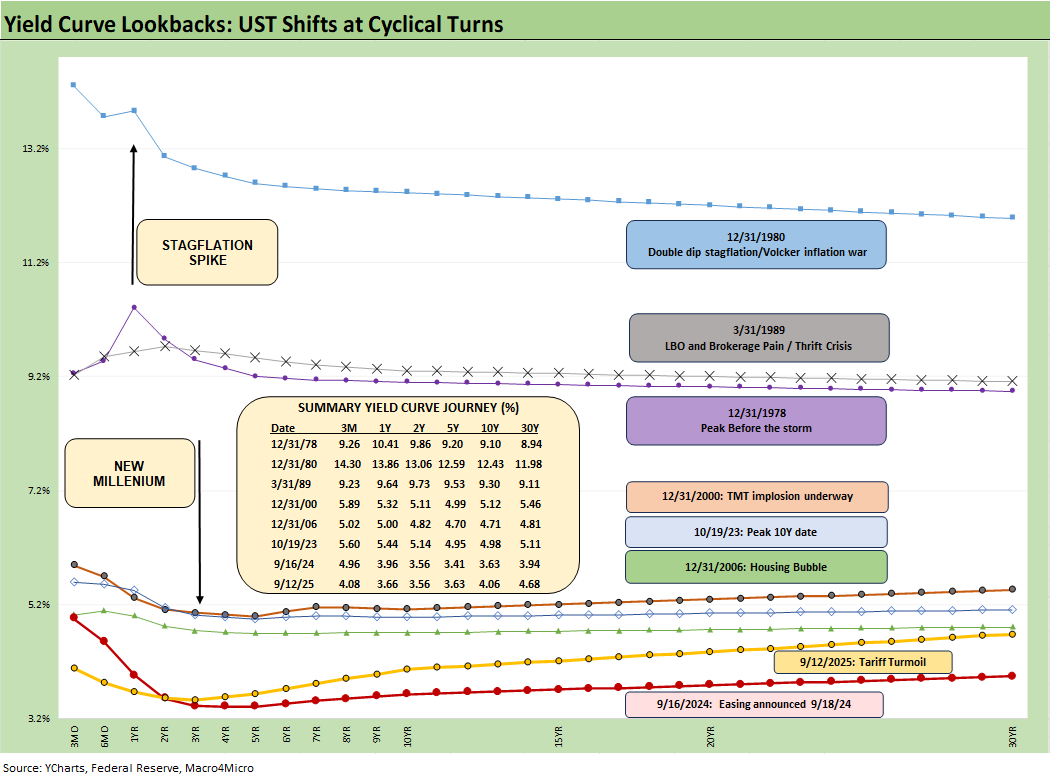
The above chart helps give historical context to the level and shape of the current yield curve vs. a range of market backdrops. The curves are plotted across some historical economic expansions and in some cases pending turns in the monetary cycle. They are worth pondering for compare-and-contrast as they marked key transition points in economic cycles and market risk backdrops that included dulled risk senses and occasional valuation excess (notably 1989, 2000, 2006).
Last week saw headline CPI come in hotter than expected MoM and a YoY increase from 2.7% to 2.9% as anticipated. Piling on, initial claims surprised the markets with the highest weekly number (+27K to 263K) since Oct 2021 (268K). These numbers lend further support to a Fed easing in Sept of -25 bps (CME FedWatch over 96%) with some calling for 50 bps. October odds are now up to 81% for -25 bps and 76% for December at -25 bps.
With the FOMC approaching some major decision points, the next SEP report and Dot Plot will get serious scrutiny for forecast revisions since the last report. The stagflation debate is still in gear with a big X factor in the pending SCOTUS decision on the legality of Trump’s IEEPA strategy. The last time a stagflation threat had to be considered was in the Carter inversion of 1978 above. The stagflation threat then showed up in force by the Dec 1980 curve after a peak Misery Index of 22% in June 1980 when I first parachuted into NYC for a job.
Today’s rates are low in historical context…
We like to remind ourselves and readers how low UST rates are today, so the demand for cuts still needs the context of what could go wrong with a tariff program without precedent in the modern capital markets. With labor softening, the potential for very low growth and higher inflation means stagflation could still show up for the first time since Volcker. That Volcker stagflation was in a different hemisphere than even current worst case scenarios.
Worth highlighting from the above chart is that the current 3M UST is notably lower than the pre-crisis, pre-ZIRP 3M UST levels. Handicapping where corporate sector and household confidence levels will be heading into 2026 is a much more challenging exercise. That is a lot like investor confidence and fear of risk aversion. Right now, the market shows very little risk aversion as evident in record highs in equities and very tight credit spreads that are near past cyclical lows and dramatically inside long-term medians.
In the multicycle timeline in the chart, the worst of the policy miscues across the Carter years played out with the inversion of 1978 flowing into the high inflation backdrop of 1979 (Iranian Oil Crisis gets an assist along with a lot of industry deregulation). That brought the Volcker years and massive tightening policies.
The experience of stagflation after the muted Fed response during the mid to late 1970s in the face of inflation threats became a matter of religion for the Fed. The Volcker victory in the inflation war followed, but it was an ugly war. That 1980s period was helped by an oil market crash that bottomed during 1986 and was a key driver of 1% CPI. The1980s bull markets saw a credit cycle peak in 1989 (note the 9.2% 3M UST).
The next leg of the monetary journey…
Another useful period to ponder is the TMT cycle faltering in 2000 (on the way to a massive Greenspan easing in 2001). The current cyclical tech boom and valuations cannot escape looking back at the late 1990s. That period offers another case study in excess in equity and credit markets with the peak in 1999 (credit) and NASDAQ (2000). The risk selloff soon led to excessive easing by Greenspan in 2001 and then into early 2004, in turn setting the table for the housing bubble peak in 2006. During the 2004 to 2007 period, leveraged derivative exposure and structured credit was out of control and counterparty risk was soaring.
The chart then jumps from 2006 to 2023, which takes the market beyond the crisis period and the ZIRP years and COVID. Both the post-credit crisis period and later COVID crisis prompted the Fed to deliver a wave of market liquidity support and confidence building programs that helped save the capital markets, reopened the credit markets, reduced refinancing risk anxiety, and mitigated the contingent liquidity risk profile of the banks.
The credit crisis period from late 2008 to the 2020 COVID crisis period brought plenty of QE and normalization distortions to the yield curve shape. The Fed’s dual mandate made that possible.
The market could soon face new legislative threats to the Fed in 2026 that seek to reel in the dual mandate. That is based on commentary from Bessent and mirror plans discussed in Project 2025 (See Chapter 24). That will be a topic to tackle as we get closer to those ideas coming into play.
There are a lot of “What if?” scenarios that raise major structural risk and contingency planning fears if the Fed becomes a captive policy instrument of Team Trump. We got a taste with tariffs. The ability of the Fed to be creative saved the banking system and credit markets in 2008-2009 and then saved the credit markets again in 2020. Some of the Washington crowd simply do not understand it and many do not want to admit as they seek the wrest control of monetary policy for maximum executive branch power.
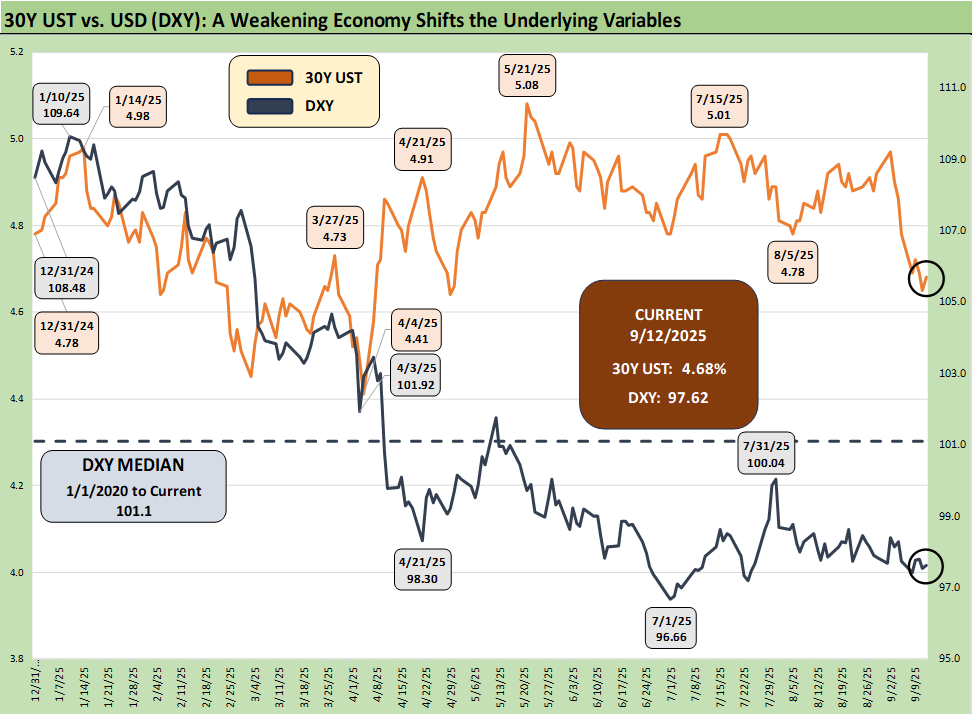
The above chart plots the recent trends in the 30Y UST vs. the dollar index (DXY) as the US dollar weakness throws another risk variable into the picture and poses a major risk factor for non-US buyers of UST.
This week saw further declines on the long end of the UST curve and especially 30Y as the mix of CPI and PPI numbers seemed to be overshadowed by the initial claims spike that was the highest since late 2021. The US needs to attract record demand offshore to buy a record supply of UST, so the dollar matters.
Lower rates could be a catalyst for dollar weakness while political risk factors and governance quality are no longer non-factors in the US sovereign credit quality assessment. Record forward-looking deficits and the optics of political instability (military occupation of major cities by an authoritarian-leaning, confrontational leader) adds a negative element to the sovereign risk profile of the US that no rating agency would have the courage to flag.
We have seen more commentary in the market around the US having some common characteristics with emerging market sovereign credit analysis. This past week did not help given the “us vs. them” mentality in Washington that exploit tragedies (political violence). On a brighter note, Trump moved away from his imminent threat to engage in a war on Chicago (that Apocalypse Now social media move will make the history books). Trump is looking to Memphis TN, where the Mayor learned about the move on TV. Defying state and local leadership with military deployments is not remotely normal.
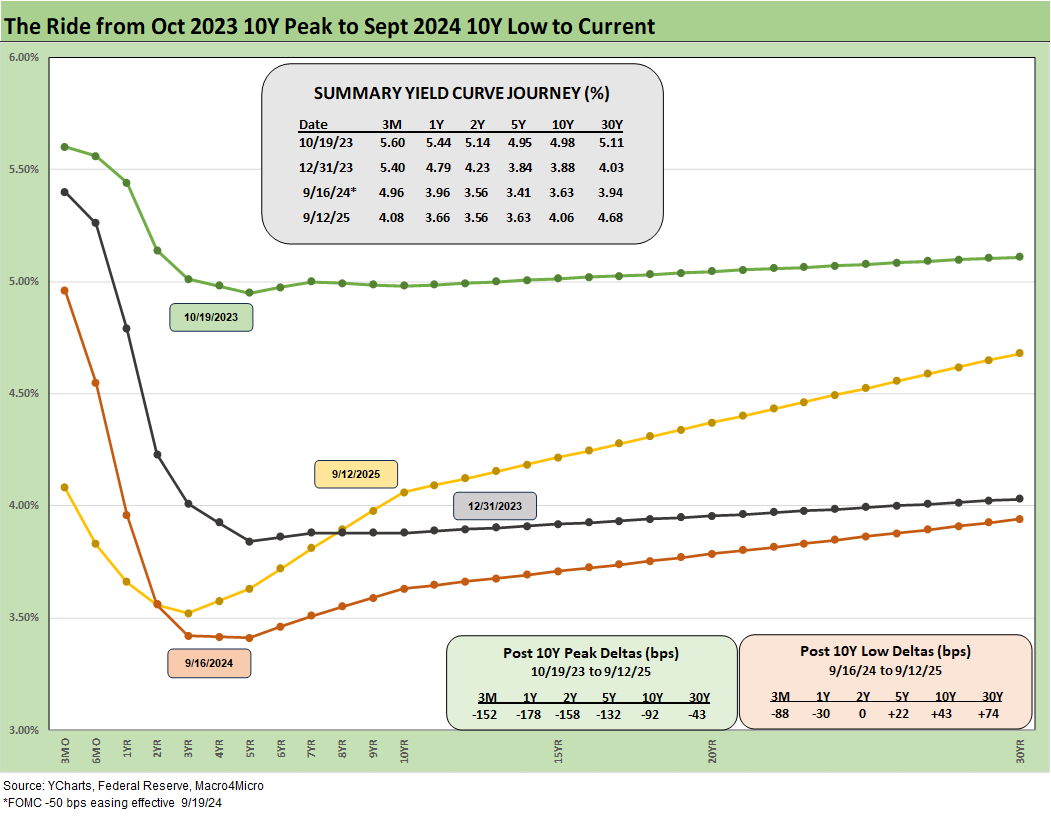
The above chart frames today’s rates amid the wild ride from the Oct 2023 peak (10Y UST) down across the bull flattener into year-end 2023 and then into the easing actions and rally of Sept 2024. Then came the ensuing bear steepener that is evident in the journey to Sept 2025. We break out some numerical UST deltas in the box.
This chart reminds us that the “ease and flatten” shapeshifting is hard to rely on in a market where the supply-demand of UST is tenuous and tariff impacts are hard to predict.
That economic chain reaction from tariff impacts the expense side for companies and how companies react (hiring freeze? layoffs?). There is often a tendency to just debate the price impact on goods and inflation issues, but the guaranteed cost impact (buyers pay the cash tariff to customs even if Trump will not admit it) is also an economic event that begs a reaction in profit margins or in expense reduction elsewhere (note recent jobs numbers). Planned job adds can be shelved and/or headcount reduction is a natural response. The anecdotes are piling up across various trade groups.
Fed easing and the flattener vs. steepener debate…
There was a lot of bear steepener action from the end of 2023 into the summer of 2024 and fresh bouts of the same after the big rally in the fall of 2024. The Sept 2024 easing gyrations will make it hard to take much for granted this time after Sept 2025 with much higher, sweeping tariff policies and an ongoing debate over a cyclical slowing in the mix of variables.
The opportunity to move quickly on transactions (existing or new) in housing will be interesting to watch. The optimism on rates and the pessimism on job security is an old-school dilemma. We get housing starts this week and existing home sales next week, but the impacts will come at a lag for the Sept numbers.
The tariff court action tied to the IEEPA appeal to SCOTUS could change the market handicapping on UST steepener risk. One concern is that there will be a higher supply of UST to deal with the massive deficit. That is framed against lower “tax revenue” from tariffs if Trump’s IEEPA appeal loses.
Of course, the tariff advocates don’t want to call tariffs a “tax” as they did as part of the initial GOP House plan back in 2017 (“border adjustment tax”). In the IEEPA case, there could be a need to give a very large refund as Bessent discussed last week, which would further add to UST issuance.
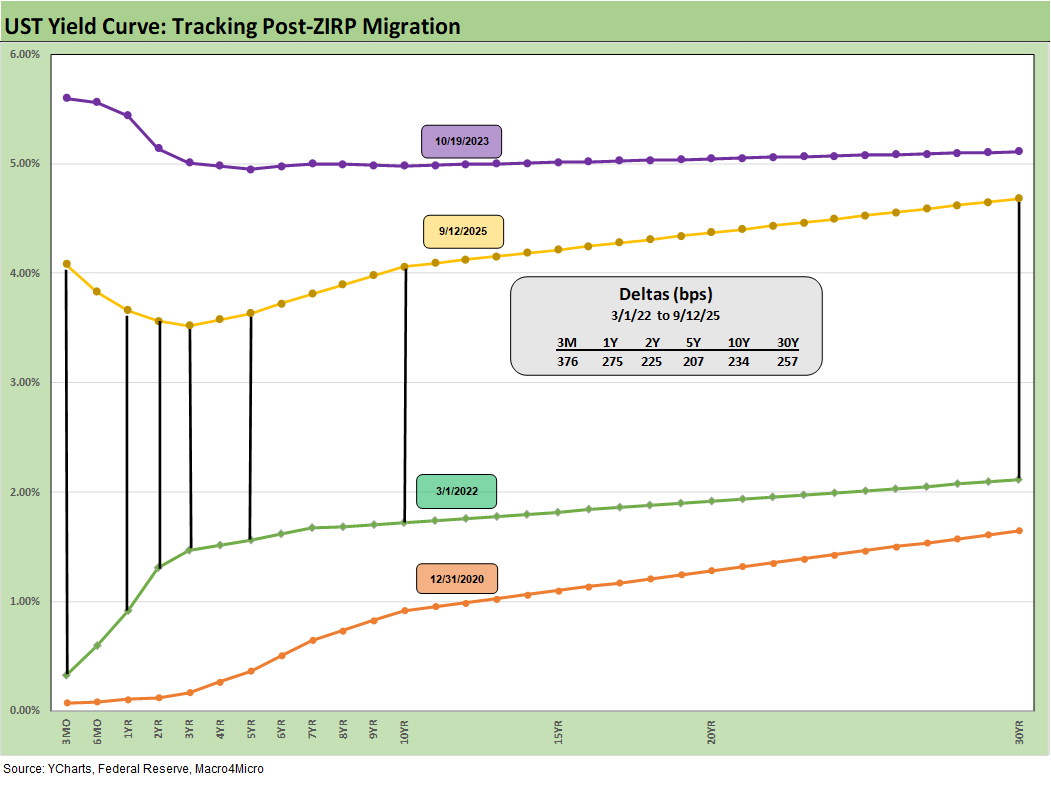
We drop in the above chart to frame the UST deltas since March 2022 when ZIRP ended and the tightening cycle began. It offers a reminder that we had a major move out to Oct 2023 and a smaller move to Sept 2025 from Sept 2024 (see prior chart for Sept 2024).
The past year kept the long duration UST ETF (TLT) under pressure for much of the year even with the positive YTD 2025 performance for bonds. Recent negative employment numbers, including significant downward revisions back to Spring, are now again rewarding duration. The long-duration UST ETF (TLT) posted negative returns looking back 1 year but is now positive on a YTD basis (see Footnotes & Flashbacks: Asset Returns 9-14-25).
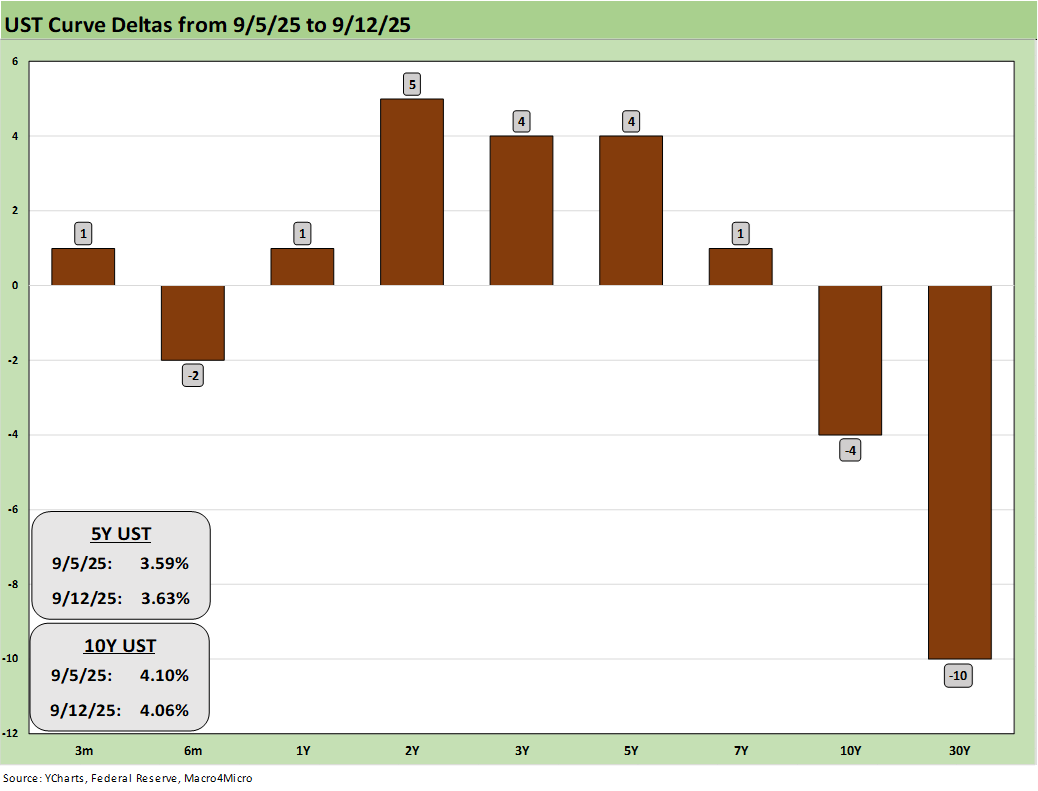
The above chart plots the 1-week UST deltas. This week showed a strange pattern relative to recent moves with the 2Y UST higher and the 10Y and 30Y UST lower. The move tighter on the long end has not been a frequent development as investors debate whether labor weakness and cyclical pressure will drive the long end. Meanwhile, on the short end, the “predictability” in easing perhaps diminished hope for a -50 bps in Sept or in October.
If a relatively steady economic backdrop remains in place with lower tariff risk, the steepening risk will in theory diminish if paired with a slower economy. The FOMC could have less inflation anxiety to factor into decisions, but the market will face a bigger deficit number to contend with on UST supply fears. As always, the Fed controls the short end and the market controls the long end.
If SCOTUS holds true to form, “the “Supremes” will back Trump’s play using IEEPA and give him tariff power unchecked by legislative checks and balances. The inflation impacts on prices and costs could then still be substantial. If IEEPA gets struck down, the Section 232 and Section 301 game plan is the go-to strategy again and possible legislation from more House and Senate GOP support. The Corker and Toomey types in the Senate are gone. The Senate is now a lapdog kennel.
We will see record high postwar tariffs regardless. The trade-off is pricing pressures on goods into 2026 vs. cyclical pressures tied to employment, consumer spending, potential export weakness and weaker investment as seen back in 2019 – only worse (reminder: 2H19 saw the FOMC ease in support). The much-hyped reshoring and manufacturing investment boom will need clarity on tariffs and trade to properly assess project economics. Those are not here yet. Jobs are in fact declining in manufacturing and in durables.
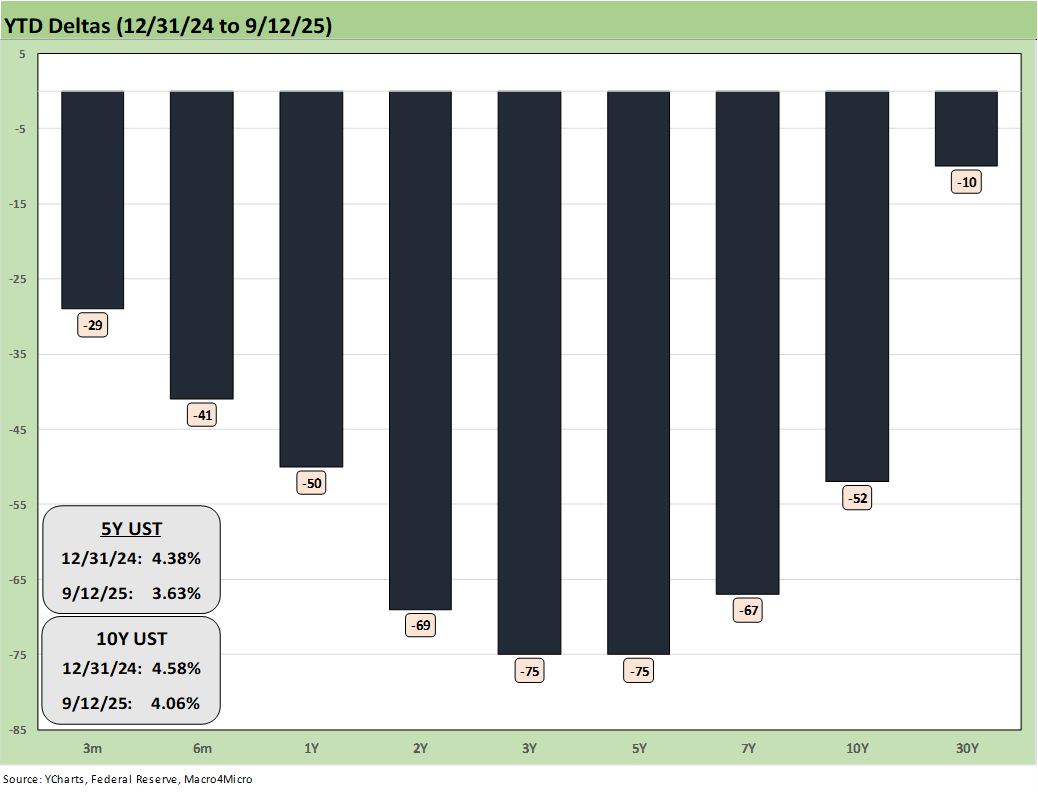
The YTD UST yield curve deltas are broken out above. The bull steepener pattern has rewarded bonds, but the long end has been more stubborn. This week saw more bullish action on the 30Y UST.
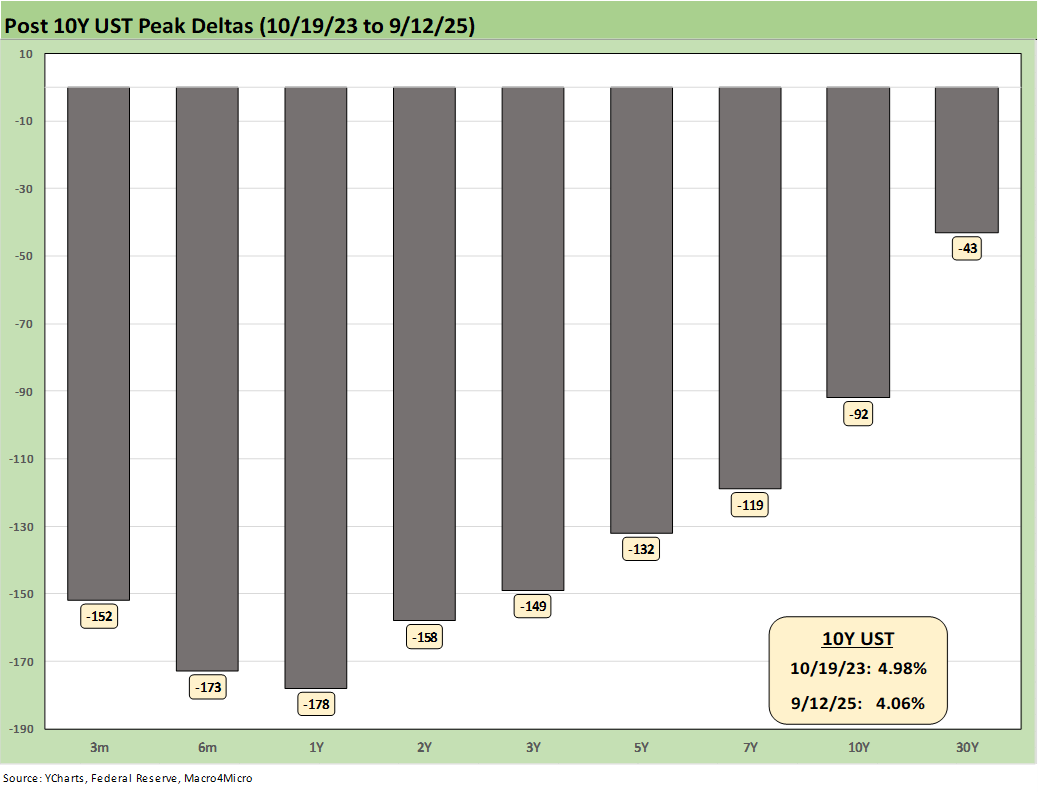
The above chart updates the running UST deltas from 10-19-23 through Friday. At the very least, it offers a reminder of what could go wrong if we get adverse inflation outcomes from tariffs. The politics of inflation have always been a death knell. If jobs stay weak and inflation numbers get uglier, there is every reason to expect intervention by the White House in the data delivery as we saw after weak July payrolls (see Happiness is Doing Your Own Report Card 8-1-25).
CPI and PPI this past week showed some mild inflation pressure with plenty of examples of sequential climbs in prices as detailed in our CPI review. That was notably evident along some Food lines, which is always a worry in politics. In contrast, the PPI surprised the market with minimal sequential pressure and even posted some negative lines (see CPI August 2025: Slow Burn or Fleeting Adjustment? 9-11-25.PPI Aug 2025: For my next trick… 9-10-25).
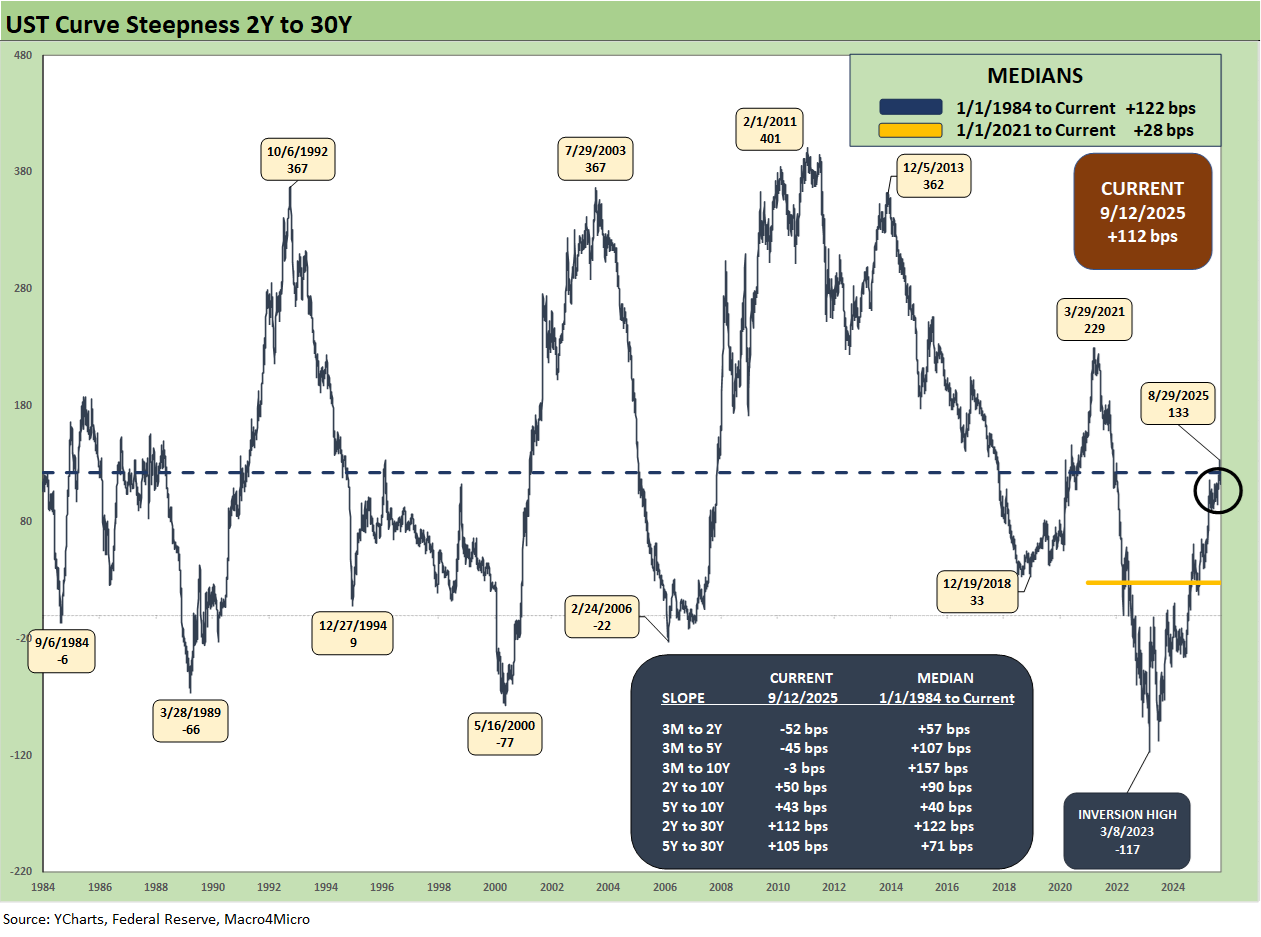
The above chart plots the 2Y to 30Y slope from 1984 for a read on the current upward sloping UST curve. The current slope of +112 bps is modestly below the long-term median, which is upward sloping at +122 bps. On Aug 29, the 2Y to 30Y peaked at +133 bps before reversing course the following week on further negative employment reports.
We see a peak inversion in Mar 2023 of -117 bps after the 2Y to 30Y had hit a slope of +229 bps in March 2021 when the macro picture was bouncing off COVID in a ZIRP market. The imbalance of supply and demand for goods was flowing into inflation, but there were enough COVID fears flying around that the FOMC did not get busy for another year (March 2022).
We also include a box within the chart that details the other UST curve segment slopes that we watch along with the long-term medians. The front-end inversion from 3M is still the most anomalous part of the curve when you consider the fact we have been in an economic expansion (now slowing in 2025) with PCE inflation inside the 3.0% line (see PCE July 2025: Prices, Income and Outlays 8-29-25). The 3M to 2Y UST inversion of -52 bps is starkly different from the post-1984 historical median of +57 bps. The 3M to 5Y inversion of -45 bps is a long walk from the +107 bps median.
The challenge for the FOMC has been heavily about tariffs. Trump has been moving the US into a set of tariff policies never tried in the modern capital markets in a highly globalized economy with extensive global supplier chain ties. There will still be a lot of new ground to cover to understand the structural effects ahead, but the latest court decision on IEEPA would completely change the math, the trade partner deal dynamics that are ongoing (China, Canada, Mexico) and many of the later targets of reciprocals (e.g. Brazil, low-cost Asian countries).
Trump’s promises of lower prices conflict directly with his economic policies. And that is showing up in the numbers. In such a case, the go-to plan is to attack the numbers. Realities at sea level will still be driven by the dismal science of economics. Political artistry of disinformation is for decision-makers to sort out.
See also:
Footnotes & Flashbacks: Asset Returns 9-14-25
Mini Market Lookback: Ugly Week in America, Mild in Markets 9-13-25
CPI August 2025: Slow Burn or Fleeting Adjustment? 9-11-25
PPI Aug 2025: For my next trick… 9-10-25
Credit Markets: Spread Risk Lurks, but the World Waits 9-8-25
The Curve: The Road to Easing has been Long. 9-8-25
Footnotes and Flashbacks: Asset Returns 9-6-25
Mini Market Lookback: Job Trends Worst Since COVID 9-6-25
Payrolls Aug 2025: Into the Weeds 9-5-25
Employment August 2025: Payroll Flight 9-5-25
JOLTS July 2025: Job Market Softening, Not Retrenching 9-3-25
Hertz Update: Viable Balance Sheet a Long Way Off 9-3-25
The Curve: Risk Tradeoff - Tariffs vs. UST Supply 9-1-25
Mini Market Lookback: Tariffs Back on Front Burner 8-30-25
PCE July 2025: Prices, Income and Outlays 8-29-25
2Q25 GDP: Second Estimate, Updated Distortion Lines 8-28-25
Avis Update: Peak Travel Season is Here 8-27-25
Durable Goods July 2025: Signs of Underlying Stability 8-26-25
Toll Brothers Update: The Million Dollar Club Rolls On 8-26-25
New Home Sales July 2025: Next Leg of the Fed Relay? 8-25-25
The Curve: Powell’s Relief Pitch 8-24-25
Mini Market Lookback: The Popeye Powell Effect 8-23-25
Existing Home Sales July 2025: Rays of Hope Brighter on Rates? 8-21-25
Home Starts July 2025: Favorable Growth YoY Driven by South 8-19-25
Herc Holdings Update: Playing Catchup 8-17-25
Mini Market Lookback: Rising Inflation, Steady Low Growth? 8-16-25
Industrial Production July 2025: Capacity Utilization 8-15-25
Retail Sales Jul25: Cautious Optimism in the Aisles 8-15-25
PPI: A Snapshot of the Moving Parts 8-14-25
CPI July 2025: Slow Erosion of Purchasing Power 8-12-25
Iron Mountain Update: Records ‘R’ Us 8-11-25
Mini Market Lookback: Ghosts of Economics Past 8-9-25
Macro Menu: There is More Than “Recession” to Consider 8-5-25
Mini Market Lookback: Welcome To the New World of Data 8-2-25
Happiness is Doing Your Own Report Card 8-1-25