
KB Home 2Q25: Negative Industry Trends Keep Coming
The wave of volume declines and margin compression is flowing into lower land and development investment.

KB Home (KBH) joins Lennar with a fresh set of numbers from a November fiscal year reporting company (May 31 2Q25), and the news does not get better with lower deliveries (-11.4% for 2Q25), lower revenues (-10.5%), lower unit orders (-13.4%), and lower unit backlog (-23.8%). The cycle is bringing a weak peak season for homebuilders. (see Lennar 2Q25: Bellwether Blues 6-20-25).
KBH guidance for FY 2025 has been trimmed with the 2Q25 release from the 1Q25 numbers showing the upper end of the range lowered by $500 mn for revenue to $6.5 bn, the upper end of range for gross margins from 20% to 19.4%, and the ASP upper range is down by a slight $5K to $490K.
Average selling prices ticked higher in total for 2Q25 to $488.7K from $483K with 2 geographic regions higher and 2 lower as KBH’s lead operating region (the West at 31% of deliveries, 43% of homebuilding revenues) posted an increase in ASP to $682K from $669.6K. KBH makes for an interesting focal point with its higher price mix vs. the public sector peer group and heavy West Coast presence (see Homebuilder Rankings: Volumes, Market Caps, ASPs 5-28-25).
For financial metrics, KBH saw debt leverage move higher while the guidance reinforced the broader trend of gross margin compression and higher SG&A ratios as volumes slide and expenses get tweaked. With KBH guidance, we see more confirmation of builders tapping the brakes on land investment and development outlays.
KBH’s cash flow and liquidity profile remains solid as working capital management takes a turn into a more defensive posture on cyclical softening.
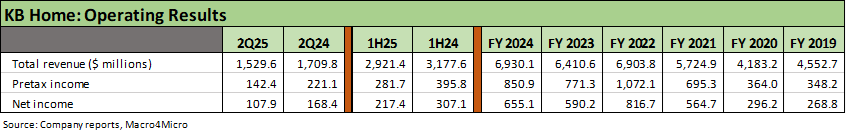
The KBH results are broken out in brief, summarized form above before we dig into the weeds further below. The sharp declines in revenue and earnings for 2Q25 and 1H25 are self-evident and continue the setbacks we have seen across bellwether names. KBH gives us a window on recent trends for the top 10 and has a high West Coast presence. We will get the heavier slate of names in the June quarter earnings reports, but the color from two bellwethers with a May quarter (LEN, KBH) have not been pretty.
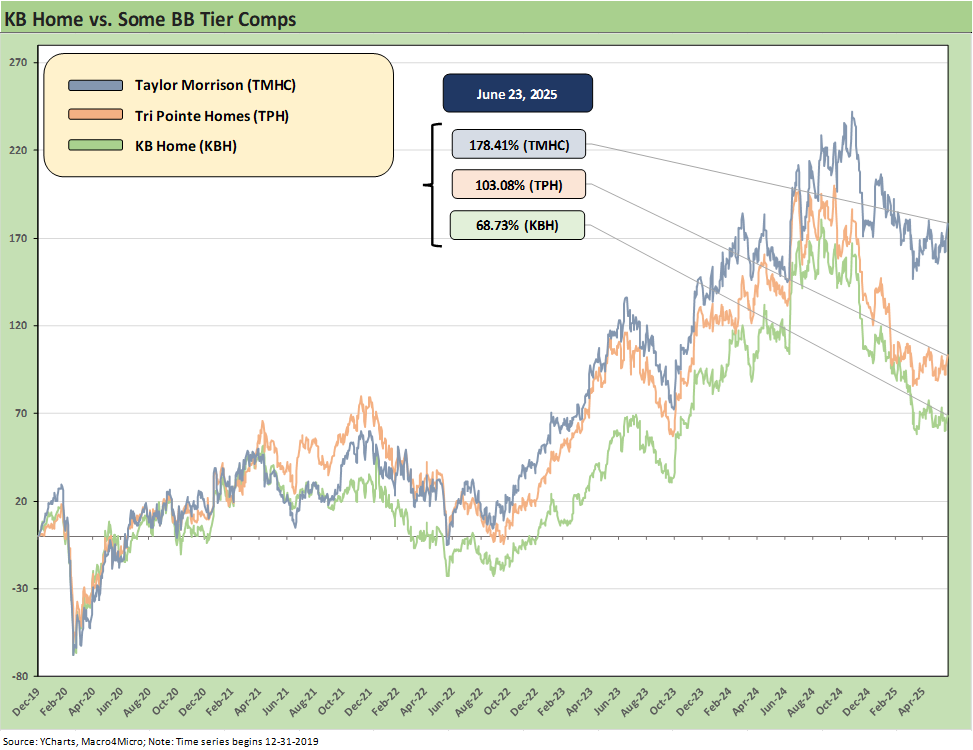
The above chart frames the post-2019 stock performance of KBH vs. Tri Pointe (TPH) and Taylor Morrison Home Corp (TMHC) who all live in the BB credit ratings tier and have major operations in the West. As shown in the chart, KBH has lagged TMHC and TPH across the post-COVID housing cycle.
Below we add to the peer comps and see KBH has also lagged some of the other BB tier names such as Century Communities (CCS) and M/I Homes (MHO) as well as some broader benchmarks recently. Across the LTM period, KBH is 4 off the bottom while TMHC has been a winner vs. peers. Homebuilders broadly have struggled since the end of 3Q24 when they are running near #1 in our benchmark/ETF rankings. The Homebuilder ETF (XHB) was at the top at the end of 3Q24 (see Footnotes & Flashbacks: Asset Returns 9-29-24). That has been quite a fall since then.
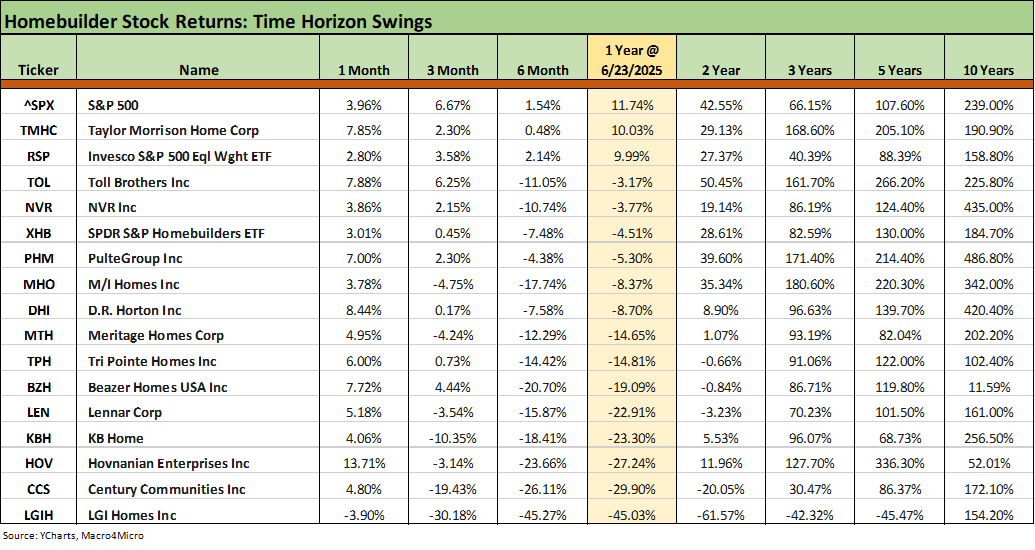
The time horizons for homebuilder equity returns have been an unusual story given how well many performed across the inflation cycle and ensuing tightening that sent 30Y mortgages above 8% by fall 2023. The Hi-Lo range of 200 bps on 30Y mortgages since late 2023 did not derail homebuilders but generated strong headwinds for existing home sales that created opportunities for the more flexible incentive mix and design alternatives for homebuilders.
The builders ran very strong across 2024 and then went into a slide in 4Q24 that has worsened the past 6 months as captured above in the trailing 6-month time horizon. We are seeing that in the start of the 2Q25 reporting season with a wave of guidance ahead for the June quarter reporting companies.
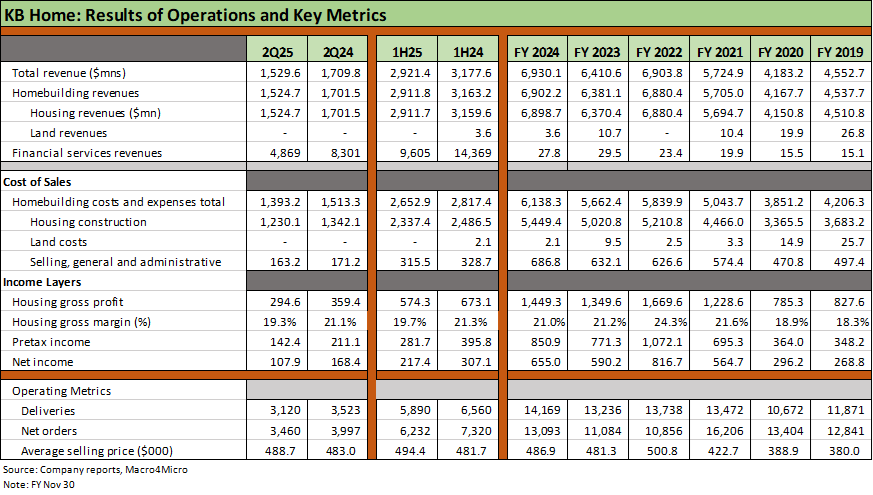
The above table provides the broader mix of financial and operating metrics, and the negative trend is clear enough with homebuilding revenues down, financial services revenues lower, a decline in key volume lines (deliveries and orders), and sharp reductions in gross profits also bringing lower margins, lower pretax income, and lower net income. The trends are consistent with what the market is hearing from other major builders.
The fact that Average selling prices (ASPs) are higher is another challenge to affordability optimism with mortgage rates and monthly payment pressures still a fact of life. We cover the deliveries and ASP lines by geographic region in other charts below, and the overall ASP total always comes with the asterisk of regional and community mix.
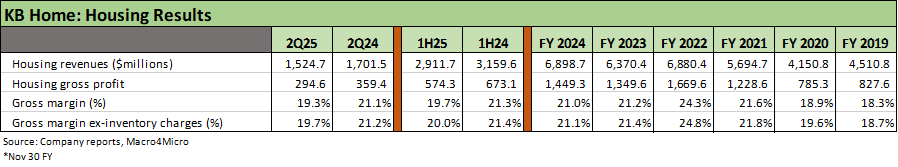
The above table updates the housing gross profit and gross margin trend line. While margins are clearly going through a compression stage for many major builders right now from the outsized peaks of 2022 (subject to fiscal years and the mix of built-to-order vs. spec), the margins are still running ahead of pre-COVID levels for most. For KBH, the gross margins are heading back to 2019 levels. That is a setback but certainly not a major erosion of profitability in longer term context.
The term often used across industries from periods of outsized price action or moves in select metrics is “normalization.” The theory that the homebuilding industry is returning to “normal” margins will get put to the test in 2H25 and into 2026 with the consumer cycle softer and the effects of tariffs on materials (lumber, gypsum, aluminum, steel) as moving parts.
The cyclical trends could flow into the UST curve, mortgage rates, and the demand side for new homes. The usual macro variables to sort out across economic cycles are troubling at this point (notably job and income trends), and the homebuilders will still have the favorable factor of demographic demand and a shortage of housing and notably in the “affordable” tier. Demand weakness is here and mortgage rates will be a key driver, but the threats to the credit quality of homebuilders are still low.
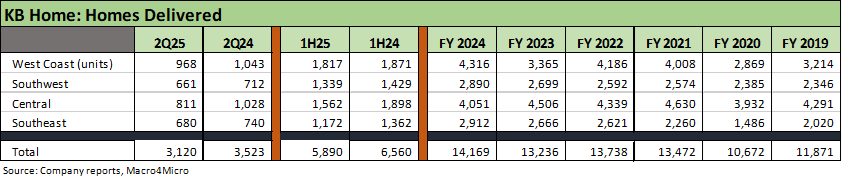
The above table updates the volume trends for deliveries in total and by geographic segment. All four regions posted YoY declines in 2Q25 while the West shows a minimal decline for 1H25.
KBH gave some airtime to the distortions in recent years of its legacy Built-to-Order (BTO) business model as the sharp declines in the existing home sales market prompted numerous traditional BTO builders to shift the mix to more spec inventory. The volatile mortgage rate movement made move-in ready homes more important in the mix and got more companies focused on closing the delivery gap with a 60-day timeline typical of existing home sales. That 60-day topic was mentioned by KBH on its earnings call in the context of its built-to-order evolution.
The benefits of lower build times are numerous, including a more compelling selling proposition for customers purchasing a build-to-order home relative to the 60 days it typically takes to complete an existing or speculative home purchase. Better inventory turns and monetizing our assets quicker. We are continuing to rely on our long-standing trade relationships with our even flow production to ensure that we have the crews necessary to get our homes built.
The 60-day timeline was wholly embraced by some builders as a core strategy (see Credit Snapshot: Meritage Homes (MTH) 5-30-25), but KBH is still about BTO as a functional strategy at 60% to 70% of its mix at this point as cited in its 2Q25 presentation. Longer term, BTO has averaged 70% to 75% of the mix. The key for KBH is to reduce building cycle times, which was a focal point on the earnings call.
The ASP details in the above table always offer a stark reminder of the wide range in home prices across regions. The $488.7K was up YoY but guidance for FY 2025 has been reduced on the high end of the range to $480 to $490K at 2Q25 from $480 to $495 at 1Q25. That ASP guidance is a minor change. The mix and incentive shifts can generate more tweaks along the way.
KBH provides customer mix details for those buyers that KBH finances with half being first time buyers with solid credit profiles (743 FICO scores) with an average household income of $136K. Average down payments were around 16%.
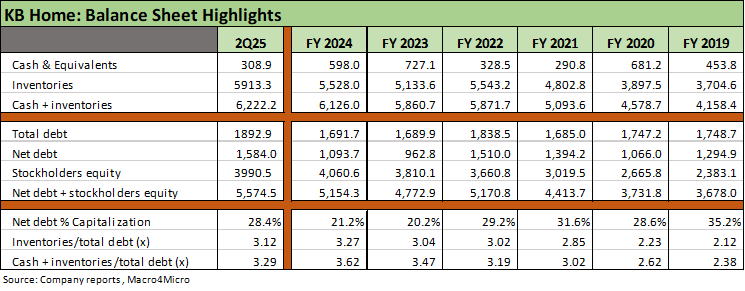
The balance sheet trend was the worst part of the 2Q25 metrics update from our vantage point with Total debt % Capitalization and Net debt % Cap both notably higher from 2023 and 2024 levels. KBH cites 30% total debt as a reasonable target vs. the current 32.2% for total debt leverage and 28.4% net debt to cap. That leverage is not especially high by their standards but it is a sharp move from 2023-2024. The adverse trend line in leverage and weaker operating metrics would logically take credit ratings upgrades off the table.
The asset coverage metrics such as “inventory/debt” and “cash + inventory/debt” are steady as of 2Q25 as noted in the table with 3.1x inventory/total homebuilding debt and 3.3x for “cash + inventory.” These remain near the upper end of the range over the 2019 to 2Q25 timeline. Liquidity ended the quarter well positioned with approximately $1.2 bn ($309 mn cash, $882 mn unsecured revolver availability).
In an unsurprising move, KBH indicated it would be lowering its land spend and development outlays with some reallocation to stock buybacks. As a frame of reference, KBH spent $1.4 bn in land development and fees in 1H25 after $2.8 bn in FY 2024. For 2Q25 alone, KBH spent $513 mn on land acquisition and development. That magnitude of land/development outlays offers a reminder of the intrinsic flexibility of homebuilders to adjust working capital to cyclical realities.
In the current backdrop, KBH faces weaker markets vs. expectations and that has pressured margins and will bring more incentives ahead. KBH is adequately positioned in inventory even as the peak selling season is framing up as a disappointment. The buyback program has been steady across time with 30% of shares repurchased since late 2021. The current buyback authorization is $450 million.
See also:
Footnotes & Flashbacks: Credit Markets 6-23-2025
Footnotes & Flashbacks: State of Yields 6-22-2025
Footnotes & Flashbacks: Asset Returns 6-22-2025
Mini Market Lookback: FOMC Spoke Clearly, Iran and Trump up next 6-21-25
KB Home:
Homebuilder Rankings: Volumes, Market Caps, ASPs 5-28-25
KB Home 1Q25: The Consumer Theme Piles On 3-25-25
KB Home 4Q24: Strong Finish Despite Mortgage Rates 1-14-25
KB Home: Steady Growth, Slower Motion 9-26-24
Credit Crib Note: KB Home (KBH) 7-9-24
KB Home: Wraps Industry Rebound Year, Exiting on Upswing 1-14-24
KB Home: Credit Profile 6-24-23
Housing sector:
Existing Homes Sales May 2025: Sequential Stronger, YoY Weaker 6-23-25
Home Starts May 2025: The Fade Continues 6-18-25
New Home Sales April 2025: Waiting Game Does Not Help 5-23-25
Other Homebuilders:
Lennar 2Q25: Bellwether Blues 6-20-25
Credit Snapshot: Meritage Homes (MTH) 5-30-25
Credit Snapshot: PulteGroup (PHM) 5-7-25
Credit Snapshot: Toll Brothers 5-5-25
Credit Snapshot: D.R. Horton (DHI) 4-28-25
Credit Snapshot: Lennar (LEN) 4-15-25
Credit Snapshot: Taylor Morrison Home Corp (TMHC) 4-2-25
Lennar: Cash Flow and Balance Sheet > Gross Margins 3-24-25
Toll Brothers 1Q25: Performing with a Net 2-20-25
Credit Crib Note: Lennar Corp (LEN) 1-30-25
D.R. Horton: #1 Homebuilder as a Sector Proxy 1-28-25
Toll Brothers: Rich Get Richer 12-12-24
PulteGroup 3Q24: Pushing through Rate Challenges 10-23-24
Lennar: Bulletproof Credit Despite Margin Squeeze 9-23-24
Credit Crib Note: PulteGroup (PHM) 8-11-24
Credit Crib Note: D.R. Horton (DHI) 8-8-24
Homebuilders: Updating Equity Performance and Size Rankings 7-11-24
Credit Crib Note: NVR, Inc. 5-28-24
Toll Brothers: A Rising Tide Lifts Big Boats 5-23-24
Credit Crib Note: Taylor Morrison 5-20-24
PulteGroup: Strong Volumes, Stable Pricing 4-24-24
D.R. Horton: Ramping Up in 2024 Despite Mortgages 4-19-24
D.R. Horton: Credit Profile 4-4-23