
Lennar 2Q25: Bellwether Blues
Lennar 2Q25 was part of a broader sell-off in homebuilder equities with the glum tone of the earnings call saying more than the numbers.


“Definitely not crashing but it just continues to cool…well documented softness of the spring selling season…definitely softened or continues to soften…a descending market…it’s a very different environment today than what we’ve been through for the past 3 years…we are in an industry going through a bit of an industry recession” are some of the management comments that capture the flavor of 2Q25 commentary.
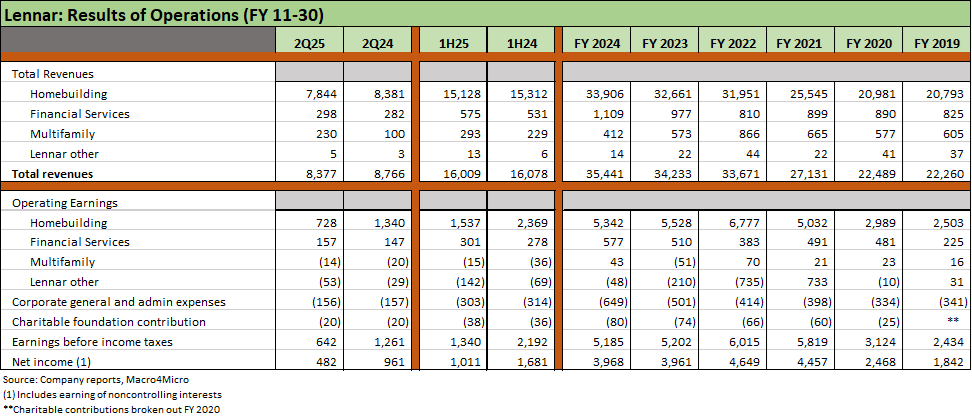
Lennar saw mixed delivery volumes by region for 2Q25 and lower total ASPs on deliveries that contributed to continued gross margin compression patterns for 2Q25 and YTD 1H25. LEN saw 2 of the geographic segments post higher deliveries while 2 regions declined for an overall total that rose by +2.2%. The mix shift and lower ASP translated into a -6.7% decline in delivery dollar value for 2Q25. A similar pattern was evident for 1H25.
New orders (units) ticked higher YoY for 2Q25 and the same for 1H25 with dollar value lower and total average new order ASPs materially lower.
The net effect has been a continuation of lower gross margins for LEN as the company sticks to its business model and game plan of focusing on cash flow and trading off margin for pace and even flow production.
LEN’s balance sheet remains exceptionally strong with Total Homebuilding Debt % Capitalization at 11.0%, up from FY 2024 (11-30) at +7.5%. Cash no longer exceeds debt, and Net Debt % Cap rose to +6.7% from the net cash position at FY 2024 which generated a -9.4% net leverage metric. The leverage also factors in the moving parts from the Millrose Properties (ticker MRP) capital contributions and spin-off (see Lennar: Cash Flow and Balance Sheet > Gross Margins 3-24-25, Credit Crib Note: Lennar Corp (LEN) 1-30-25).
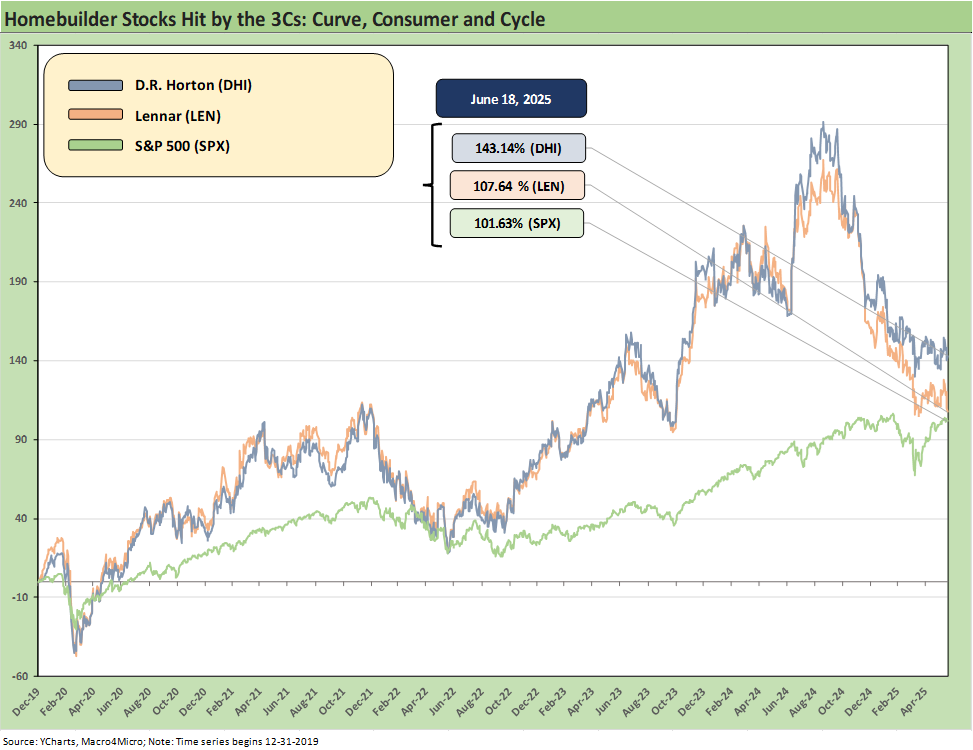
Lennar has not won over as many shareholders as it might have hoped with its distinctive business plan and the innovative REIT strategy for lot/land development. As we have been covering in our single name work and housing sector commentaries, homebuilder equities have been hit hard since a very impressive run through Sept 2024 that made the builder groups one of the best performing industry groups across the equity markets. They have since morphed into one of the worst performers in the trailing 1-year and YTD returns (see Footnotes & Flashbacks: Asset Returns 6-15-25).
Homebuilder equities have been on a downward ratchet since the end of 3Q24 as we highlight below in the time horizon equity returns table. That does not undermine the core cash flow dynamics and exceptionally strong asset coverage, but the fundamental revenue and earnings story is under pressure and more of the credit analysis will be migrating over to the cash flow statement and the moving parts of inventory liquidation relative to new starts and investment.
Homebuilders have the luxury of a high variable cost mix that generates cash on slowdowns. Inventory gets liquidated even as unit sales decline and revenue and earnings weaken. That is a favorable credit quality distinction from the BBB heavy mix of manufacturing issuers in the BBB tier with high fixed costs and who operate in the same broader economic cycle.
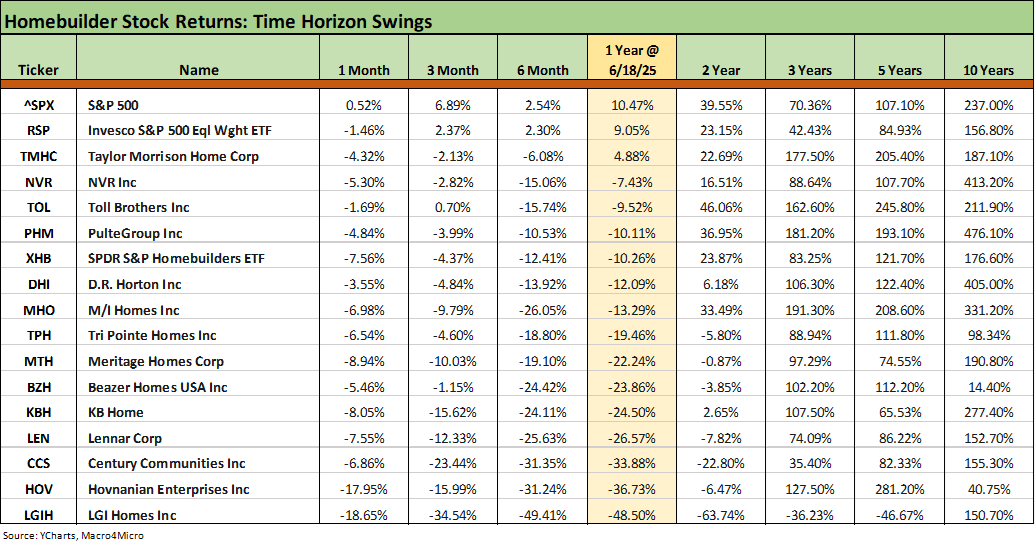
The table above is not a pretty one for builders with 13 of 14 homebuilders in negative range for the trailing 1-year (only Taylor Morrison positive) along with the Homebuilder ETF (XHB) that includes the major suppliers. For the 6-month timeline, we see all negative while 3-month sees Toll Brothers positive (barely).
We see more divergent results over trailing 2 years and 3 years with much better relative returns for many of the industry leaders. The period across the tightening and now easing cycle included a wide range of UST curve moves and shifts in slope that we look at in our weekly State of Yields publication (see Footnotes & Flashbacks: State of Yields 6-15-25). That includes a 200 bps Hi-Lo range in 30Y mortgages just from the fall of 2023.
Operating results highlight margin pressure…
The staggered fiscal year-end dates used by the major builders run from Sept 30 and each month after that through December 31. That steady release mix gives even more color and recent updates. The trends remain net negative. This all comes during a period of sustained high mortgage rates, tariff worries (with related disinformation), some tangible softening of the consumer broadly, and continued caution from new and existing home buyers. We get macro releases each month on starts, existing home sales and new home sales beyond the large publicly traded players. The trends in 2025 signal more pressure on demand requiring adjustments to price and steady use of incentives.
Lennar as one of the Big Two bellwethers…
Just on scale and geographic breadth, Lennar tells a broad story for the industry (see Homebuilder Rankings: Volumes, Market Caps, ASPs 5-28-25). The short form version of the performance and guidance for Lennar looks like the following:
Lennar is sticking to its even flow operating model: As we have discussed in our Lennar research (see links), LEN maintains a steady discipline of balancing sales and starts. To the extent its pace expectations are off, the company keeps pushing with price and incentives to keep the machine going and will make adjustments in planning as necessary. That has been evident in the relatively greater pressure LEN margins and lower ASPs net of incentives. The reality is that the market is cooling as management clearly stated on its call.
Guidance calls for margin stabilization in 3Q25: Gross margin of 17.8% (18.0% adjusted for purchase accounting) is projected to stabilize “subject to market conditions.” The guidance for deliveries would mark a modest increase of just over 2% YoY but LEN’s current ASPs are already below the 3Q24 ASP of $422K. The mix shift to the South Central regional segment is a major factor in the lower ASPs (TX, OK, MO, KS, AR).
Average sales prices eroding: LEN expects a continued decline in ASPs ahead to $380K - $385K for 3Q25 from $389 in 2Q25. For context FY 2024 was $423K ASP and the peak year was $480K in FY 2022.
Volumes: Lennar’s even production model brings an asterisk
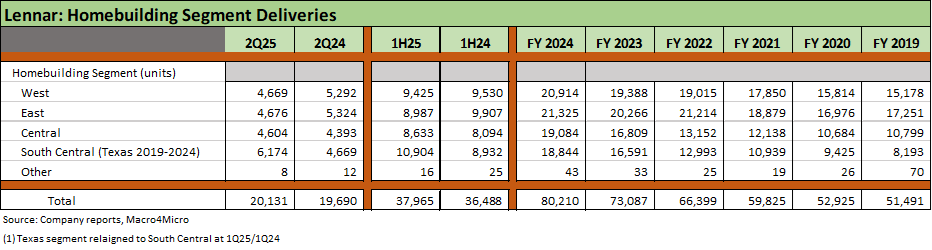
The above chart frames the regional mix for deliveries in 2Q25. The volume was up in total with 2 up and 2 down of the 4 main market groupings. Lennar has a habit of moving around its segment mix by states across the timeline, but the table captures the recent trends. The biggest increase was in the lowest ASP segment.
Average Sales Prices (ASPs) feeling the pressure of the business model
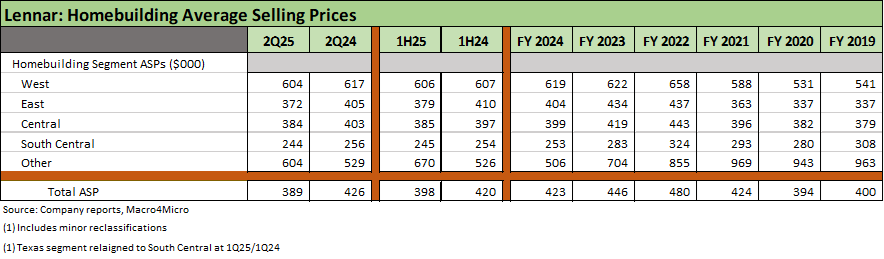
The wide range of the ASPs across regions is old news, and the gap between South Central at $244K and the West at $604K for 2Q25 is a reminder that it is a big country with big differences in the cost of living. The main takeaway is that all 4 geographic segments are down in ASP YoY in 2Q25 and 1H25 after the same for FY 2024. The fact that LEN moves its prices to keep the even production strategy rolling is showing up in the ASP and the expectation for another decline in 3Q25.
LEN balance sheet has been busy recently…
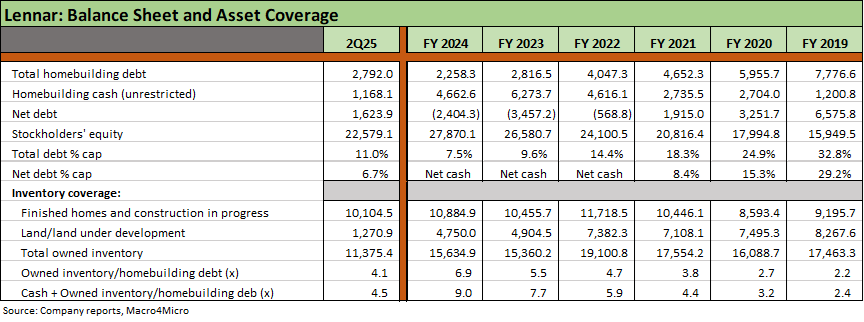
The LEN balance sheet story remains very strong in BBB tier context even if there is much less balance sheet liquidity. The changing profile of the balance sheet is a clear fact along the lines in the table above. The shift is part of the “asset light strategy” that the company has been discussing in detail across time and into 2025.
We have covered the spin-off of the Millrose Properties (MRP) REIT in earlier commentaries (see Credit Snapshot: Lennar (LEN) 4-15-25, Lennar: Cash Flow and Balance Sheet > Gross Margins 3-24-25). The MRP spin-off entailed a major distribution of assets and had the effects reducing inventory and cash. In addition LEN accounted for the spin as a major reduction in retained earnings with the $4.8 bn deduction from retained earnings under GAAP (thus the major reduction in stockholders’ equity since FY 2024 seen above).
The steady stock buybacks by LEN across time also have the effect of reducing stockholders’ equity and flowing into book value leverage. LEN repurchased another $517 million after maintaining a very high rate of buybacks across time as we have covered in our credit commentaries. From 2021 to 2Q25, LEN repurchased $7.8 bn in shares. Despite all that activity, the total homebuilder debt % capitalization was still only 11.0% and net debt/cap at 6.7%. As we have covered in past commentaries, debt % cap is much more relevant to assessing homebuilder risk than debt/EBITDA. We agree with the banks on this one.
We also include the usual asset coverage metrics we look at using inventory and “cash + inventory.” While those are down from the pre-MRP spin-off the coverage is still quadruple the total homebuilder debt.
Into the soft housing cycle
The tightening cycle that kicked in during March 2022 to peak mortgage rates in fall 2023 highlighted the impressive working capital management skills of the major homebuilder bond issuers as the cash flow remained impressive. Even if just managing starts vs. deliveries more prudently makes it a very different industry than what was seen in the 2004-2006 bubble.
The move to a greater reliance on options has mitigated balance sheet risk for most homebuilders. The industry used some of the NVR toolbox even if not following NVR’s avoidance of land development entirely. The industry now has a playbook that had worked quite well for NVR in the crisis (see Credit Crib Note: NVR, Inc. 5-28-24). LEN took an innovative step in this area with the creation of the Millrose Properties REIT to reduce balance sheet risk and be more asset light.
The pressure in this current market combined the effect of mortgage rates, high prices, and affordability setbacks (monthly payments) with a more defensive consumer sector that will also see builders facing higher material costs.
Tariffs will remain another headwind – direct and indirect…
We have discussed tariff risks in the single name and housing sector commentaries, and the main point is that material costs will rise (notably lumber but also aluminum from Canada, steel from everywhere, and gypsum from Mexico, etc.). Tariffs are intrinsically negative for the goods targeted and for the consumer (even if companies let the NAHB do the complaining for them). We have that “debate” in other commentaries. There is no “debate” on who writes the check to customs for the tariffs. It is the buyer. Anything else is disinformation from tariff fans.
The homebuilders have a lot of room to make tariff adjustments and lay off some of the costs on trade partners and customers as they adapt their designs and pricing strategies. The main overriding threat will still be consumer weakness on any exacerbated cyclical pressures tied to tariffs and unsettling developments on health care costs or other household budget inflation setbacks (gasoline, vehicles, apparel, etc.). That will cause buyers and lenders alike to pull back for their own reasons. Stagflation would be the worst outcome.
In portfolio context, stagflation would bring a very crowded boat of industries with problems. Homebuilders will present less risk than higher fixed cost manufacturers. As noted earlier, builders at least can look to variable costs and inventory liquidation in generating cash flow.
See also:
Footnotes & Flashbacks: Credit Markets 6-16-25
Footnotes & Flashbacks: State of Yields 6-15-25
Footnotes & Flashbacks: Asset Returns 6-15-25
Mini Market Lookback: Deus Vult or Deus Nobis Auxilium 6-14-25
Lennar:
Homebuilder Rankings: Volumes, Market Caps, ASPs 5-28-25
Credit Snapshot: Lennar (LEN) 4-15-25
Lennar: Cash Flow and Balance Sheet > Gross Margins 3-24-25
Credit Crib Note: Lennar Corp (LEN) 1-30-25
Lennar: Bulletproof Credit Despite Margin Squeeze 9-23-24
Housing sector:
Home Starts May 2025: The Fade Continues 6-18-25
New Home Sales April 2025: Waiting Game Does Not Help 5-23-25
Existing Home Sales April 2025: Soft but Steady 5-22-25
Other Homebuilders:
Credit Snapshot: Meritage Homes (MTH) 5-30-25
Credit Snapshot: PulteGroup (PHM) 5-7-25
Credit Snapshot: Toll Brothers 5-5-25
Credit Snapshot: D.R. Horton (DHI) 4-28-25
Credit Snapshot: Taylor Morrison Home Corp (TMHC) 4-2-25
KB Home 1Q25: The Consumer Theme Piles On 3-25-25
Toll Brothers 1Q25: Performing with a Net 2-20-25
D.R. Horton: #1 Homebuilder as a Sector Proxy 1-28-25
KB Home 4Q24: Strong Finish Despite Mortgage Rates 1-14-25
Toll Brothers: Rich Get Richer 12-12-24
PulteGroup 3Q24: Pushing through Rate Challenges 10-23-24
KB Home: Steady Growth, Slower Motion 9-26-24
Credit Crib Note: PulteGroup (PHM) 8-11-24
Credit Crib Note: D.R. Horton (DHI) 8-8-24
Homebuilders: Updating Equity Performance and Size Rankings 7-11-24
Credit Crib Note: KB Home 7-9-24
Credit Crib Note: NVR, Inc. 5-28-24
Toll Brothers: A Rising Tide Lifts Big Boats 5-23-24
Credit Crib Note: Taylor Morrison 5-20-24
PulteGroup: Strong Volumes, Stable Pricing 4-24-24
D.R. Horton: Ramping Up in 2024 Despite Mortgages 4-19-24
D.R. Horton: Credit Profile 4-4-23