
Iron Mountain Update: Records ‘R’ Us
IRM shows steady growth and solid execution with IRM presenting what we consider to be an IG credit risk profile.

We update Iron Mountain’s financial and operating profile for mid-2025 as double-digit revenue and EBITDA growth, very strong discretionary cash flow, and a sustained high rate of growth capex remains a core part of the valuation story line. IRM 2Q25 posted record revenue, record EBITDA, and record running growth capex while keeping leverage stable.
The exceptional performance in the equity markets vs. comps in recent years relative to REITS, data centers and market benchmarks started lagging after such a great run, but double-digit revenue and EBITDA growth to across-the-board records was accompanied by an upward revision in guidance.
Despite record capex and higher total debt levels, we see stable debt leverage metrics on rising revenue and EBITDA. The one-two punch of legacy business free cash flow and valuable higher margin reinvestment opportunities in attractive growth businesses (notably data centers) make IRM a very different company than the legacy income stock and HY bond issuer of bygone days.
IRM has a hybrid business mix with extensive, granular disclosure that can make picking up coverage of the name a challenge, but IRM is one worth following in credit as well as in equities. In credit, IRM is the #8 issuer in the BB tier and #15 overall in the HY index. The cap structure includes a major revolver and term loans on a global scale.
The business mix weighting is shifting gradually toward data centers and digital services but those remain in the minority of revenues relative to legacy high margin physical storage operations. The growth segments have been a big part of the shift in equity valuation metrics as well as dominating the capex budget. For IRM, “growth capex” dwarfs recurring capex as we frame further below. The recent 19x EV multiple at 2Q25 is a long way from the low teens in the pre-COVID period.
IRM has not been broadly covered in equities by the “street” data center or REIT analysts despite the sustained growth on both sides of the balance sheet and its sheer scale. IRMs rise in the S&P 500 rankings over the past decade (low 300 range now) and bond market presence make it a priority name.
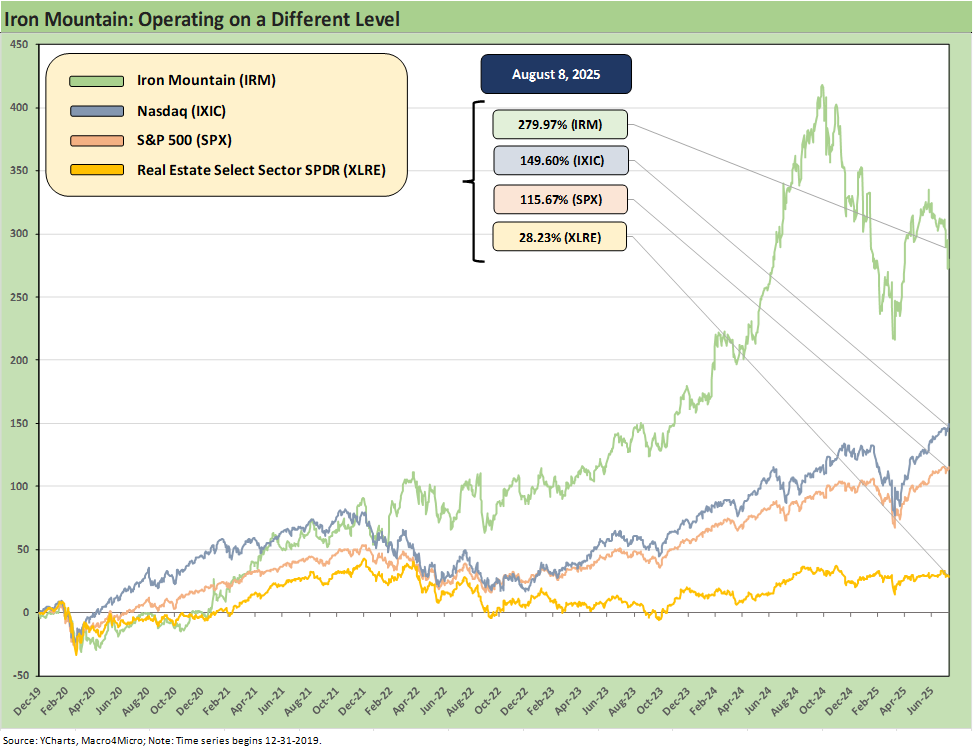
The above chart plots the stock return timeline for IRM since the end of 2019. It has been quite a ride (disclosure: we have been in and out of IRM stock over the years but no current ownership). We plot the return time series for IRM against the S&P 500, the NASDAQ and the REIT-heavy real estate ETF (XLRE). In the following time horizon table, we also compare IRM vs. the digital infrastructure and real estate ETF (IDGT) that includes numerous data centers. The weakness of REITs during markets with rising rates make IRM stand out even more.
As evident in the chart above, the impressive run in IRM equity started to fade in 2024. That does not mean the financial fundamentals are stalling, but the dip is more about framing the relative equity valuation and growth potential in 2025-2026. The recent weakness is more in the context of how far the IRM equity had already run.
As we said back in our December 2024 note on the company: “Even if a stock watcher is of the view that the stock is rich and has come “too far, too fast,” the credit quality comfort is in the revenue and EBITDA growth and the discretionary nature of the major growth capex programs. In other words, if markets slow down, so will the pace of growth capex as a stabilizer of financial risk metrics.
For credit investors, the steady growth and solid profit margin profile matches up well with a very deep asset base. IRM is an asset-heavy operation with a services stream of earnings that has clear growth prospects ahead. The bullish growth potential is underscored by its capex numbers and the empirical evidence in its data center growth.
IRM has seen the expansion of a range of digital services operations and emerging businesses such as Asset Lifecycle Management. IRM tells a good story of cross-selling and how the natural economic path of so many data and storage businesses feed into new revenue streams.
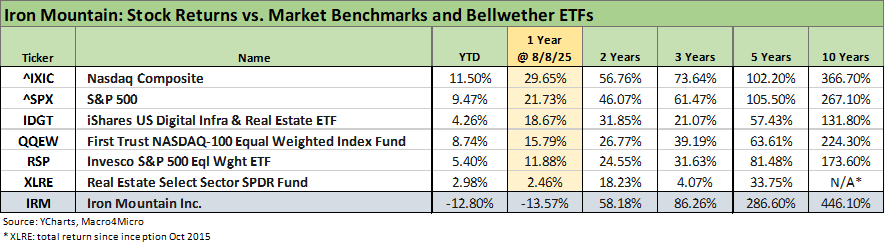
The above chart offers various time horizons vs. broad market indexes and some additional ETF benchmarks. The results highlight the superior performance across the cycles and steady execution across a cycle that included a pandemic and the first Fed inflation fighting bout since the early 1980s. The trailing 2 years, 3 years, 5 years and 10 years stand out vs. comps. The comparison with the REIT-heavy Real Estate ETF (XLRE) and the data center heavy IDGT ETF offer some useful frames of reference.
We have been tracking Iron Mountain for almost a decade, and the transformation has been very impressive as IRM converted to REIT status (effective 2014) and shifted its business mix into more growth markets across data centers, asset life cycle management services, and digital solutions for data and documents. We have covered those issues in detail in past commentaries (see links at the bottom), so we don’t have to revisit those topics here. IRM is in many ways a peer group of one, but IRM frames up well vs. narrower industry leaders.
The main themes are higher growth and higher value business lines in expansion mode. Importantly, we need to flag the anchors of exceptional gross margins and low capex intensity in legacy storage business lines that “feed” reinvestment in its growth capex operations. IRM can boast the proven depth of readily available funding sources in the unsecured bond markets from BBB tier buyers stepping down across the speculative grade divide and reliable demand from the higher quality BB HY buyer.
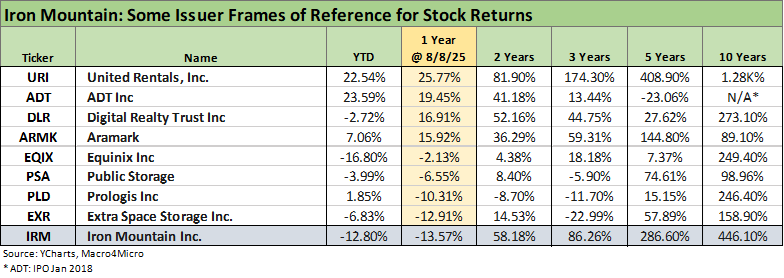
We drop in some bellwether REITS and Data Centers in the table above along with some major HY market services companies. These offer some logical frames of reference and notably for those playing in higher quality and mainstream HY names. We line them up in descending order of trailing 1-year equity returns. The chart offers some food for thought on industries that are often pummeled by rising rates (REITs) and those that have reaped the rewards of the data center boom.
There are some that are idiosyncratic stories (e.g. Aramark, ADT) as well as some secular growth stories with strong cash flow fundamentals that were also winners. Looking back across the years, United Rentals and IRM showed the ability to push through a tough tightening cycle as well as COVID turmoil. URI is clearly an unusually strong story (see Credit Snapshot: United Rentals 4-1-25). In equities, the valuation run for IRM is now facing some challenges as it outpaced some market views on sustainable growth metrics, but the credit story is stronger than it has been across this timeline history.
With a low BB tier composite credit rating in the HY index, IRM is on the short list of “most overdue for an upgrade” (and has been for a while). That is especially the case in light of how it has grown and its overall metrics relative to BBB tier REITs. IRM credit ratings are a victim of IRM’s own distinctive business mix in getting treated like a HY Services operation and not a REIT and tech play.
The credit ratings tend to treat IRM like a HY services company with a 5x leverage metric as opposed to a massive cash flow generator that is asset rich in key growth sectors at the same time as posting high margins with slow-growth legacy businesses offering recurring high margins and high cash flow. The legacy business differentiates IRM from other data center operations in being there to support growth capex and recurring dividend requirements consistent with its REIT status. The 5x lease-adjusted leverage for such an asset rich, high margin growth story is not a HY balance sheet. It is IG quality.
The evolution has seen IRM shift from a pure income stock “back in the day” with low multiples, high dividend yields, and high leverage (and a legacy HY bond issuer) to an increasingly tech-centric growth story with higher margins and very healthy discretionary cash flow. IRM posts a high EV multiple over 19x at 2Q25) that is almost 4x IRM’s leverage ratio. Despite that valuation profile, the extraordinary growth of the asset base has not gained IRM much traction with the credit rating agencies.
From our vantage point, a company with a 19X EV multiple vs. leverage of 5x (even if using EBITDAR based-metrics) makes for a very strong financial profile. IRM’s very high margins in its legacy storage business and rapid expansion and increasing share in high growth business lines such as data centers offer a lot of comfort. That all makes for a good cyclical and secular story.
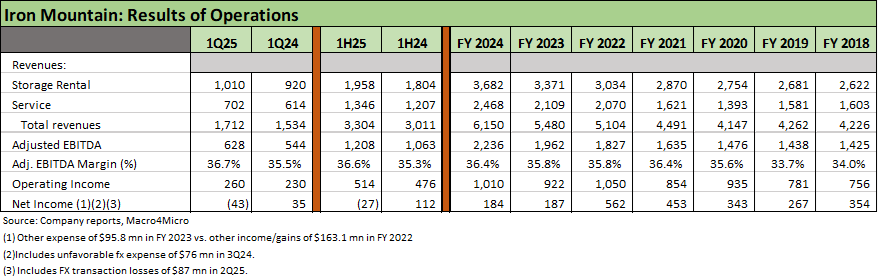
The above table underscores the theme of growth in revenue and EBITDA along with 30% handle EBITDA margins. IRM cited all-time records for revenue, adjusted EBITDA, and AFFO (Adjusted Funds from Operations). As highlighted by IRM: “Data center, digital, and asset lifecycle management (ALM) businesses collectively grew more than 30% (for 2Q25).” That growth rate in high margin businesses has overhauled the context for evaluating credit risk as well.
IRM highlighted it is on track for its 37th consecutive year of organic storage rental growth. IRM also flagged 26% organic storage growth in data centers. IRM’s “commercial” highlights its global scale and cross-selling opportunities within a large and a well-established client base as they enter new service lines. The IRM sales pitch has been consistent across time, and it has been backed up by IRM’s numbers and execution.
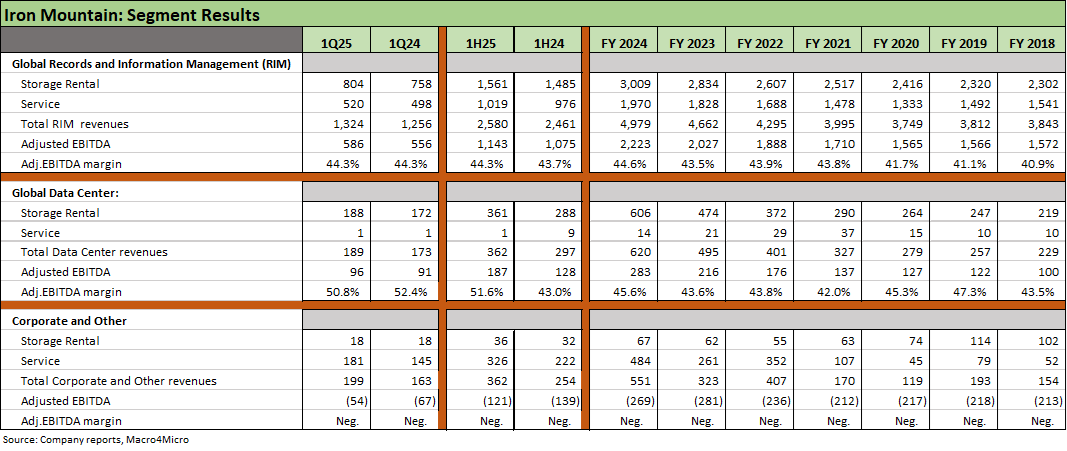
The above table updates the segment results, and we see revenue and EBITDA growth that still translated into EBITDA margin expansion in 1H25 even if data center segment margins narrowed slightly for the 2Q25 period to a still lofty 50.8%. For 1H25 in Global Data Centers, we see higher revenues from organic storage rental growth and material YoY margin expansion on “lease commencement, improved pricing, and cost containment.” In other words, there are favorable results on the other side of the record growth capex.
The increased revenue and margins in the RIM segment for 1H25 organic storage rental growth and pricing power while organic growth in RIM services was in part tied to digital solutions services growth and higher volumes in legacy services mix.
The gross margin of over 70% (not shown above) in legacy storage rental (Section V in the quarterly supplemental disclosure document) is always worth highlighting since it serves as a massive cash flow generator that helps feed the cash flow available for dividends and growth capex.
“Corporate and Other” has an asterisk on it as detailed in earlier commentaries since it is not just a catch-all for “other corporate” as we often see in segment disclosure. The corporate segment includes Asset Lifecycle Management (ALM) operations and related services with $362 million of revenues set against the corporate segment expense base.
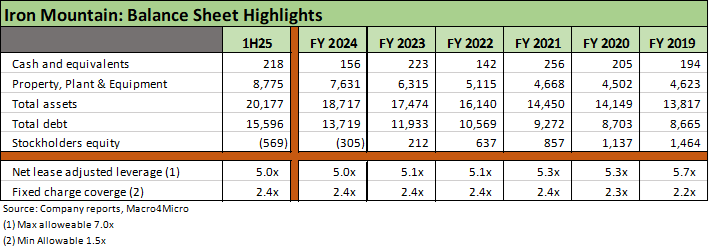
The above table updates the balance sheet trends of IRM as assets and debt both keep growing along with revenues and EBITDA. We see $15.6 bn in total debt at the end of 2Q25, and that includes around $9.3 bn in index bonds housed in the HY index and BB tier. As noted earlier in the bullets, that amount of bonds makes IRM #15 in HY index rankings and #8 in the BB tier. IRM’s position in the S&P 500 is around #314.
We are always surprised that IRM gets relatively low research focus in debt and equity. That is now changing with the data center play on the name, but more than a few data center purists will not pick it up and some REIT analysts duck the name. On the flip side, some legacy business service analysts do not want to let it go.
For the narrow balance sheet story, the level of detail in the debt footnotes each quarter is daunting given the global scale and multicurrency array of facilities and goal of managing currency risk vs. their revenue and asset currencies. The array of Revolvers, Term Loans, Mortgages, nondollar layers, and leases makes for a complex capital structure that may actually have held back the credit ratings. The granular disclosure and long history of the company in the markets and its global scale across 61 countries paints a picture of a disciplined and prudent liability management operation.
During 2Q25, IRM amended the credit agreement and increased the Term Loan A. IRM increased and extended the Aussie Dollar Term Loan. As noted in the table, the 5.0x lease adjusted leverage is well inside the requirement. Definitions and carve-outs with the banks have morphed over time and the “rent-adjusted” factor moved lower from 8x to 6x rent back in 2018.
IRM’s global scale and reach feeds into the data center story when many nations have data centers high on their priority list from the Middle East to Asia and Europe. That is especially the case where low-cost power is a competitive edge (Middle East).
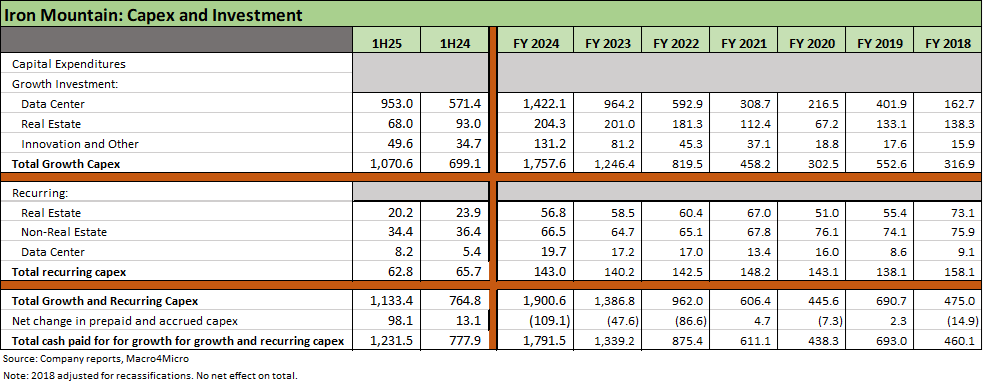
The above table updates the capex mix across “growth” vs. “recurring.” The growth component dominates the capex story at over 94% of total in 1H25 and 91% in 1H24. The absolute levels of growth capex rose by 53% in 1H25 vs. 1H24, and that was after a 41% increase in growth capex during 2024 vs. 2023.
We have covered capex issues in earlier commentaries, but we would again highlight that growth capex multiplied by over 5-fold from 2018 to 2024 in a sign of IRM’s aggressive expansion in data centers, which rose almost 9-fold on the growth capex line from 2018 to 2024. Data centers accounted for 81% of total growth capex in FY 2024 and 89% of growth capex in 1H25.
The projected FY 2025 capex provided by IRM calls for $1.95 bn total in FY 2025. That is certainly consistent with the recurring headline commentary in the markets and from so many service providers and suppliers to those sectors including equipment rental.
For purposes of credit risk, the capex line is reassuring in magnitude given the discretionary nature of the planning and the ability to adjust the capex strategy over time with the operations set against much-enlarged revenue, EBITDA and cash flow base as some of these mega projects mature.
The equity markets are still wrestling with how to price all this growth into the IRM valuation as we saw the massive run in IRM equity falter in 2024. For credit quality, the outlook is positive as the revenue and cash flow performance is an anchor along with the exceptional asset coverage.
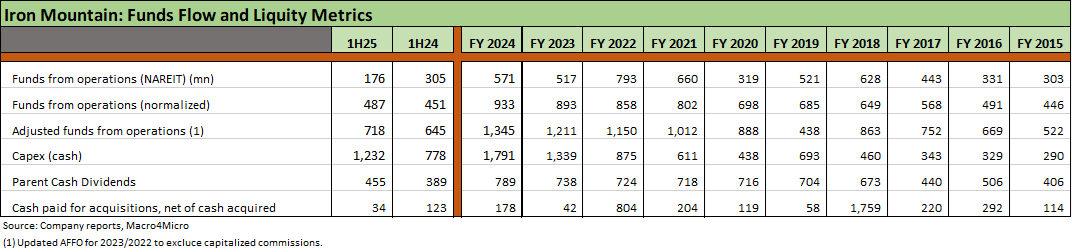
The above table updates the usual metrics from REIT guidelines and the traditional GAAP funds flow disclosure. Again, the capex line is the one that jumps off the page and which is consistent with all the mega project and data center headlines we all routinely see.
As covered in earlier commentaries on IRM (see Iron Mountain: Credit Profile 4-15-23), the dividend story line is one that tweaks the analytical framework given the REIT status and related requirements that they break out in detail in their usual SEC filings. Unlike the typical HY issuers analysis, you analyze debt funding needs for growth after giving weight to the projected dividend – not before.
At times we have heard people say “they are borrowing to pay their dividend” (a no-no in credit analysis 101). In fact, IRM is planning their debt funding needs after the dividend to fund the growth strategy that has driven a great stock valuation trend for IRM and stellar financial metrics. We see both sides of the balance sheet growing (total debt and total assets) and we see basically everything growing (Revenue, EBITDA, capex) which in turn allows for “organic leverage declines” or stable balance sheet metrics on rising EBITDA. We covered that in the balance sheet section of our IRM work.
See also:
Credit Snapshot: Iron Mountain 4-15-25
Iron Mountain 4Q24: Performance Bar Gets Raised 2-15-25
Credit Crib Note: Iron Mountain 12-18-24
Iron Mountain: Good Climb, Summit Unknown 11-10-23
Iron Mountain: The Quiet Man 4-16-23
Iron Mountain: Credit Profile 4-15-23