Mini Market Lookback: Tariffs Back on Front Burner
Muted PCE move and favorable 2Q25 GDP revisions run into tariff legal confusion to thicken the plot.
Trump’s 4 Horsemen: Low-cost sourcing, higher profits, lower regressive taxes, better purchasing power for consumers.
The combination of muted PCE and now the potential for a massive reduction in tariffs (if SCOTUS upholds the Appeals Court decision…not a close vote at 7-4) on IEEPA “emergency tariffs” should in theory improve the odds of the FOMC easing. Court dates (TBD) could make that decision timing murky. The August payrolls and another CPI reading come ahead of the Sept FOMC meeting.
As we note in the picture above, Trump’s prediction of a dystopian hellscape if he loses his IEEPA blank check is nonsense and devoid of facts, concepts and any historical substance. Section 232 and 301 remain alive and well and involve clear and specific purposes as to why such responsibility was delegated to the executive branch by Congress. Even the use of Section 232 had been abused and bothered some leading GOP Senators in Trump 1.0, but the use of IEEPA is beyond the pale.
IEEPA allowed Trump to play unchecked dictator on trade tax decisions (a no-no in the Constitution). It would help if he stopped saying “seller pays” and he “collected hundreds of billions from selling countries” in Trump 1.0 (he actually collected zero). His credibility on the tariff topic is for loyalists and sycophants only.
The reduced threat from inflation and diminished risk of Trump “tariff wilding” every time he wants to assert some leverage with a massive tariff threat could make the Fed easing process at the FOMC more confident and less tied to speculation on tariff outcomes. That said, there will be uncertainty in finalizing trade “deals” if there are disagreements on what the trade parties “agreed to” (that apparently is a recurring issue). Finalizing trade deals could become more challenging if Team Trump cannot show up at the negotiating table with a mask and an unchecked tariff chainsaw.
The PCE numbers this week came in as expected and were mild in context, so that also makes life a little easier for the FOMC. Both the PCE release on income and outlays and the revised 2nd estimate of 2Q25 with its upward revisions showed the consumer firmer than expected (see PCE July 2025: Prices, Income and Outlays 8-29-25, 2Q25 GDP: Second Estimate, Updated Distortion Lines 8-28-25).
This coming week (holiday shortened) brings August payroll numbers as the BLS controversy and fears of top-down control of data could get some fresh legs (see Happiness is Doing Your Own Report Card 8-1-25). Tariffs, payrolls, and consumer demand are three big pieces of the puzzle as easing is only part of the debate with steepening risk and dollar trends also a big part of the asset allocation dilemma.
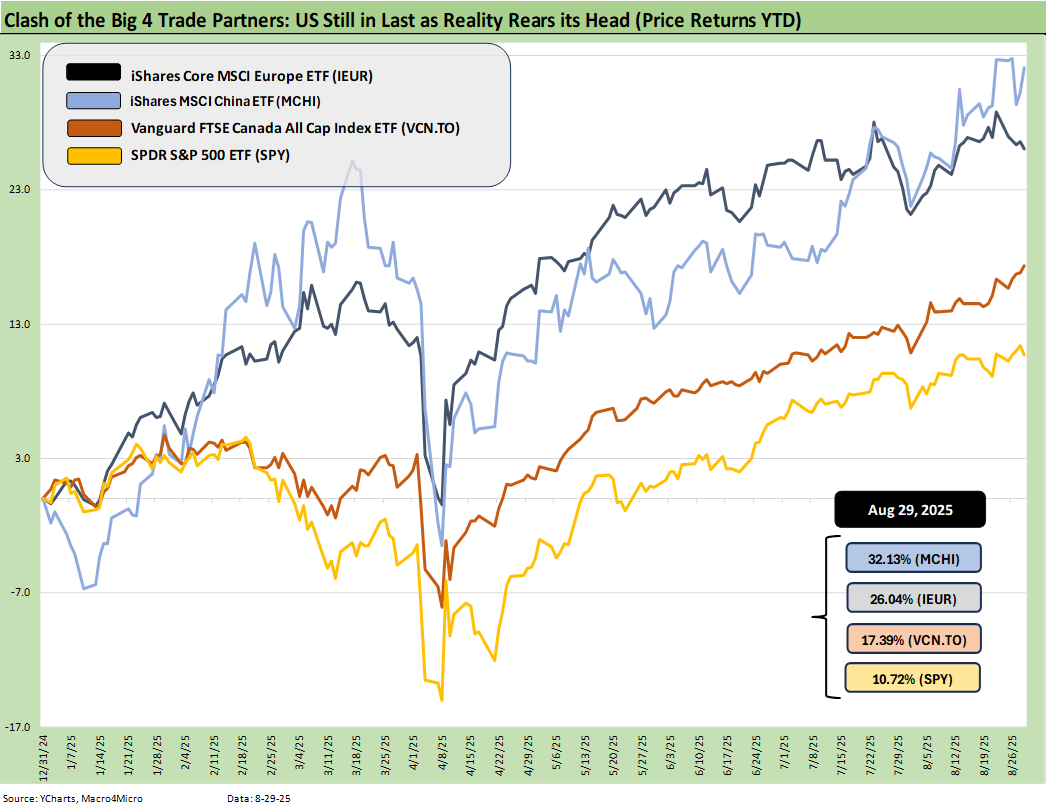
The above updates the YTD returns for some bellwether index ETFs of the Big 4 trading partners – the US, Europe, China, and Canada. We leave Mexico out since it typically gets flagged as “EM.” A representative Mexico ETF (EWW iShares MSCI Mexico ETF) could also be dropped in, and that performance was also favorable.
The goal is to plot some ETFs that tell a story for US investors thinking about global diversification. The ETFs are just a useful sampler that incorporates relevant broad market indexes for each region. The aim is to capture the balance of risks across the broad mix of macro trends (economy, currency) and the sea level industry and company fundamentals rolled up into a US traded ETF. For the US, we use the S&P 500 ETF (SPY). In other words, we went easy on the US given the mixed performance of small caps and midcaps across 2025.
The result is clear enough in this diversified mix of assets. The US came in last.
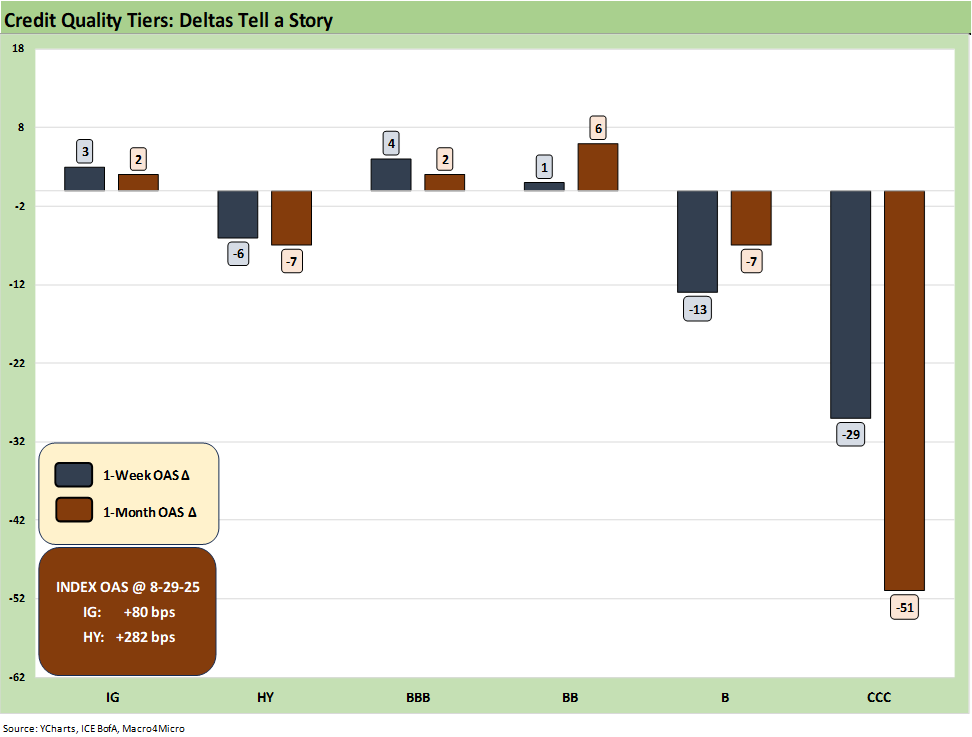
The above chart updates the credit spread deltas for 1-week and 1-month. From an extremely compressed base within the June 2007 credit bubble OAS zone, the risk-reward symmetry is shaky but the short to intermediate duration risk, the coupon income, and the all-in yields keep asset allocators in the game. That is especially the case when coming off a broad based solid trend line in earnings and cash flow (at the median or average) with the potential for easing on the front end high even if UST steepening and duration risk is uncertain.
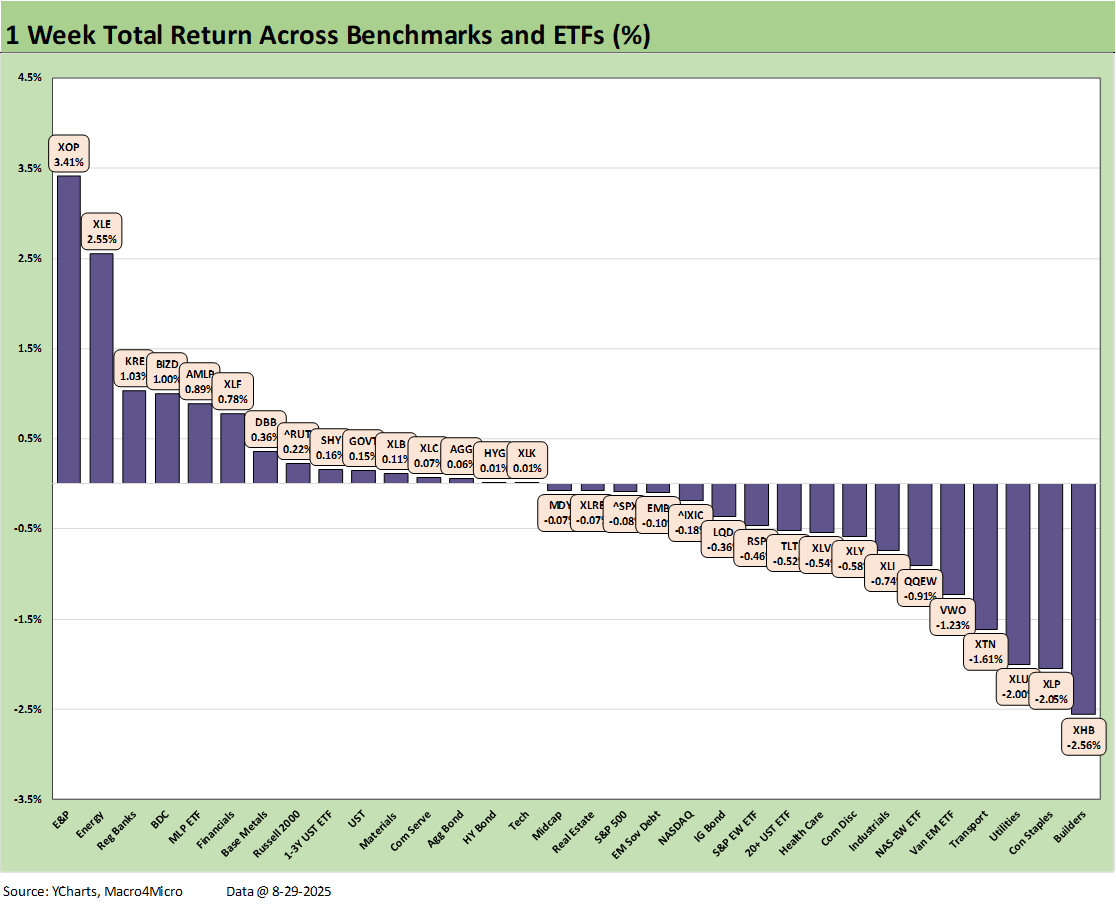
The above chart updates the weekly return for the 32 benchmarks and ETFs we track, and we see more of a split decision this week with a score of 15-17 in the positive vs. negative return contest. The larger cap benchmarks (S&P 500, NASDAQ) were just across the line in the red with Midcaps while the Russell 2000 small caps managed to just squeeze into the top quartile.
In a change relative to recent results, the E&P ETF (XOP) placed at #1 with the Homebuilder ETF (XHB) in last place after a very solid comeback rally in the recent weeks (see Footnotes & Flashbacks: Asset Returns 8-24-25). We will be out with updated time horizon asset returns over the weekend.
The mixed performance of duration this week did not help the builders or other interest sensitive sectors such as Real Estate (XLRE) or Utilities (XLU). We see the long duration UST ETF (TLT) in the red near the bottom of the third quartile. There will be a lot of UST slope and shapeshifting debates in September as the FOMC eases and a fresh mix of payroll, inflation, consumer, housing, and industrial data get released.
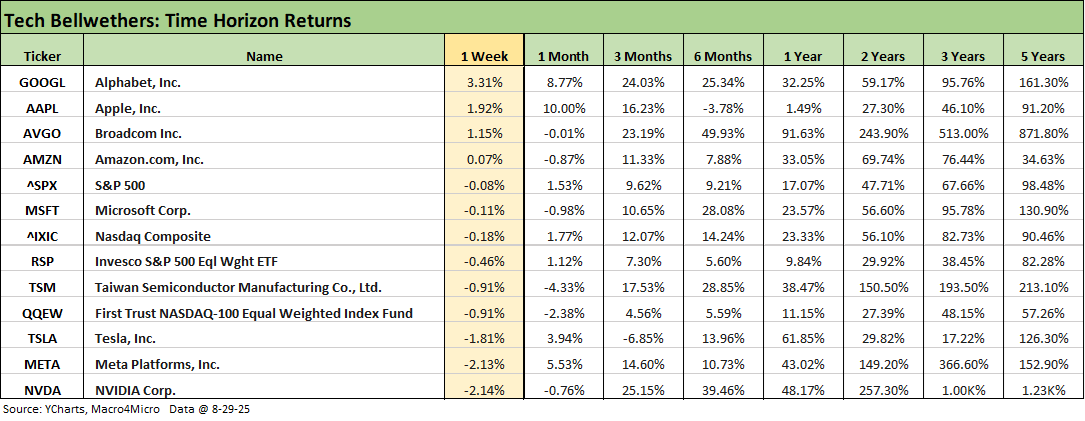
The above chart updates the returns for the tech bellwethers with the assets lined up in descending order of total returns for the week. We see only 4 of 13 asset lines in positive range with only 3 of the Mag 7 beating the S&P 500 with those joined by Broadcom despite NVIDIA sitting on the bottom after a mixed reaction to its earnings and guidance.
Looking back 1 month, only Apple hit double digits after a very rough 6 months and trailing 1 year. Looking back 3 months since the post Liberation Day selloff, only Alphabet and NVIDIA cracked the 20%+ handle return range. Over 6 months, Broadcom (+49.9%) and NVIDIA (+39.5%) were well ahead.
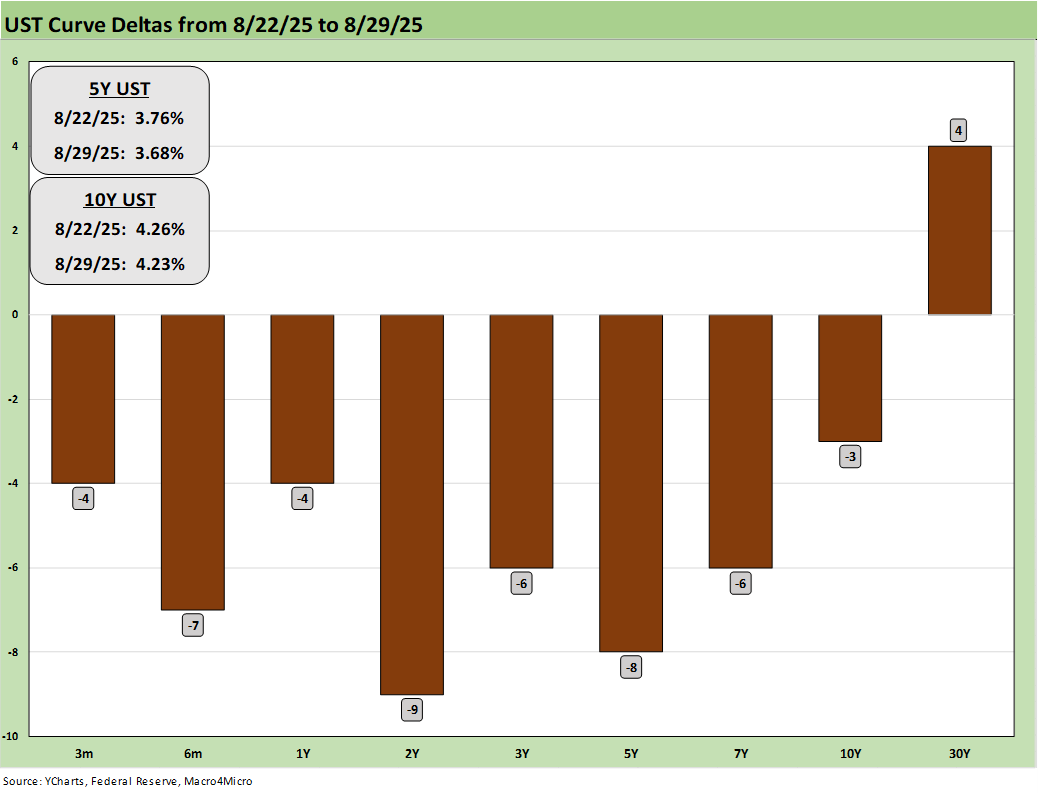
The above chart updates the UST deltas for the past week with a rally from 2Y to 10Y but the 30Y again moving wider and sending longer duration ETFs (LQD, TLT) slightly into the red.
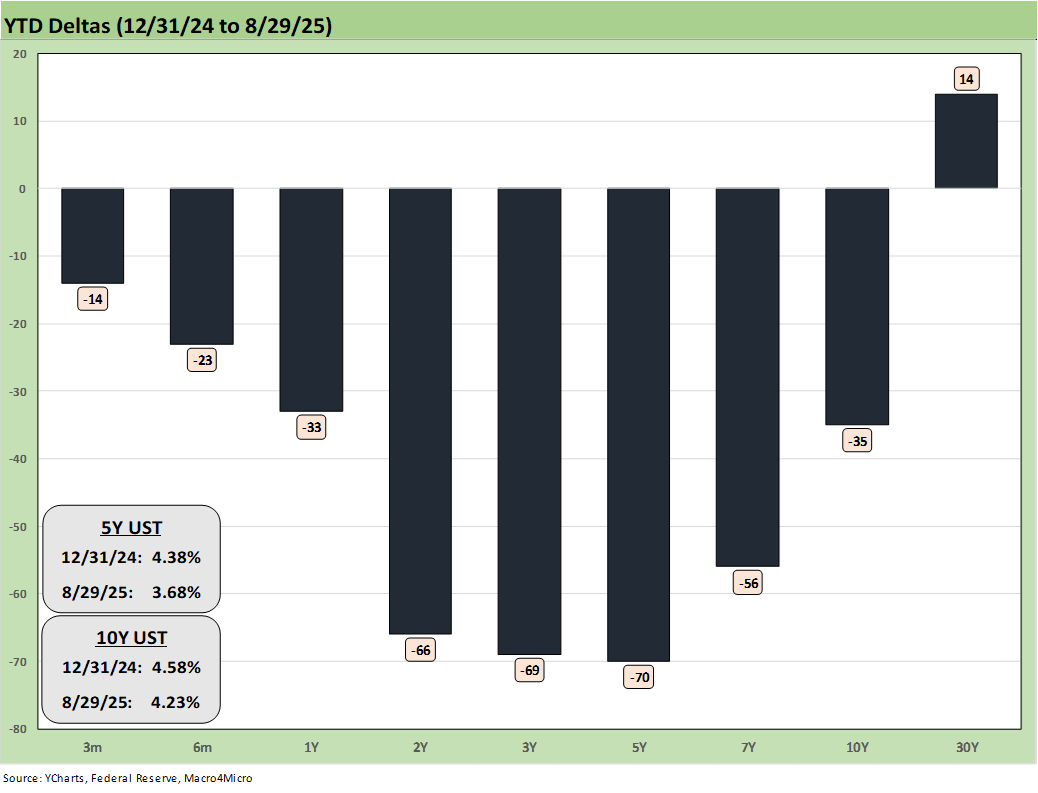
The above chart frames YTD UST deltas and holds true to form on the YTD bull steepener with an “uncooperative” long end.
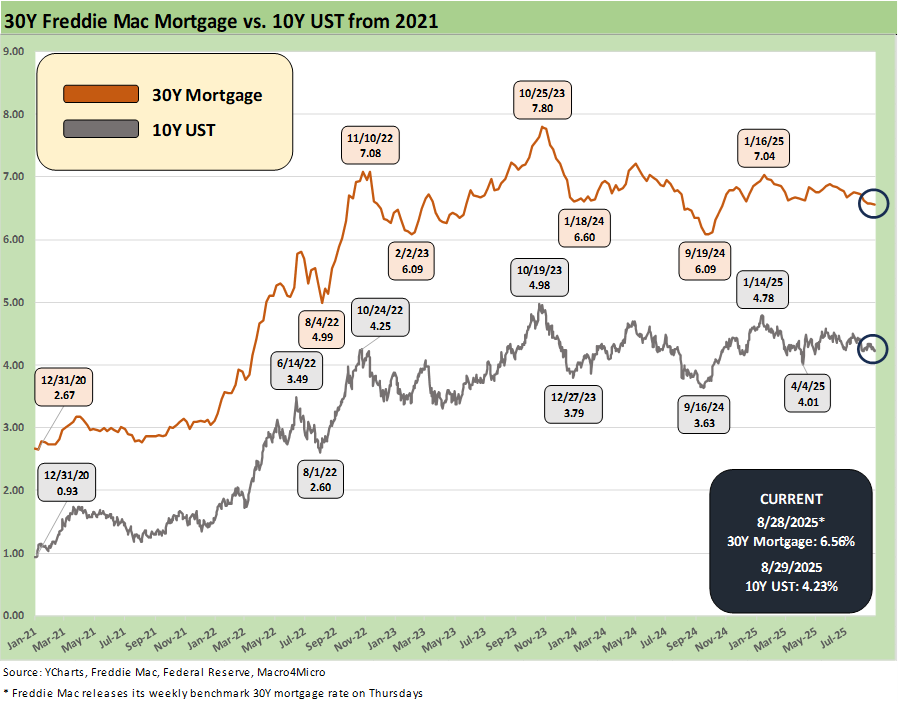
The above chart updates the time series for the 10Y UST that wags mortgage rates plotted along with the Freddie Mac 30Y mortgage benchmark rates. The market yearns for 6.0%. but the 6.56% Freddie rate is better than the high 7% handles of the fall 2023.
The likelihood of an easing ahead in Sept and multiple macro and micro releases through year end will keep potential homebuyers (new or existing) on edge. The same for sellers as golden handcuff handicapping is a big part of seller patience.
If Sept 2025 repeats the Sept 2024 experience with the UST curve and mortgages (a brief 6.0% handle) could make for some rapid decision making. The homebuilders also can generate a 5% handle with their mortgage incentives to move high inventory as we discussed on our housing sector work (see New Home Sales July 2025: Next Leg of the Fed Relay? 8-25-25).
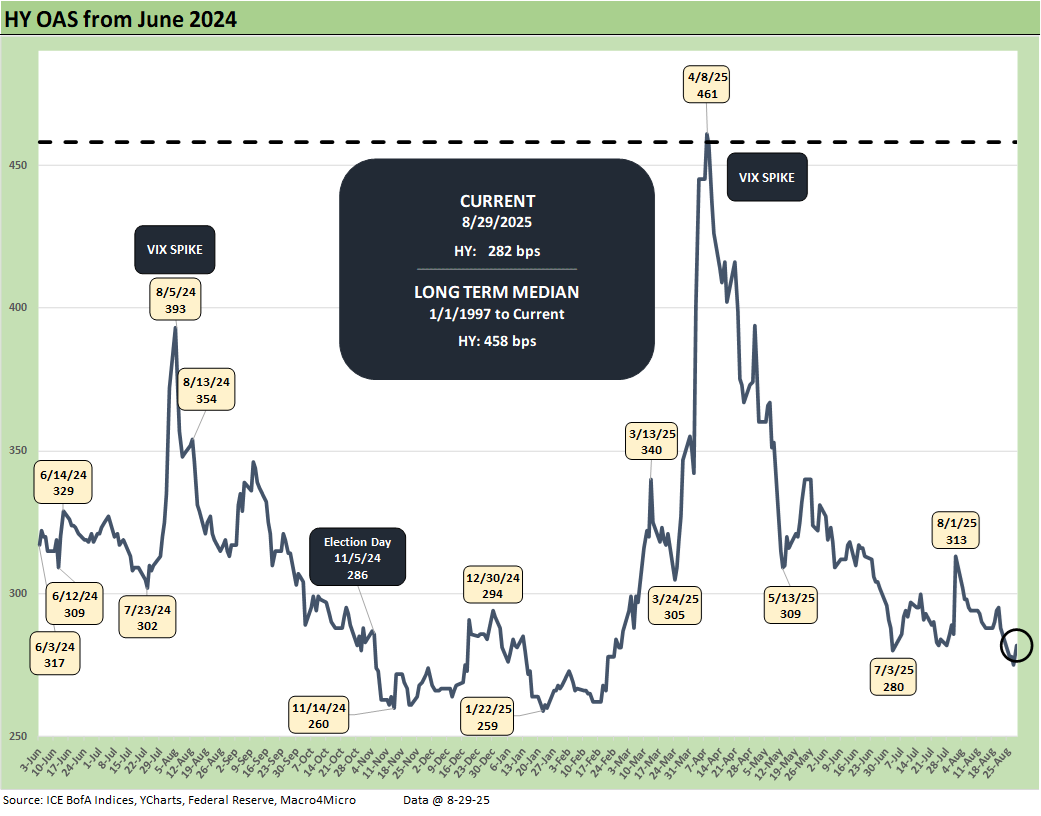
The above chart updates HY OAS with -6 bps of tightening this week to +282 bps vs. +288 bps last week. That is a very long walk from the long-term median of +458 bps.
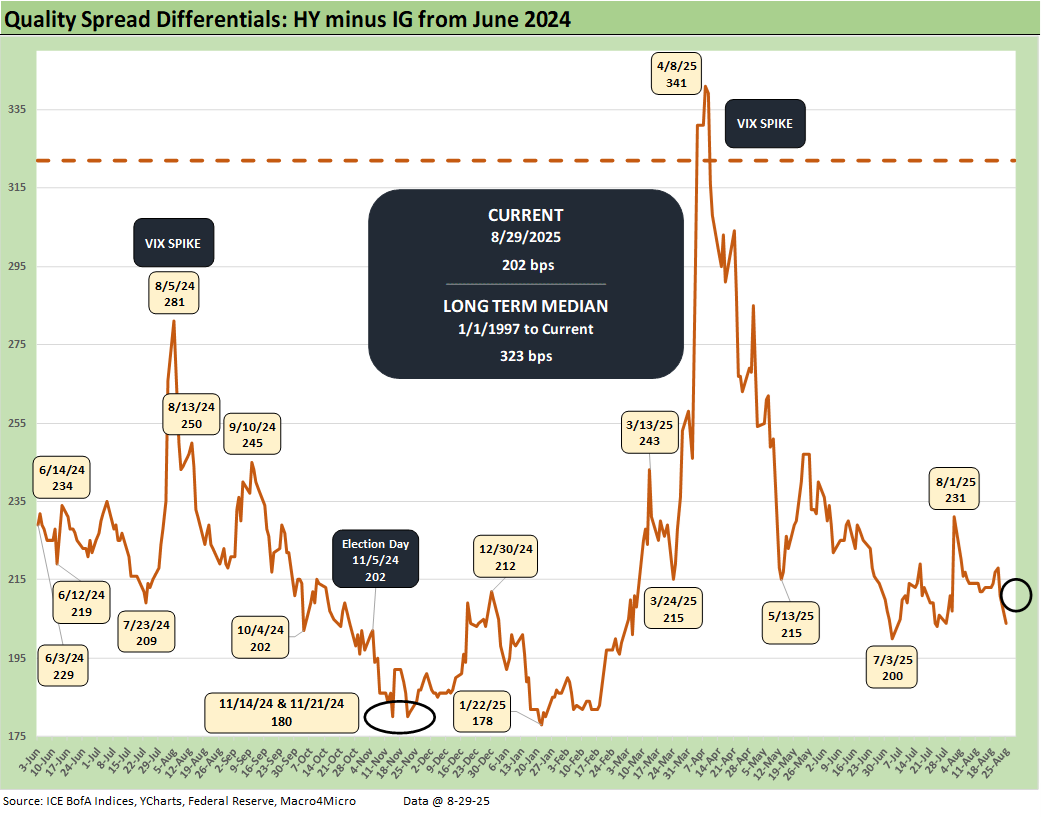
The “HY minus IG OAS” quality spreads tightened to +202 bps from +211 bps as HY tightened. IG OAS edged wider by +3 bps with HY tighter by -6 bps.
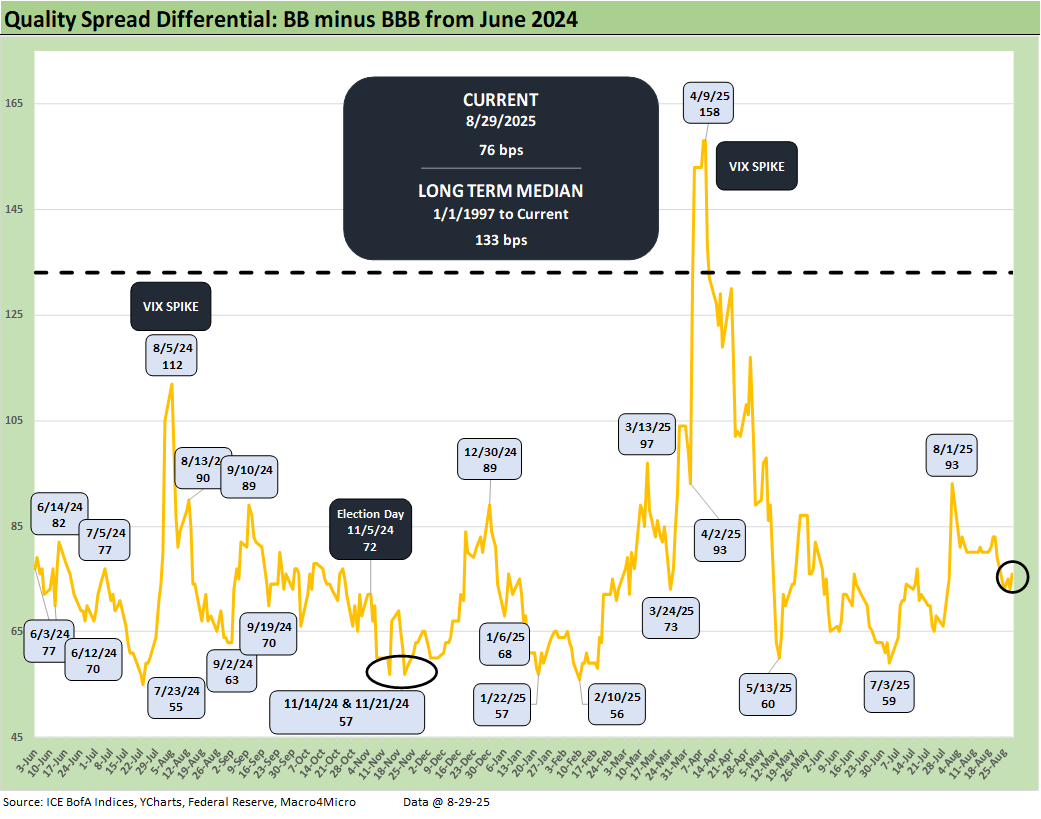
The “BB OAS minus BBB OAS” quality spread differential tightened slightly on the week by -3 bps to +76 bps from +79 bps as the BB tier edged wider by +1 bps with the BBB tier wider by +4 bps.
See also:
PCE July 2025: Prices, Income and Outlays 8-29-25
2Q25 GDP: Second Estimate, Updated Distortion Lines 8-28-25
Avis Update: Peak Travel Season is Here 8-27-25
Durable Goods July 2025: Signs of Underlying Stability 8-26-25
Toll Brothers Update: The Million Dollar Club Rolls On 8-26-25
New Home Sales July 2025: Next Leg of the Fed Relay? 8-25-25
Credit Markets: Dull Week for Spreads 8-25-25
The Curve: Powell’s Relief Pitch 8-24-25
Footnotes & Flashbacks: Asset Returns 8-24-25
Mini Market Lookback: The Popeye Powell Effect 8-23-25
Existing Home Sales July 2025: Rays of Hope Brighter on Rates? 8-21-25
Home Starts July 2025: Favorable Growth YoY Driven by South 8-19-25
Footnotes & Flashbacks: Credit Markets 8-18-25
Herc Holdings Update: Playing Catchup 8-17-25
Footnotes & Flashbacks: State of Yields 8-17-25
Mini Market Lookback: Rising Inflation, Steady Low Growth? 8-16-25
Industrial Production July 2025: Capacity Utilization 8-15-25
Retail Sales Jul25: Cautious Optimism in the Aisles 8-15-25
PPI: A Snapshot of the Moving Parts 8-14-25
CPI July 2025: Slow Erosion of Purchasing Power 8-12-25
Iron Mountain Update: Records ‘R’ Us 8-11-25
Mini Market Lookback: Ghosts of Economics Past 8-9-25
Macro Menu: There is More Than “Recession” to Consider 8-5-25
Mini Market Lookback: Welcome To the New World of Data 8-2-25
Happiness is Doing Your Own Report Card 8-1-25
Payrolls July 2025: Into the Occupation Weeds 8-1-25
Employment July 2025: Negative Revisions Make a Statement 8-1-25
Employment Cost Index 2Q25: Labor in Quiet Mode 7-31-25
2Q25 GDP: Into the Investment Weeds 7-30-25
2Q25 GDP: First Cut of Another Distorted Quarter 7-30-25
United Rentals: Cyclical Bellwether Votes for a Steady Cycle 7-29-25


