
Home Starts July 2025: Favorable Growth YoY Driven by South
Home Starts posts favorable sequential and YoY for total, single family and multifamily.


Affordable housing remains a major supply problem.
The South region comprises over 61% of single family starts and drove the results in July with a similar effect on total starts. The South comprises 58% of total starts including multifamily.
Some easing of mortgage rates lately has fueled optimism and could help the new home sales roll into the fall somewhat better than the builder guidance from the June quarter earnings season.
The multifamily starts numbers remained lumpy with another big month after June’s strength and not long after a late spring plunge in May.
We have seen the Homebuilder ETF (XHB) mounting a very strong comeback in recent periods (see Footnotes & Flashbacks: Asset Returns 8-16-25).
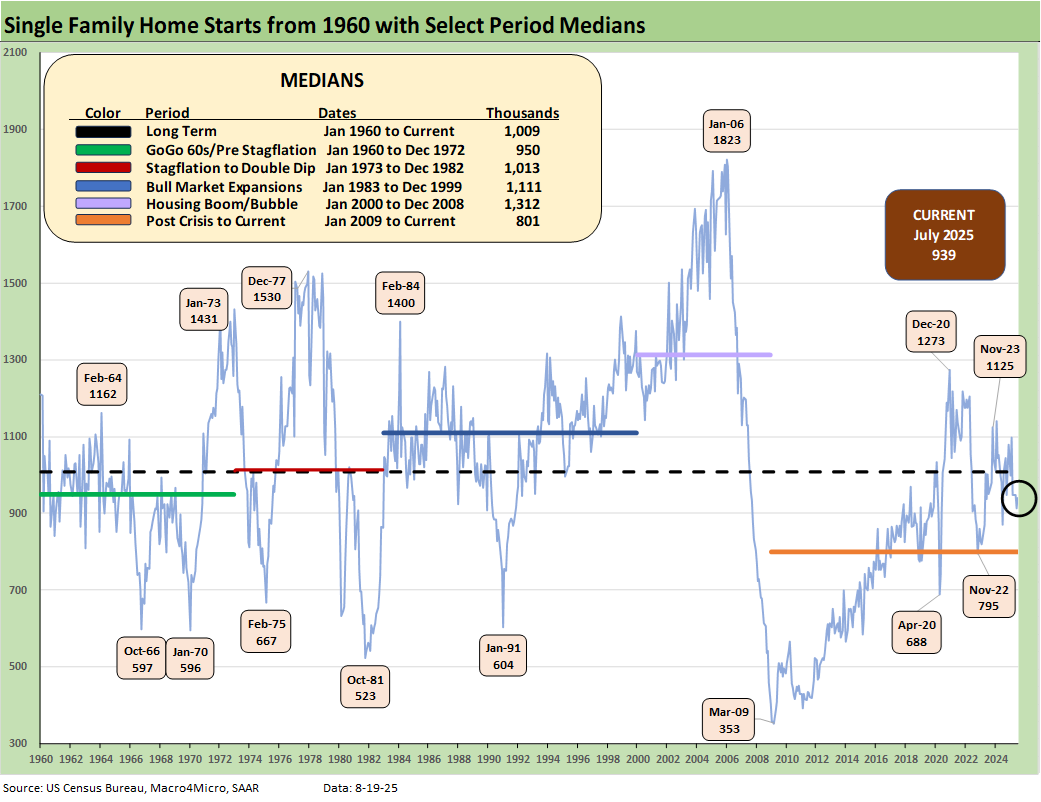
The above chart includes some major revisions of prior months (reflected in the above chart), and they show materially higher starts than last month’s release. Presumably nobody gets fired this week since major revisions in many economic metrics are routine. For example, last month’s starts for single family was detailed at 883K, and that was revised up to 913K with this latest release.
The trend line is not overly distorted, but the absolute numbers were notably higher. Simple solution: work with what you have in hand that constitutes the best efforts available delivered by high quality objective personnel with intellectual standards appropriate to the job.
Housing starts are important of course, but they don’t wag the headlines (or the Fed) like payroll numbers that fall under the Fed dual mandate. When you have enormously challenging data sets in the world’s 3rd most populous country and the #1 economy with a massive housing stock, surveys and models can always use more budget, more people and more tech. Starve that and you get what you deserve.
Of course, the alternative is to put in people who will manage the numbers to a White House goal. That would distort resource allocation (bad economics), mislead the markets (lead to mispricing and distorted stock and bond prices) and would effectively lie to the voters. The compounding risk there would be that only low-quality personnel would accept jobs in such an environment. On a grander scale, that would lead to dollar flight and low confidence in more investment in the US – the core of the tariff goals. Nobody outside Washington likes bad data with capital on the line.
By the numbers…
The current 939K for single family starts is detailed in the chart above along with the trend line across the cycles. The July single family starts tally was higher by +2.8% MoM and up by +7.8% YoY. Separately, total starts overall were +5.2% MoM with Multifamily at+11.6% MoM after a big increase sequentially in June following a big decline in May. Multifamily starts were up by +27.4% YoY in July with its usual volatile lumpy pattern.
The South region at 61% of single family starts (SAAR) was +13.2% MoM and +21.8% YoY while the West as the #2 region was -7.1% MoM and -13.7% YoY. The Midwest was -15.0% MoM for single family and -2.3% YoY. The Northeast market was -8.3% from May and -5.2% YoY.
The homebuilder June quarter reporting season saw a lot of soft guidance across many (not all) homebuilders (see links at bottom). The financial priority of the homebuilders is prudent working capital management with a balance of starts vs. sales/deliveries. Toll Brothers reports its earnings after the close today and will conduct its earnings call tomorrow morning. Toll always comes with the asterisk of being a high price luxury player.
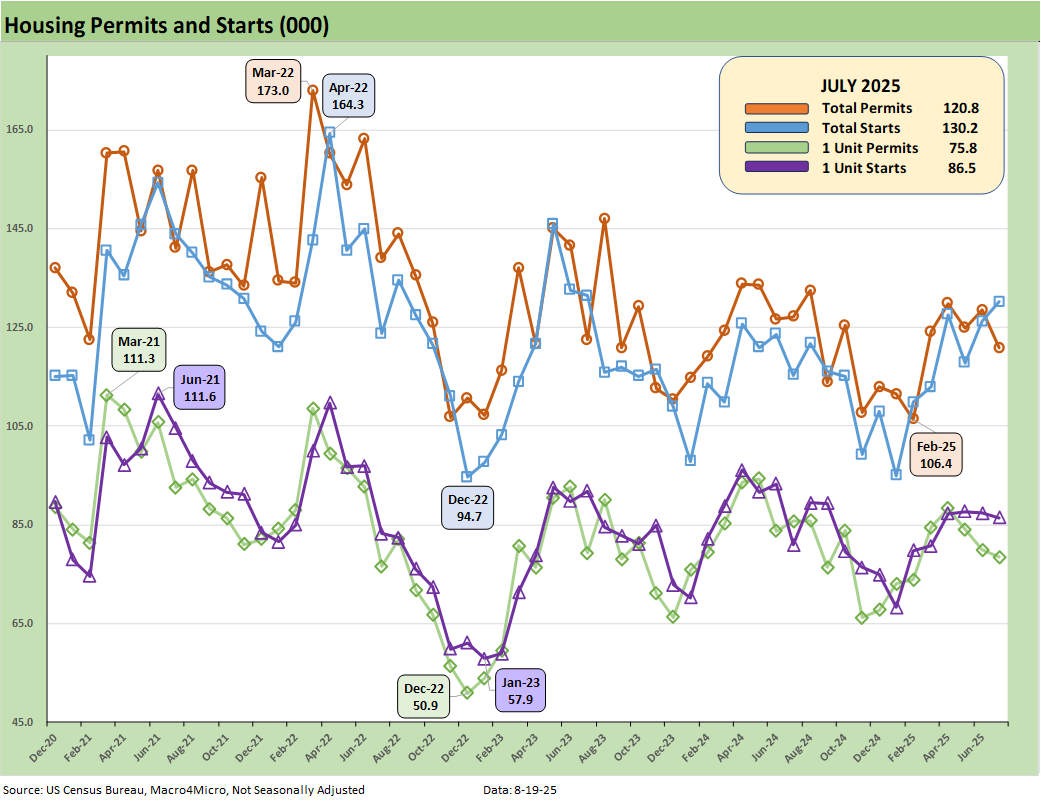
The above chart plots total permits and total starts on a Not Seasonally Adjusted (NSA) basis, and we see NSA total permits lower in July (-6.0%) but single family permits only down by -1.8% for July. NSA Year-to-Date permits were -3.5% for total permits and a decline of -5.8% for single family permits for YTD July. NSA is viewed as closer to what is going on in the trenches without the SAAR model assumptions.
For total starts and single family starts on an NSA basis, we see total starts higher (+3.2%) MoM and single family slightly lower (-1.0%). The YTD NSA starts is +1.6% for total and -4.2% for single family.
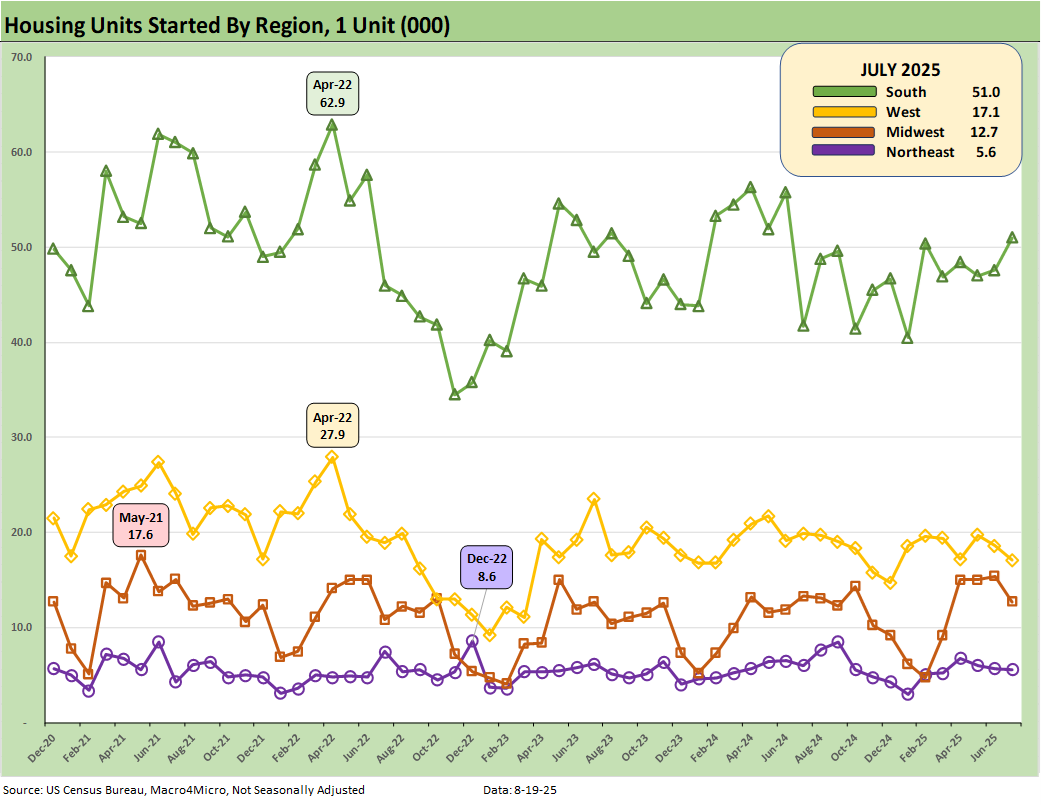
The above plots the single family starts by region on an NSA basis. The two largest regions (South and West) saw the South higher and the West slightly lower in the NSA numbers. The Midwest moved lower, and the small Northeast market slightly lower.
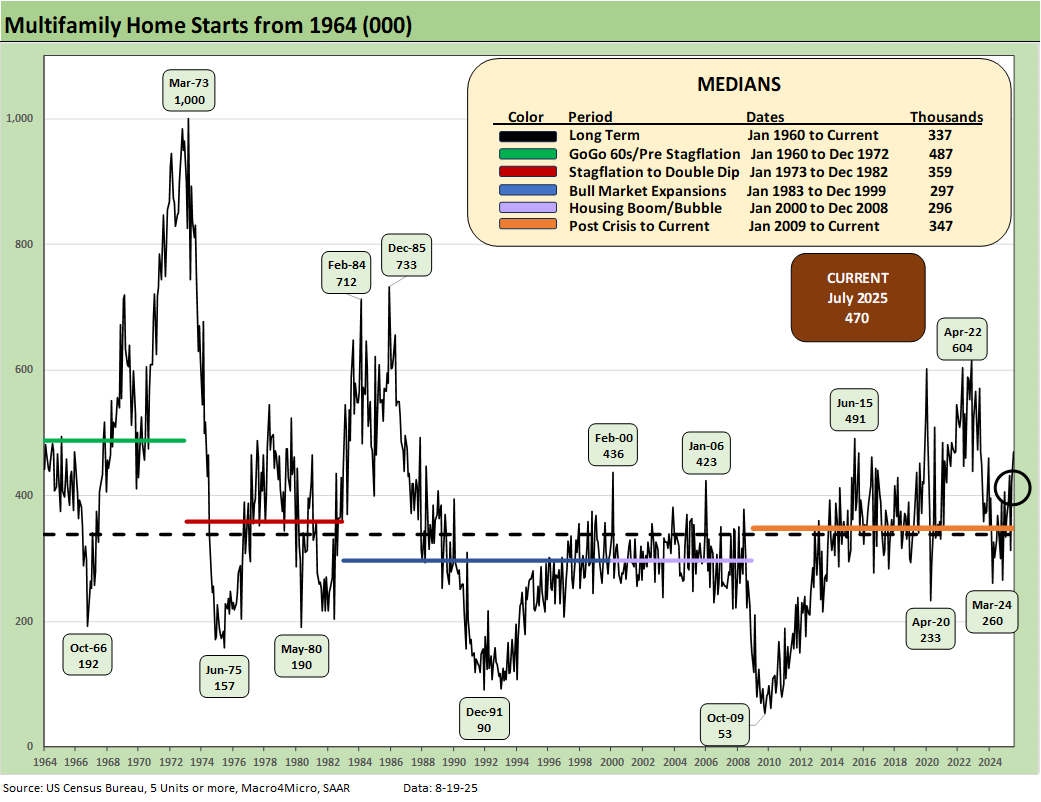
The above chart updates running multifamily starts. At +470K (SAAR), July 2025 rose by 11.6% sequentially and up by +27.4% YoY. The 470K is impressively above the long-term median of 337K, above the median from Jan 2009 to current (347K), and above the median from 2000 to 2008 (296K).
The 1960s was a boom period for multifamily with the postwar explosion of urbanization and high racial migration from the south to the north. On an NSA basis (not shown), the YTD multifamily starts is +18.1%.
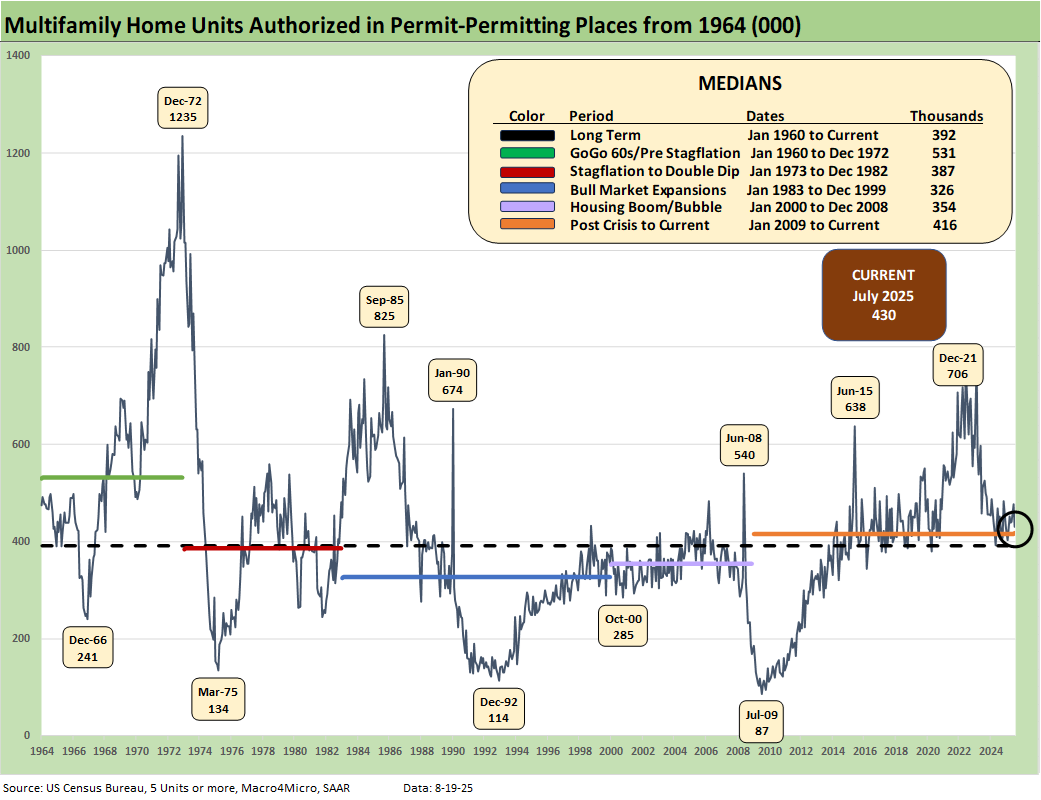
The above chart updates Multifamily permits (SAAR). The 430K is down in July by -9.9% MoM and down by -1.8% YoY. The YTD change on an NSA basis for permits (not shown) is +1.4%.
Housing sector:
New Home Sales June 2025: Mixed Bag 7-24-25
Existing Home Sales June 2025: The Math Still Doesn’t Work 7-23-25
Housing Starts June 2025: Single Family Slips, Multifamily Bounces 7-18-25
Homebuilders:
Taylor Morrison 2Q25: Resilient but Feeling the Same Macro Pressure 7-25-25
PulteGroup 2Q25: Still-Lofty Margins see a Mild Fade 7-23-25
D.R. Horton 3Q25: Material Slowdown Still Good Enough 7-22-25
KB Home 2Q25: Negative Industry Trends Keep Coming 6-25-25
Lennar 2Q25: Bellwether Blues 6-20-25
Credit Snapshot: Meritage Homes (MTH) 5-30-25
Homebuilder Rankings: Volumes, Market Caps, ASPs 5-28-25
Credit Snapshot: PulteGroup (PHM) 5-7-25
Credit Snapshot: Toll Brothers 5-5-25
Credit Snapshot: D.R. Horton (DHI) 4-28-25
Credit Snapshot: Lennar (LEN) 4-15-25
Credit Snapshot: Taylor Morrison Home Corp (TMHC) 4-2-25
Lennar: Cash Flow and Balance Sheet > Gross Margins 3-24-25
KB Home 1Q25: The Consumer Theme Piles On 3-25-25
Toll Brothers 1Q25: Performing with a Net 2-20-25
Credit Crib Note: Lennar Corp (LEN) 1-30-25