
Mini Market Lookback: Rising Inflation, Steady Low Growth?
Macro releases delivered news of increasing inflation but also some stability in the consumer and industrial sector.


Tariffs: the dismal science of economics meets double entry accounting.
Tighter spreads in credit ran alongside a solid performance by equity benchmarks in positive range that even saw small caps and midcaps beating the NASDAQ and S&P 500 (including 7 of 11 S&P 500 sectors with positive returns).
The CPI and PPI tag team delivered adverse directional news on inflation but with CPI below the “worry level.” That set off a rally in stocks in what was a negative week for duration with the PPI delivering what could only be seen as bad monthly numbers (see CPI July 2025: Slow Erosion of Purchasing Power 8-12-25, PPI: A Snapshot of the Moving Parts 8-14-25).
The main macro data in the form of Retail Sales and Industrial Production was reassuring even if soft releases like Consumer Sentiment moved in a negative direction again (see Industrial Production July 2025: Capacity Utilization 8-15-25, Retail Sales Jul25: Cautious Optimism in the Aisles 8-15-25).
The UMichigan survey declined sharply (a surprise to consensus) with another rise in forward 1-year inflation expectations to 4.9% from 4.5%. Even if such inflation numbers are unrealistic and would require an oil spike to hit (Russia and Iran the wildcards in both directions), the survey speaks to the tenuous mindsets of consumers on inflation risk. We see more inflation increases ahead on tariffs.
Among highlights during the week on the policy front, semiconductor tariff talk from Trump included the number 300% being tossed around, and the lack of market reaction to that underscores the increasingly dulled senses that have been overwhelmed by tariff sensory overload and disinformation that has turned the topic purely partisan. As we have cited in our tariff research, the “dismal science” of economics and the unforgiving nature of double-entry accounting will still rule as the months go by. Tariffs require a price or expense action for the buyer who “writes the check.”
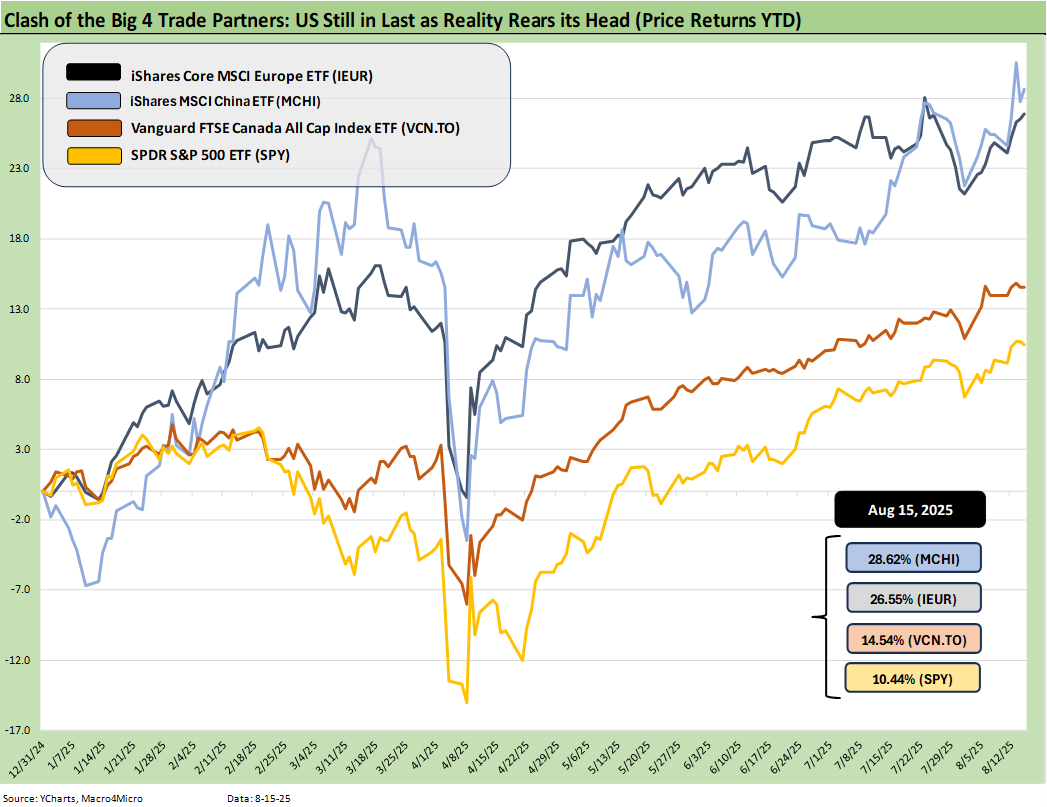
The above chart updates our timeline for the clash of the Big 4 trading partners. We use ETFs that reflect a broad cross-section of market index benchmarks, but we go easy on the US by just using the S&P 500 index ETF (SPY). That lets the US off the hook by not including small caps and midcaps.
We don’t include Mexico in the time series since it comes with an emerging market asterisk for most investors, but the major Mexico ETF we watch would be near the top of this chart. The time series offers a reality check on the limits of the headline “new highs” vs. recent actual total returns YTD. The Golden Age may be on the way, but it is not in the YTD comps.
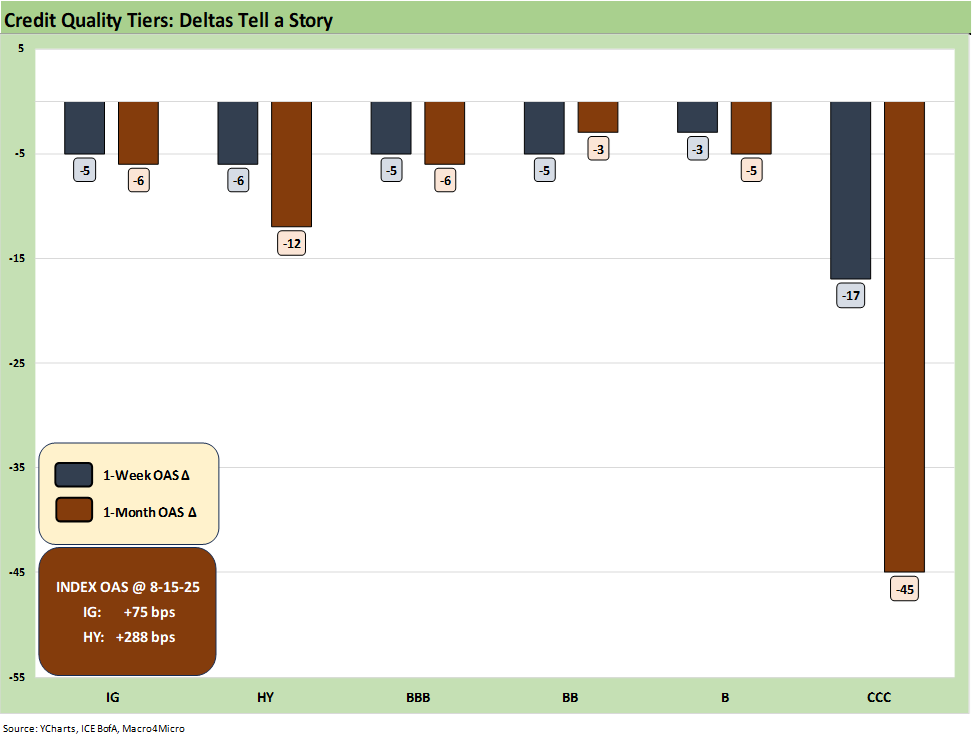
We see another good week for credit risk with the 1-week and 1-month spread deltas for IG and HY posted above along with the credit tiers from BBB to CCC. The +288 bps for HY is in the June 2007 bubble zone while the +75 on IG takes us back below the +77 bps HY OAS low hit twice in 4Q24 and below the +79 bps of March 2005. The low point in the historical timeline we track is Oct 1997 at +53 bps (see Footnotes & Flashbacks: Credit Markets 8-11-25).
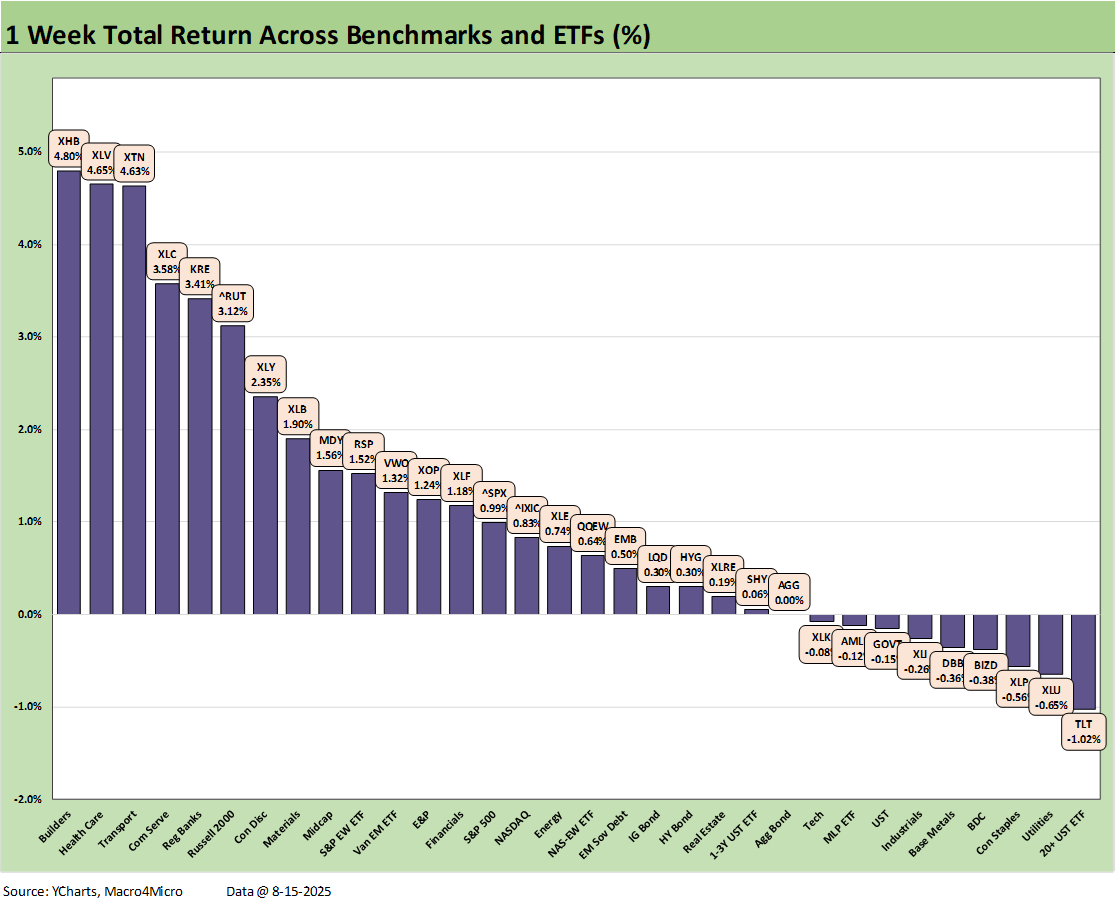
The 1-week returns across our group of 32 benchmarks and ETFs rang up a 23-8 score with 1 ETF (AGG) at zero. We see the UST steepening this week hit the long duration UST ETF (TLT) and send it to the bottom of the rankings with the UST ETF (GOVT) also in the bottom quartile. Strong credit markets supported LQD, HYG, and EMB while the short UST 1-3Y (SHY) was barely across the line with AGG at 0%.
The Homebuilder ETF (XHB) continues its comeback attempt at #1 with 30Y mortgages lower on the week as mortgage rates fought the tape that saw higher 10Y UST. Health Care (XLV) and Transports (XTN) fought their way back after struggling during 2025. Both XLV and XTN faced tough headwind during 2025 as we break out in our Footnotes publication on asset returns to be updated and posted later this weekend.
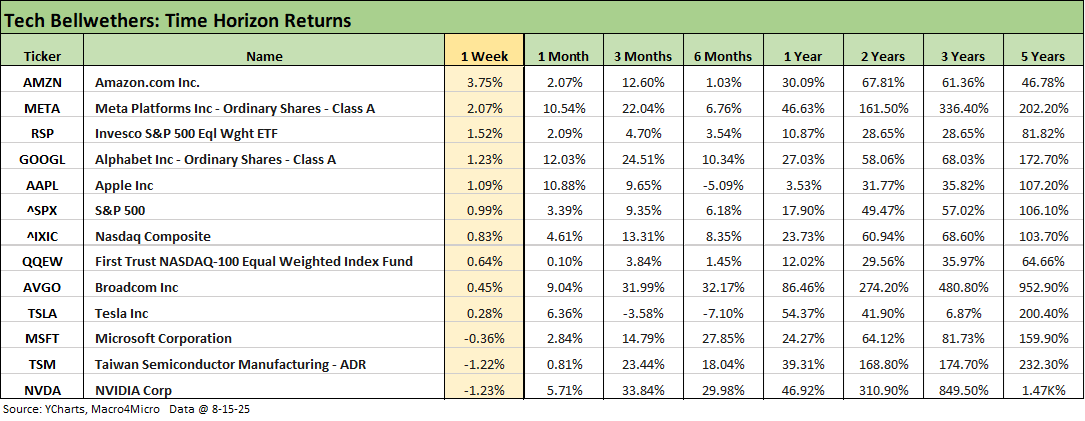
The tech bellwethers are broken out above and lined up in descending order of returns for the week. We see 4 of the Mag 7 ahead of the broad market benchmarks (S&P 500, NASDAQ) and 3 below. NVDA is on the bottom and slightly in the red and Microsoft is also in the red.
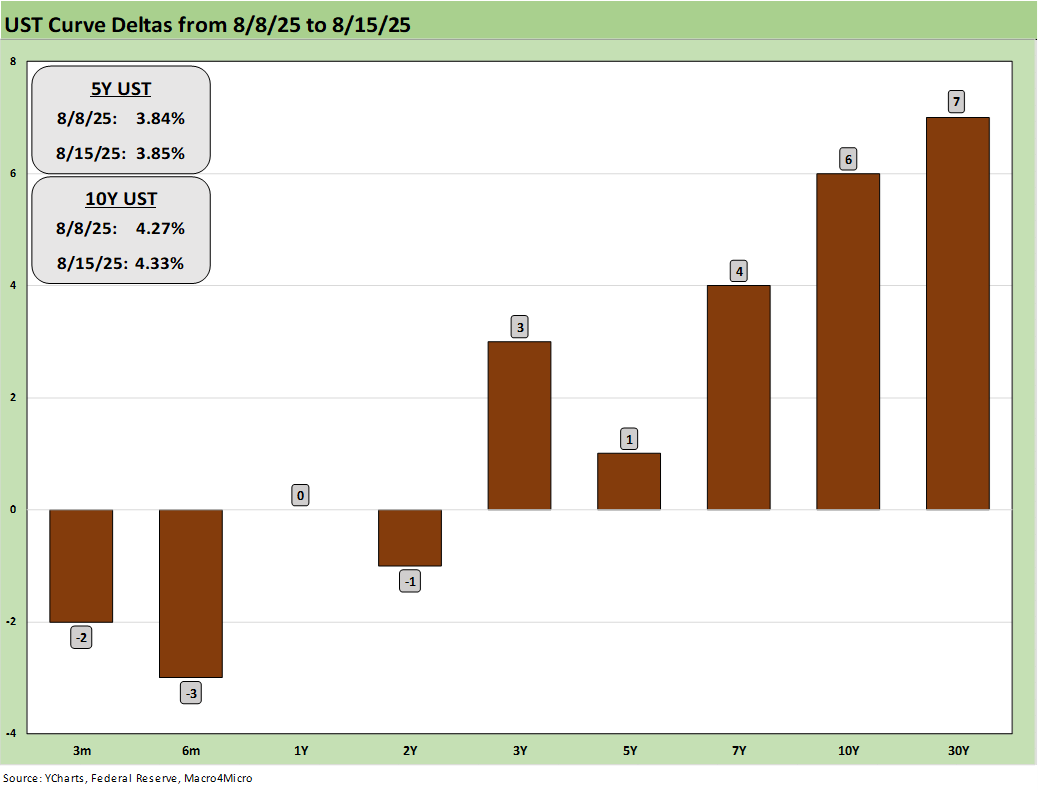
The above chart breaks out the 1-week UST deltas, and we see a modest bear steepener on the week.
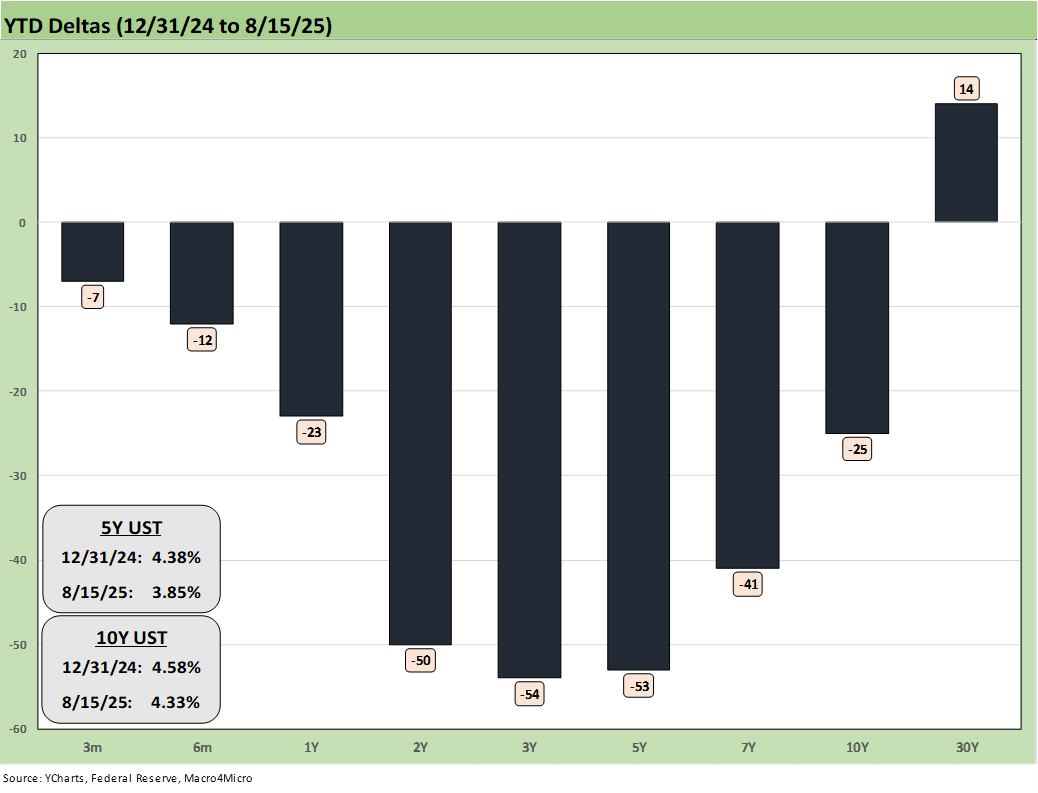
The YTD UST deltas still show a modified bull steepener with the 30Y UST remaining somewhat in its own world as an inflation indicator. As cited earlier, the long duration UST ETF (TLT) was the worst performer in our group of 32 benchmarks and ETFs.
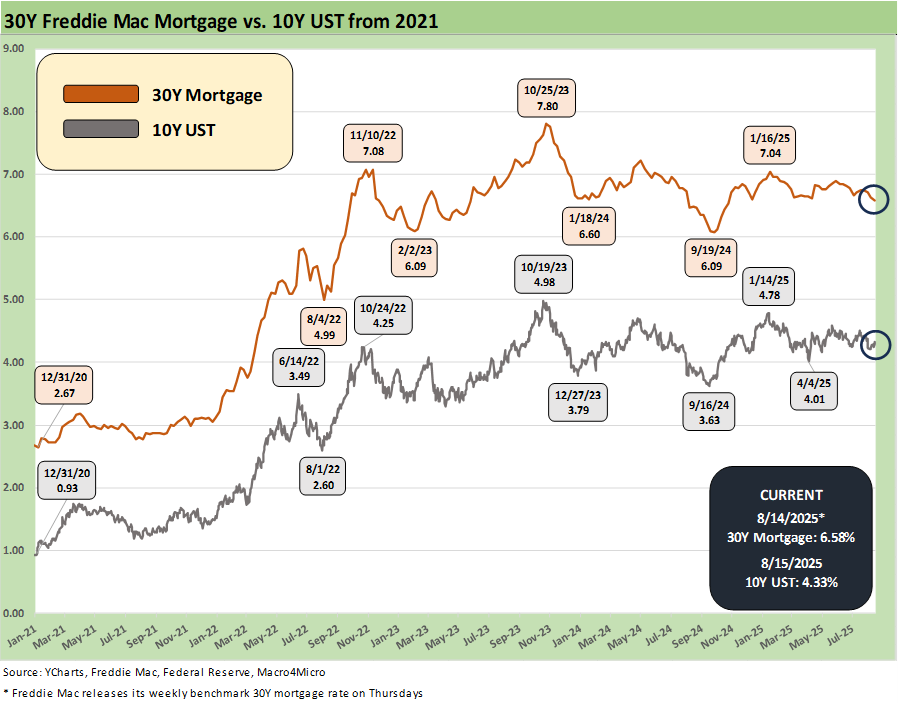
The above chart updates the running time series for the Freddie Mac 30Y mortgage benchmark vs. the 10Y UST. Those two are closely intertwined but can diverge occasionally and this was one of those weeks as mortgages dipped down into the 6.5% handle range even as the 10Y UST yield rose.
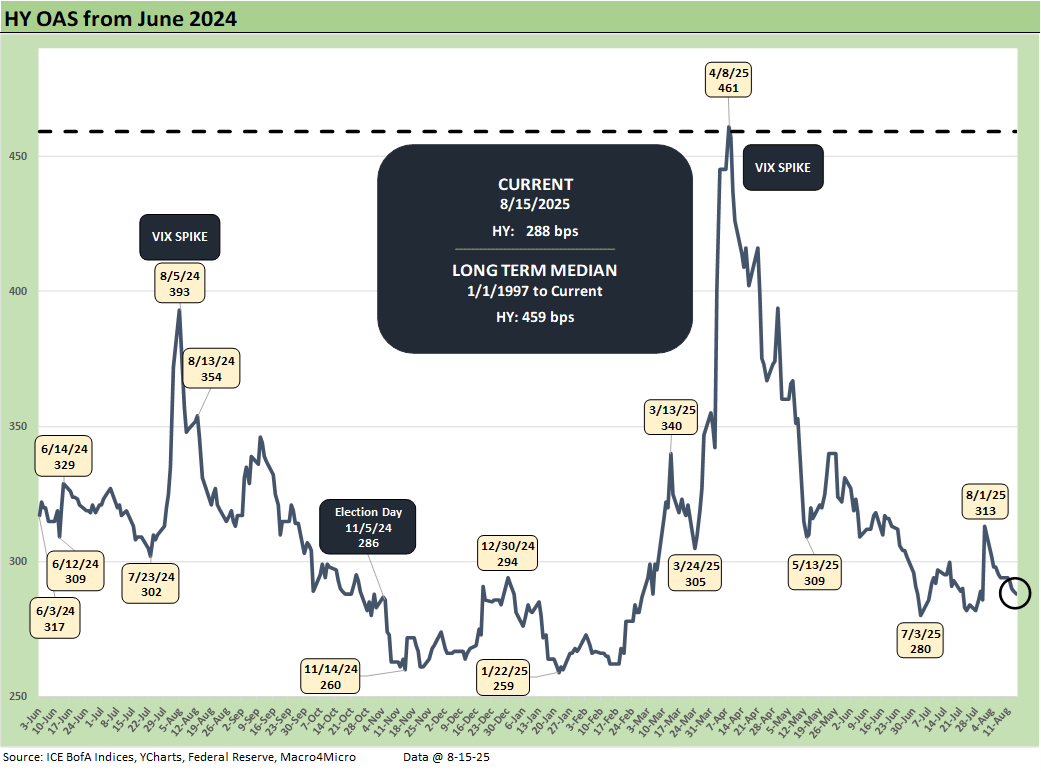
The -6 bps tightening this week took HY OAS to +288 bps or right in the zone of the June 2007 bubble.
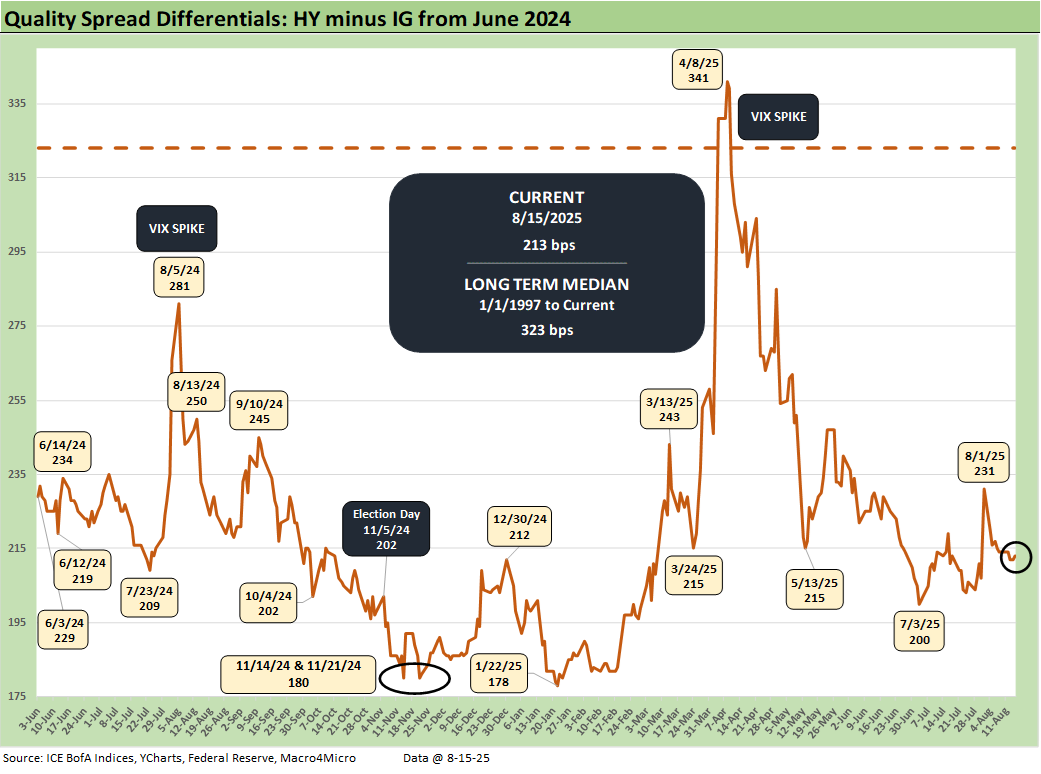
With HY (-6 bps) and IG (-5 bps) both tightening this past week, the HY – IG OAS quality spreads narrowed by only 1 bps to +213 bps.
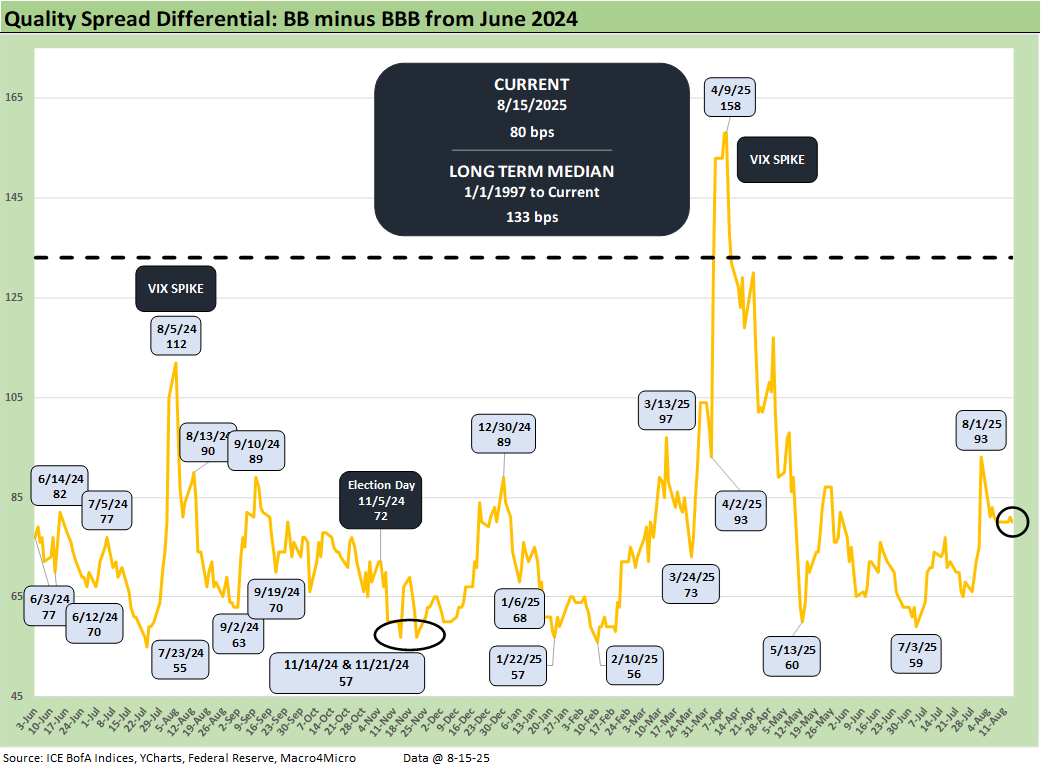
The BB - BBB OAS quality spread differential was unchanged at +80 bps this week as both credit tiers move tighter by -5 bps.
See also:
Industrial Production July 2025: Capacity Utilization 8-15-25
Retail Sales Jul25: Cautious Optimism in the Aisles 8-15-25
PPI: A Snapshot of the Moving Parts 8-14-25
CPI July 2025: Slow Erosion of Purchasing Power 8-12-25
Iron Mountain Update: Records ‘R’ Us 8-11-25
Footnotes & Flashbacks: Credit Markets 8-11-25
Footnotes & Flashbacks: State of Yields 8-10-25
Footnotes & Flashbacks: Asset Returns 8-10-25
Mini Market Lookback: Ghosts of Economics Past 8-9-25
Macro Menu: There is More Than “Recession” to Consider 8-5-25
Mini Market Lookback: Welcome To the New World of Data 8-2-25
Happiness is Doing Your Own Report Card 8-1-25
Payrolls July 2025: Into the Occupation Weeds 8-1-25
Employment July 2025: Negative Revisions Make a Statement 8-1-25
Employment Cost Index 2Q25: Labor in Quiet Mode 7-31-25
PCE June 2025: Prices, Income, and Outlays 7-31-25
2Q25 GDP: Into the Investment Weeds 7-30-25
2Q25 GDP: First Cut of Another Distorted Quarter 7-30-25
United Rentals: Cyclical Bellwether Votes for a Steady Cycle 7-29-25
JOLTS June 2025: Lower Openings and Hires, Higher Layoffs YoY and Flat MoM 7-29
25
Mini Market Lookback: Mixed Week Behind, Big Week Coming 7-26-25
Durable Goods Jun25: Air Pocket N+1 7-25-25
Taylor Morrison 2Q25: Resilient but Feeling the Same Macro Pressure 7-25-25
New Home Sales June 2025: Mixed Bag 7-24-25
Existing Home Sales June 2025: The Math Still Doesn’t Work 7-23-25
PulteGroup 2Q25: Still-Lofty Margins see a Mild Fade 7-23-25
D.R. Horton 3Q25: Material Slowdown Still Good Enough 7-22-25
Mini Market Lookback: Macro Muddle, Political Spin 7-19-25
Housing Starts June 2025: Single Family Slips, Multifamily Bounces 7-18-25