
JOLTS July 2025: Job Market Softening, Not Retrenching
JOLTS numbers show eroding relationship between hires and separations and layoffs.


Job Openings over at ICE? Need to supply own mask.
The decline in job openings has hit over 1/2 million since May, so there is no question the job market is softer. The trick will be gauging the pace of hires for the still-substantial level of openings and what lines actually get filled as tariff cost mitigation actions continue the goal of easing tariff pain. Cost cuts will battle with lower short-term rates and tax bill demand.
Layoffs and discharges were slightly higher sequentially, but 12% above May’s level with Construction and Retail showing some weakness since the spring. The June 2025 layoff numbers saw a major upward revision with the July release. The quits rate remains low at around 2.0%, down from 2.1% YoY.
The latest tariff legal challenge to IEEPA could take some pressure off small business staffing if SCOTUS lets the Appeals Court decision stand with a lot riding on the consumer sector providers targeted by tariffs and damage in the small business sector.
JOLTS reports at a 1-month lag, so we will still look to this coming Friday’s payroll release for a more timely read on how the job market has played out for August. For this month, the stakes are high given the timing of the FOMC meeting but especially with last month’s controversy where Trump decided to sack the BLS head amid justified accusations that Trump is looking to control economic data releases at a time when his economic backdrop is struggling (see Happiness is Doing Your Own Report Card 8-1-25). The challenge is compounded by his nomination of a highly inexperienced ideologue with questionable credentials.
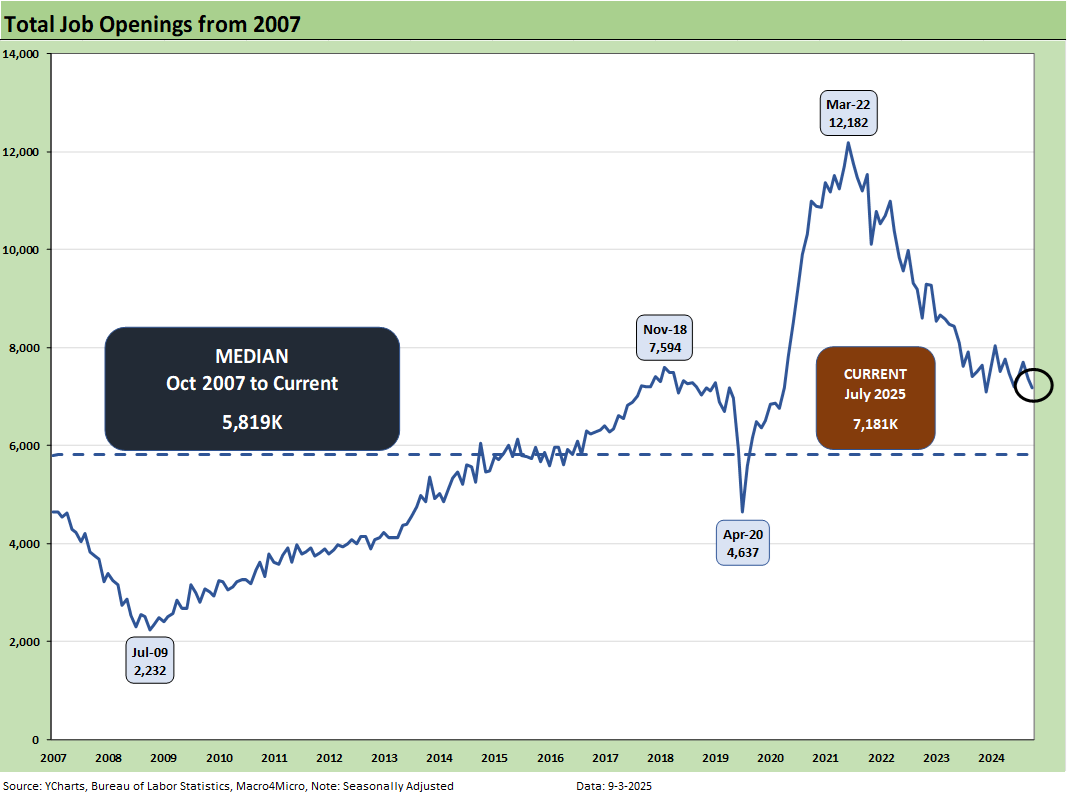
The JOLTS data is not flashing signs of trouble but is weakening in overall context. Job Openings for July were down by -2.3% MoM to 7.18 million, which marks a downtick of -176K. That piles on June’s decrease of -355K (-4.6% revised). That 7.18 million in openings is down -4.3% YoY from 7.50 million in July 2024.
The 7.18 mn represents a sharp decline from 7.71 mn in May 2025 for a running decline of 531K, below the peak of 7.6 mn in Nov 2018 under Trump 1.0, and well off the 12.2 mn peak of March 2022 under Biden.
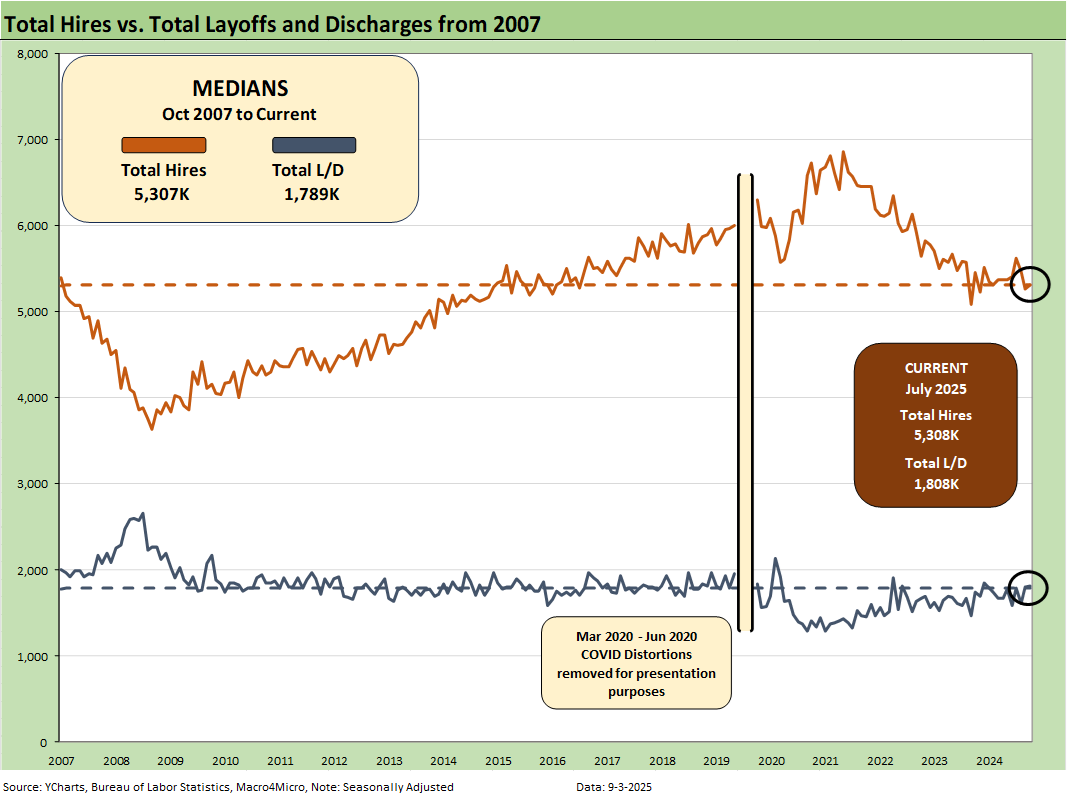
The above chart plots Hires vs. Layoff/Discharges on a SAAR basis. Note: we remove the COVID numbers from several charts to support the visual value for “normal” periods. For COVID distortions, see note at the end of the article.
Hires were up sequentially by +41K, but down by -143K YoY. Gains in Other Services (+86K), Wholesale trade (+27K), and Manufacturing (+21K) were offset by declines in Transportation, warehousing, and utilities (-52K), Leisure and hospitality (-40K), and Accommodation and food services (-30K). Notably, the Northeast showed a significant decrease (-64K) while the South and Midwest posted +41K and +51K, respectively. The West was essentially flat at +14K.
Layoffs/Discharges ticked up slightly by +12K MoM and increased by +63K YoY. MoM increases in Construction (+49K) and Trade, transportation, and utilities (+22K) were offset by decreases in Professional and business services (-130K). Layoffs/discharges in Professional and business services peaked at +545K in June, so July’s decrease is welcome but still 12.7% higher than July 2024. MoM increases in the South (+51K) and Northeast (+46K) were offset especially by a decrease in the West of -76K.
The overall mix signals weakness…
The decline in MoM job openings, only slightly improved hires MoM and rising YoY layoffs/discharges (slight rise MoM) combined with continued tariff confusion (recent Appeals Court decision heading to SCOTUS) present a mixed picture on the broader labor backdrop.
The FOMC has a lot of focus on the labor releases and the weaker sentiment from some sectors such as in the Manufacturing ISM report this week. Further, as companies rapidly move to integrate AI agents, the “AI vs. labor” debate continues and will be a major topic especially in Services and broader admin roles in any sector.
Entry level and lower-level job threats seem to be coming up in the commentary more frequently of late, but more than a few are axed to highlight that secular trend for AI valuations. Directional convictions are one thing on the AI trade and economic impact, but the question will be magnitude and pace. That process will take time.
Some tariff advocates cite AI productivity and AI as a substitute for labor as a restraint on inflation risk. That remains subject to a longer-term test in the markets. In the meantime, that may clash with the price of electricity and the cost of materials and labor to expand the power grid, among other large scale investment programs. Nothing is ever as simple as it seems.
The mix of payroll moves is still not a signal to the FOMC to rush out and ease rates until the tariff inflation risks – now even more up in the air - have more supportive data points. The market and Fed projections have been calling for two cuts this year. That is still on the table. If the Appeals Court decision on tariffs stands, the Fed will be more likely to ease on the theory that tariffs were at the root of their inflation fear. The question is still, “by how much?” with Trump screaming for 300 bps.
On a separate note, the IEEPA tariffs were expected to mitigate tax cut and spending provisions in the Big Beautiful Bill. We’ll see if SCOTUS continues to live in Trump’s back pocket and how that tariff revenue line will influence the UST curve shape and level. Will get some answers very soon on the Fed reactions in the dot plot and SEP report with the updated forecast. The answers on the tariff side (even outside the IEEPA tariffs) will take longer well into 2026.
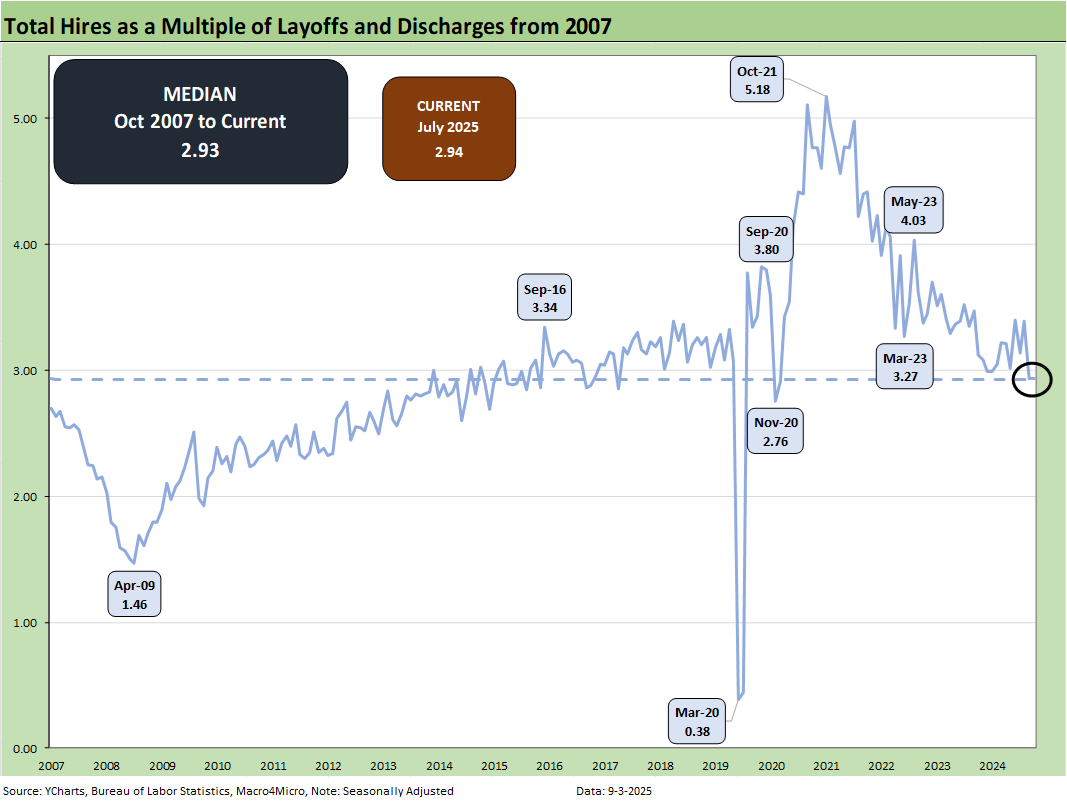
The above chart updates the ratio of Hires to Layoffs/Discharges. The relationship moved significantly lower this month from 3.24 to 2.94 just in line with the long-term median of 2.93 from 2007. The post-2007 period includes the longest recession since the Great Depression (Dec 2007 – June 2009) followed by the longest expansion from June 2009 to COVID (Feb 2020).
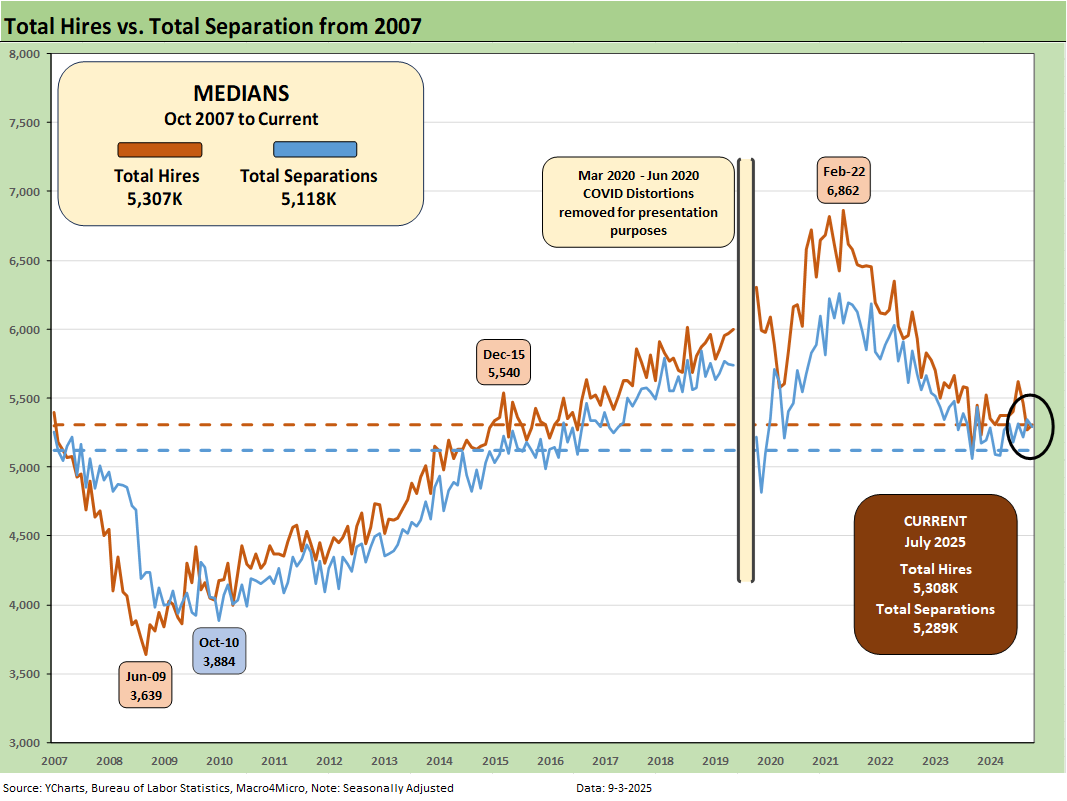
The above chart plots Hires vs. Total Separations on a SAAR basis. Separations include Quits, Layoffs/Discharges, and “Other Separations.” Total Separations were lower by -51K (-0.9%) sequentially and down -2.7% YoY.
For July, “Other Separations” made a big move lower by -63K (-18.8%) MoM to 272K from the June peak of 335K and moved down -9.3% YoY.
We typically do not find “Total Separations” particularly interesting as a multi-line net number. But “Other Separations” could get more interesting in a world of mass deportation when people are getting “disappeared.” Did they “quit” by not showing up for work or did they get “othered?” There is also the uncertainty of how the de facto labor force gets measured and how many are “off the books.”
Overall, the ICE numbers have been low versus election rhetoric but the visuals of armed masked men with no IDs along with the violent removal process has been a toxic political flashpoint. As the year goes on, those questions could become more important.
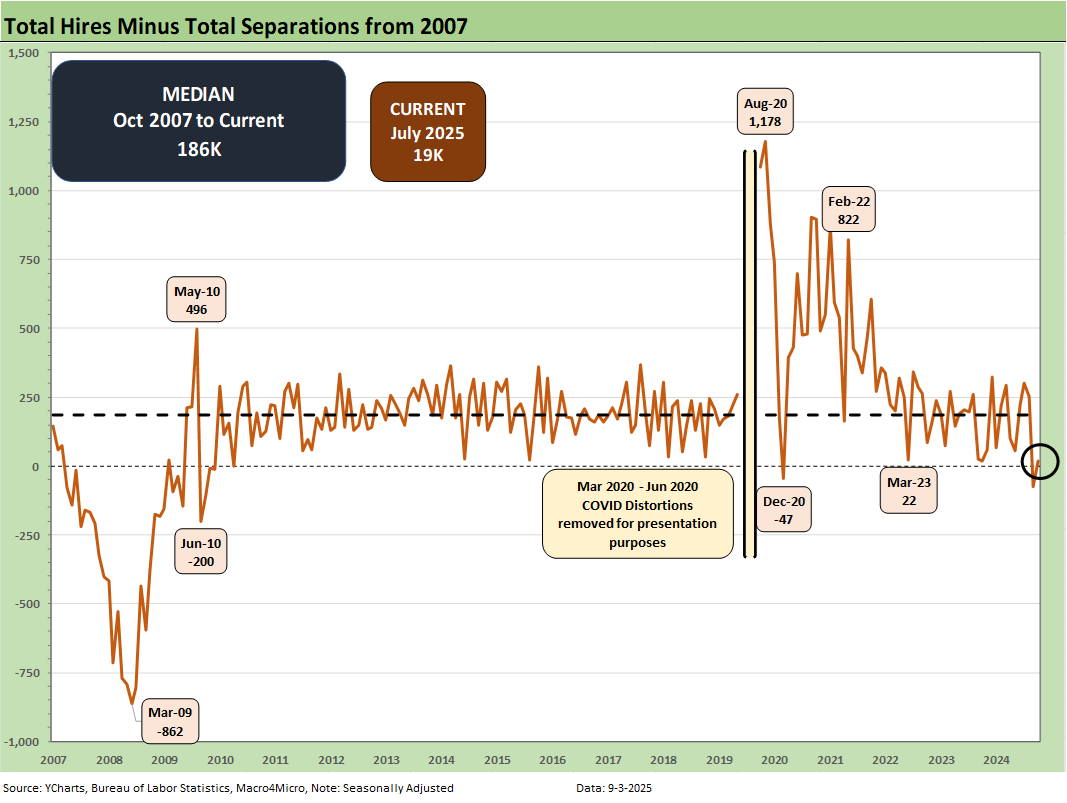
The Hires minus Total Separations differential is plotted above. We saw some major revisions of last month’s Separations meaningfully higher. Layoffs/Discharges for June were revised upward by 192K, so that offers another negative data point in payroll trends. For July, Hires increase +41K and Total Separations moved lower by -52K. The net number above moved notably lower MoM to +19K and is now well below the long-term median of +187K.
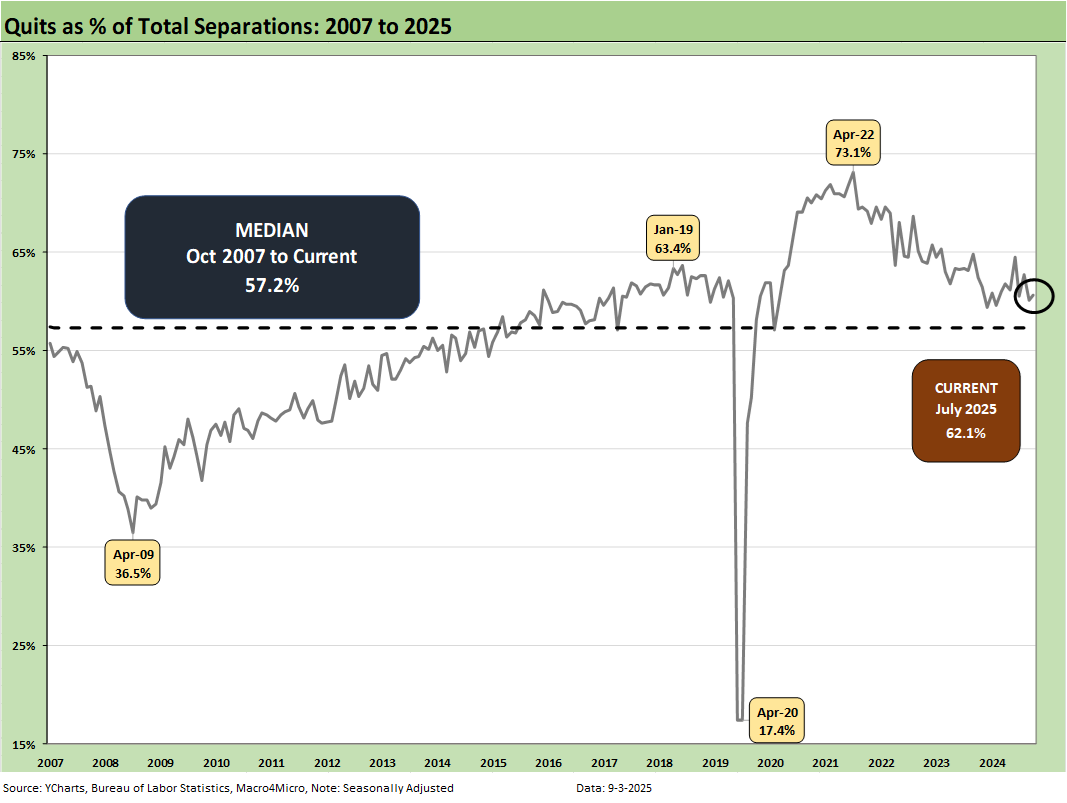
The time series for Total Quits as a % of Separations (SAAR basis) moved lower MoM to 62.1% from 62.8% and is above the long-term median of 57.2%. The classic “Quits Rate” is measured by Total Quits as a % Total Employment, and that metric was flat on the month at 2.0%. The Quits rate is down slightly from 2.1% to 2.0% YoY.
NOTE ON COVID DISTORTIONS
The Hires vs. Separations time series make for interesting numbers but tough charts to plot visually given how much the spike in Separations/Hiring during COVID distorted the numbers from March 2020 to June 2020. The swings literally were off the charts. For presentation purposes, we adjust the charts above to exclude the raw data for those months to get a better vantage point on somewhat more normal times. Compared to COVID, the credit crisis seems “normal” in terms of the job count moves.
For disclosure purposes, Separations across March 2020 (16.3 million), April 2020 (11.6 million), May (4.7 million), and June (5.2 million) were running against Hires in March (5.2 million), April (4.0 million), May (8.1 mi/lion), and June (7.4 ml/lion). We remove those from the charts to get better scale visuals on the periods that precede and follow as the market saw 50-year lows in unemployment in 2022. Wild swings were had by all as industries saw shutdowns and layoffs in the COVID recession. The long-term medians from 2007 to 2022 for Hires and Separations were very close.
Almost 28 million Separations combined in March-April 2020 was a brutal reminder of that period.
See also:
Hertz Update: Viable Balance Sheet a Long Way Off 9-3-25
Credit Markets: Will the Heat Matter? 9-1-25
The Curve: Risk Tradeoff - Tariffs vs. UST Supply 9-1-25
Footnotes & Flashbacks: Asset Returns 8-31-25
Mini Market Lookback: Tariffs Back on Front Burner 8-30-25
PCE July 2025: Prices, Income and Outlays 8-29-25
2Q25 GDP: Second Estimate, Updated Distortion Lines 8-28-25
Avis Update: Peak Travel Season is Here 8-27-25
Durable Goods July 2025: Signs of Underlying Stability 8-26-25
Toll Brothers Update: The Million Dollar Club Rolls On 8-26-25
New Home Sales July 2025: Next Leg of the Fed Relay? 8-25-25
The Curve: Powell’s Relief Pitch 8-24-25
Mini Market Lookback: The Popeye Powell Effect 8-23-25
Existing Home Sales July 2025: Rays of Hope Brighter on Rates? 8-21-25
Home Starts July 2025: Favorable Growth YoY Driven by South 8-19-25
Herc Holdings Update: Playing Catchup 8-17-25
Mini Market Lookback: Rising Inflation, Steady Low Growth? 8-16-25
Industrial Production July 2025: Capacity Utilization 8-15-25
Retail Sales Jul25: Cautious Optimism in the Aisles 8-15-25
PPI: A Snapshot of the Moving Parts 8-14-25
CPI July 2025: Slow Erosion of Purchasing Power 8-12-25
Iron Mountain Update: Records ‘R’ Us 8-11-25
Mini Market Lookback: Ghosts of Economics Past 8-9-25
Macro Menu: There is More Than “Recession” to Consider 8-5-25
Mini Market Lookback: Welcome To the New World of Data 8-2-25
Happiness is Doing Your Own Report Card 8-1-25
Payrolls July 2025: Into the Occupation Weeds 8-1-25
Employment July 2025: Negative Revisions Make a Statement 8-1-25
Employment Cost Index 2Q25: Labor in Quiet Mode 7-31-25
2Q25 GDP: Into the Investment Weeds 7-30-25
2Q25 GDP: First Cut of Another Distorted Quarter 7-30-25
United Rentals: Cyclical Bellwether Votes for a Steady Cycle 7-29-25