
Mini Market Lookback: Ugly Week in America, Mild in Markets
In a week where political violence took the headlines, CPI and PPI combined for a slight negative on the inflation story.


Zero point zero: Washington’s GPA on “turning down the temperature.”
The past week saw a 25-7 score on positive vs. negative returns for the 32 benchmarks and ETFs we track. All bond ETFs were positive, and the long duration UST ETF (TLT) made it into the top quartile alongside the NASDAQ and S&P 500. The small cap Russell 2000 faded into the third quartile and Midcaps ended up in the bottom quartile. The 11 S&P 500 sectors saw 9 positive, 1 negative and 1 flat (0%).
Credit spread moves were very mild and biased tighter while the UST handicapping now overwhelmingly favors -25 bps in Sept, Oct, and Dec. Employment seems to be taking over the front burner in the FOMC kitchen. That said, inflation and tariffs (SCOTUS IEEPA appeal) remain critical to the UST curve shapeshifting risk and revisiting a potential steepener of the sort seen after the Sept 2024 easing and 100 bps across Sept to Dec of 2024.
The inflation metrics of CPI and PPI this week balanced out to a slight negative as a warmer CPI was set against a surprisingly muted PPI. The worsening payroll worries, another mild slide in consumer sentiment, and some under-the-headlines deterioration in the trade dynamics are carrying the day for the UST bulls right now (see CPI August 2025: Slow Burn or Fleeting Adjustment? 9-11-25, PPI Aug 2025: For my next trick… 9-10-25).
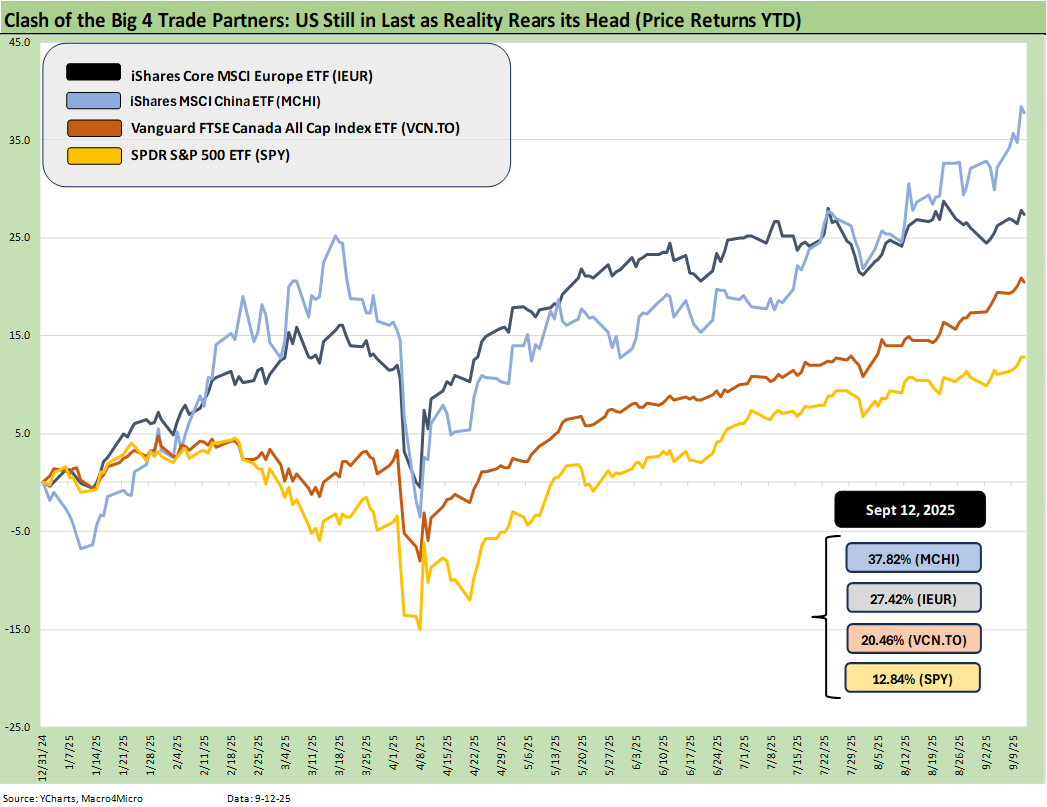
The above updates the YTD returns for some bellwether index ETFs for the Big 4 developed market trading partners – the US, Europe, China, and Canada. The aim is to plot some ETFs that tell a story for US investors thinking about global diversification. These ETFs are just a useful sample that uses relevant broad market indexes for each region as snapshots.
The goal is to capture the balance of risks across the broad mix of macro trends (economy, currency) and the sea level industry and company fundamentals rolled up into a US traded ETF. For the US, we used the S&P 500 ETF (SPY). In other words, we go easy on the US given the mixed performance of small caps and midcaps across 2025 to date.
The result is clear enough in this diversified mix of assets. The US remains in last place. That is not much for bragging rights at a time when many global investors and national leadership ranks are already quite annoyed with the direction of US policy.
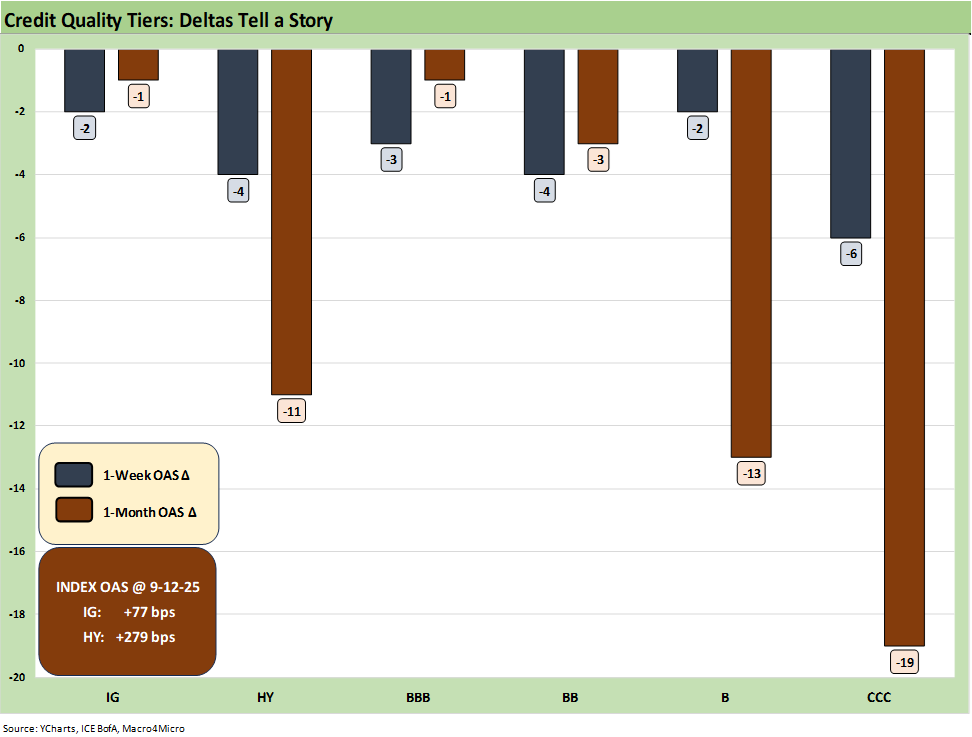
The above table updates the spread deltas for 1-week and 1-month across IG and HY and from BBB to CCC. The week was very quiet and the 1-month moves still reflect the tightening of quality spreads and constructive demand for HY even with spreads in the June 2007 zone.
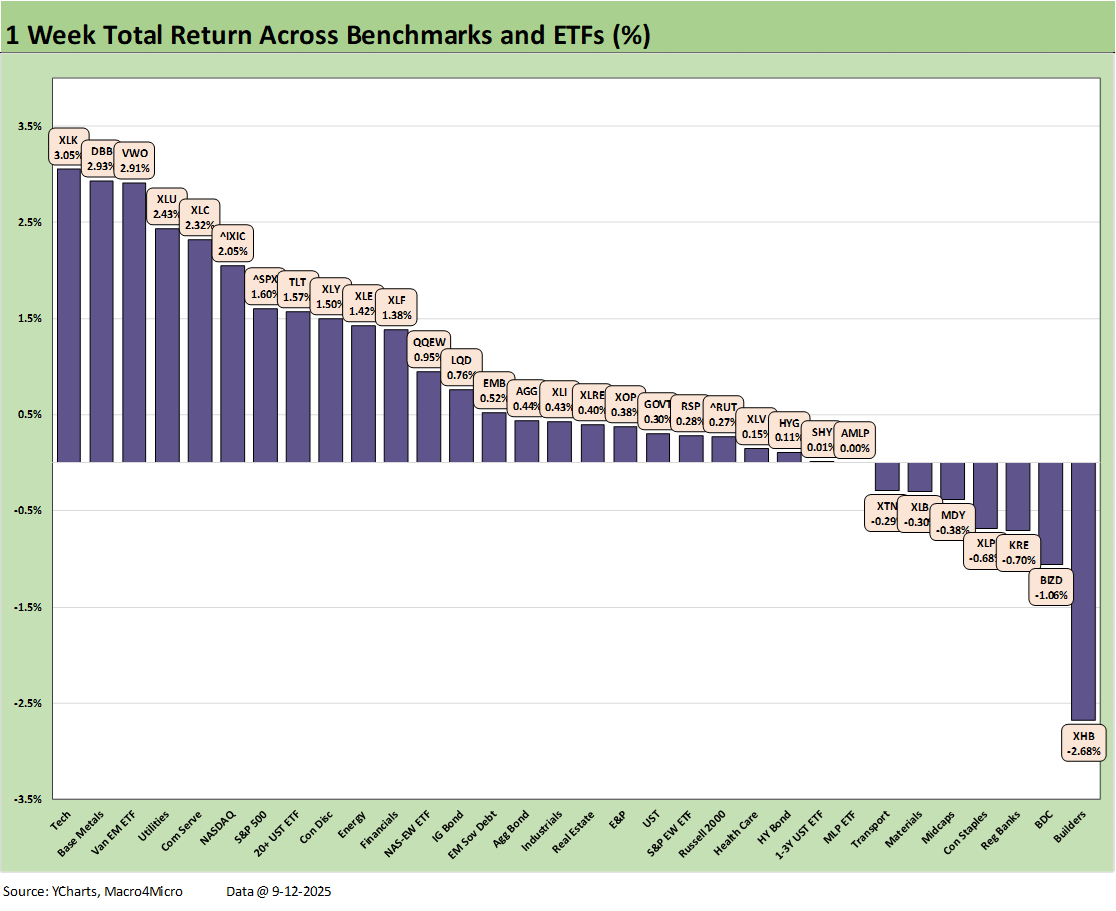
The above chart details the 1-week returns for the 32 benchmarks and ETFs with a score of 25 positive vs. 7 negative. We see the Homebuilder ETF (XHB) post a bad week after a period where the sector was mounting a strong comeback in 2025 after a very rough period since 4Q24. That followed an LTM period ending in 3Q24 when XHB was #1 in the group. We see a tech heavy top quartile.
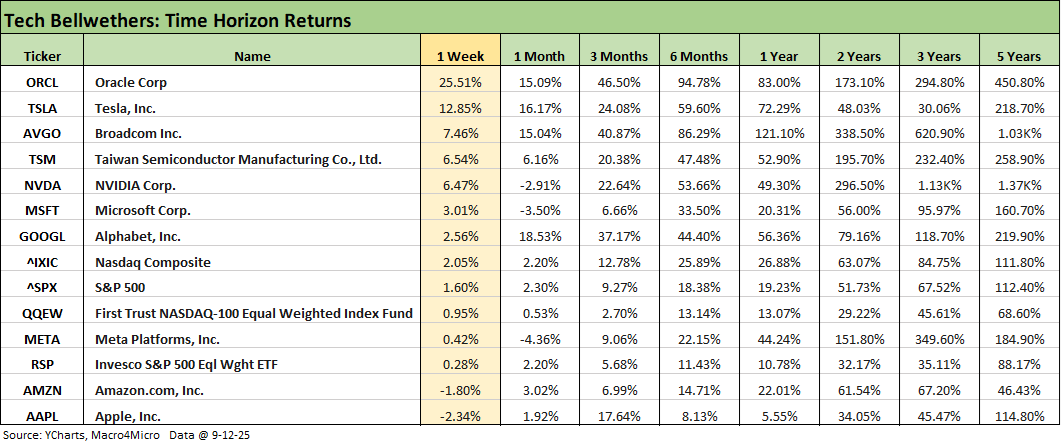
The above chart updates the tech bellwethers with Oracle being the story of the week after their earnings report and related details. We added ORCL to this table as of this week. The +25% week for ORCL is dazzling for a company now in the Top 10 S&P 500 rankings for market caps.
Oracle (ORCL) and Broadcom (AVGO) may have to lobby for new designation criteria on “Magnificent.” Looking back 6 months and 1 year for those two, they are at the top of the leaderboard. Broadcom is modestly ahead of NVIDIA over 2 years, but NVIDIA obviously takes the 3-year crown.
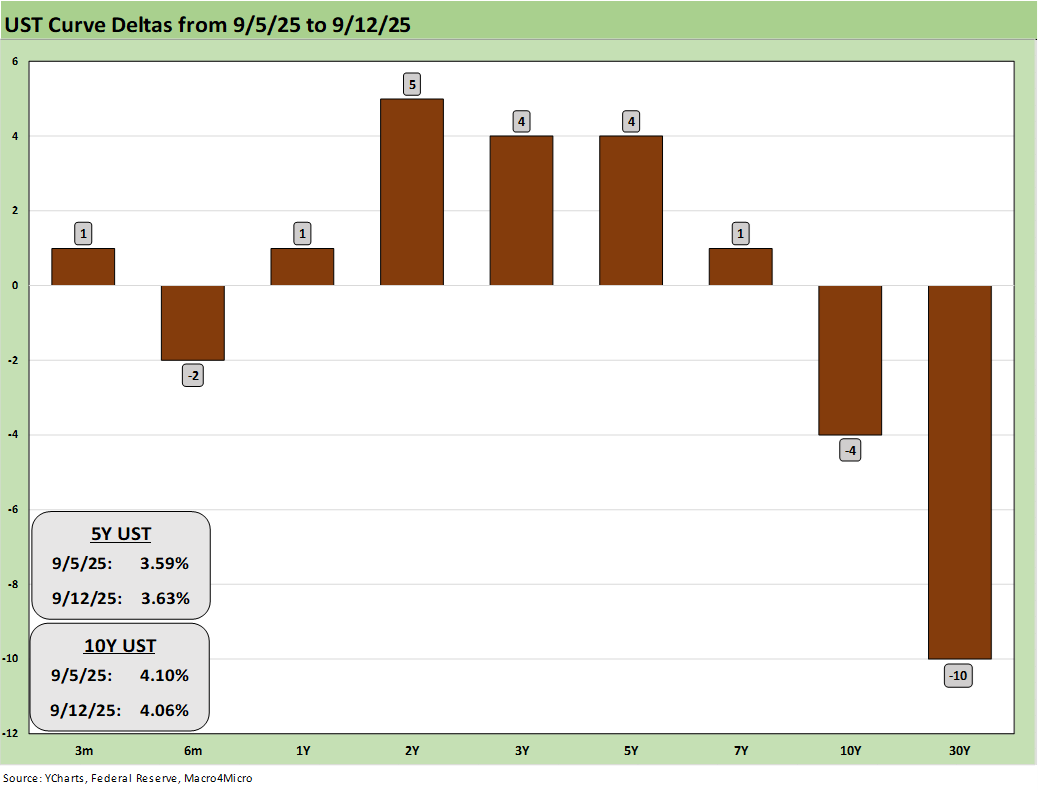
The above chart shows the UST deltas for the week. The sharp move lower in 30Y UST is a welcome respite after the long end had been stubborn across 2025 and steepening risk remains a worry. The small rise in 2Y to 5Y bucked the optimism around more cuts to come.
The high probability of 2 cuts for the year that had already been in the numbers recently saw some chatter of -50 bps in Sept. The -50 bps move may be facing even more pushback with a warmer CPI print despite the mild PPI. The odds of 1 cut next week is now over 93% (CME FedWatch) with 1 cut in October at 79%, and a single cut in December now at 74%.
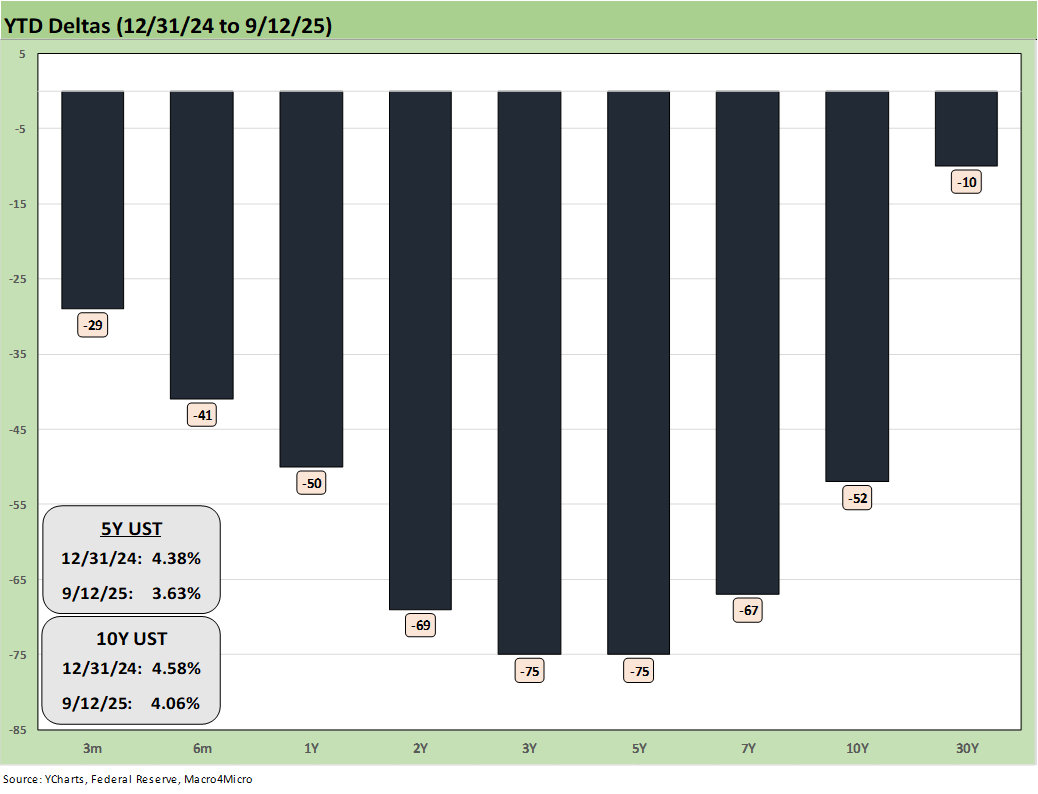
The above chart updates the YTD UST delta and highlights why all the bond ETFs are generating positive returns this year despite stubborn inflation and record borrowing needs.
The supply side of the UST funding equation is in somewhat of a state of uncertainty as the market awaits a decision on IEEPA from SCOTUS and what that means for UST supply. That UST supply question is tied to any combination of limited tariff revenue if IEEPA is shot down (in turn higher borrowing needs) or to the refund risk given what has been collected under that tariff program.
Meanwhile, the tariff flow-through effects on payrolls will drag well into 2026 with so much more to come (Section 232, etc.) even though tariff fans want to end the debate right now and declare victory. That is all politics and light on economics since the expense and pricing cycles take quarters and not months.
In debating tariff effects, it is too often the case where commentators ignore the virtual certainty of higher expense impacts. Sometimes tariff advocates get around that by assuming it is wholly offset by price cuts granted by the seller. The process flows into economic cyclical risk (including consumer and small business reactions) and tariff-cost-mitigation strategies that could include expense reduction, slower investment, and reduced payrolls. That means the clashing impact of modest inflation with job pressures. That complicates the FOMC decisions.
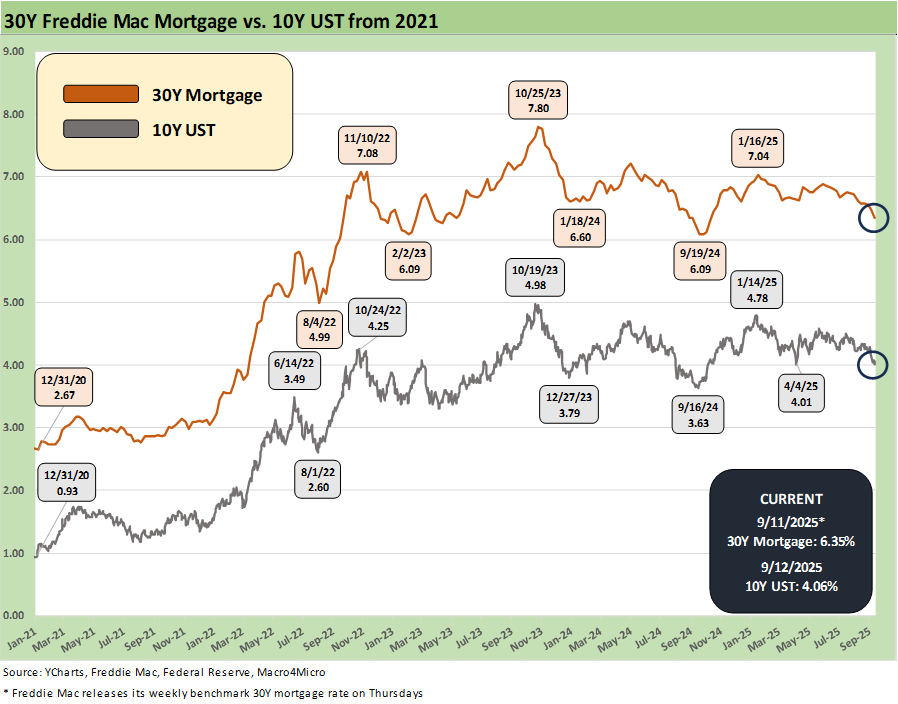
The above chart details the path of the 10Y UST and Freddie 30Y mortgage, which is set on Thursdays. By Friday close, the Mortgage News Daily survey was at 6.29% for 30Y. Mortgage rates are getting back into a comfort zone for refinancing and homebuilder incentive programs to have more effect. We look at those topics in our housing sector research. We get Home Starts this coming week with the following week bringing Existing Home Sales and New Home Sales.
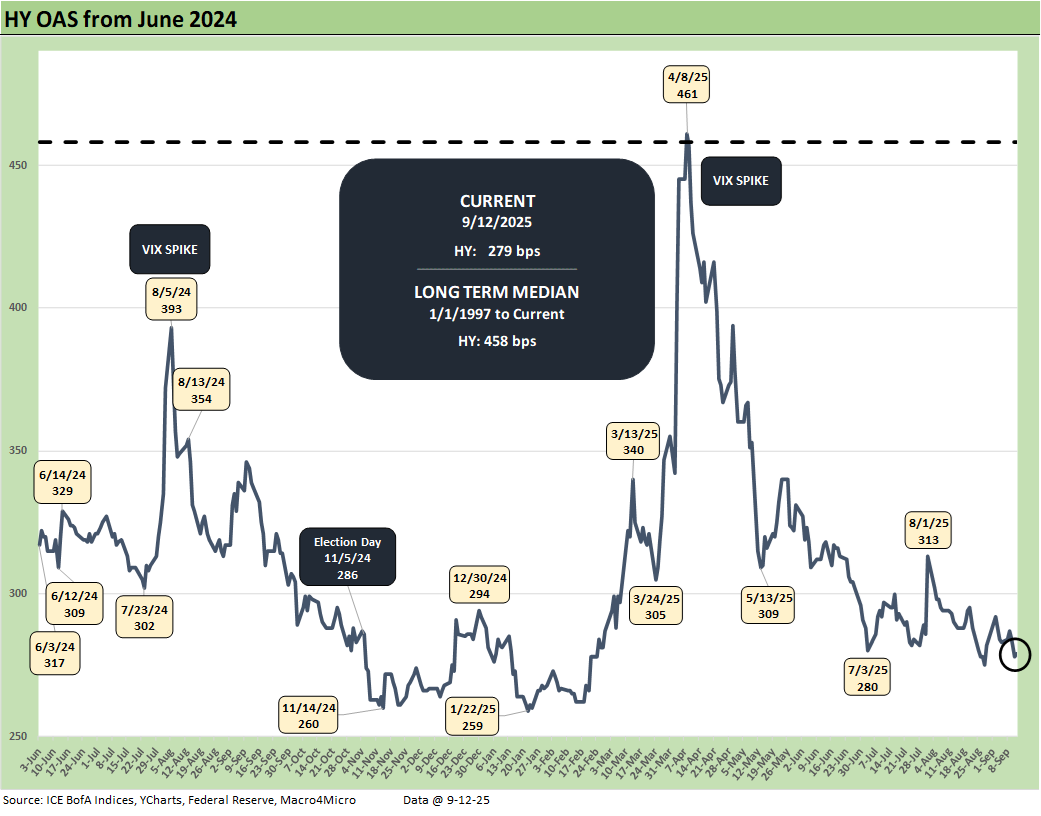
The above chart plots the HY OAS from June 2024, and we see a -4 bps move tighter on the week to +279 bps from +283 bps. That HY index OAS is still in the bubble zone of June 2007.
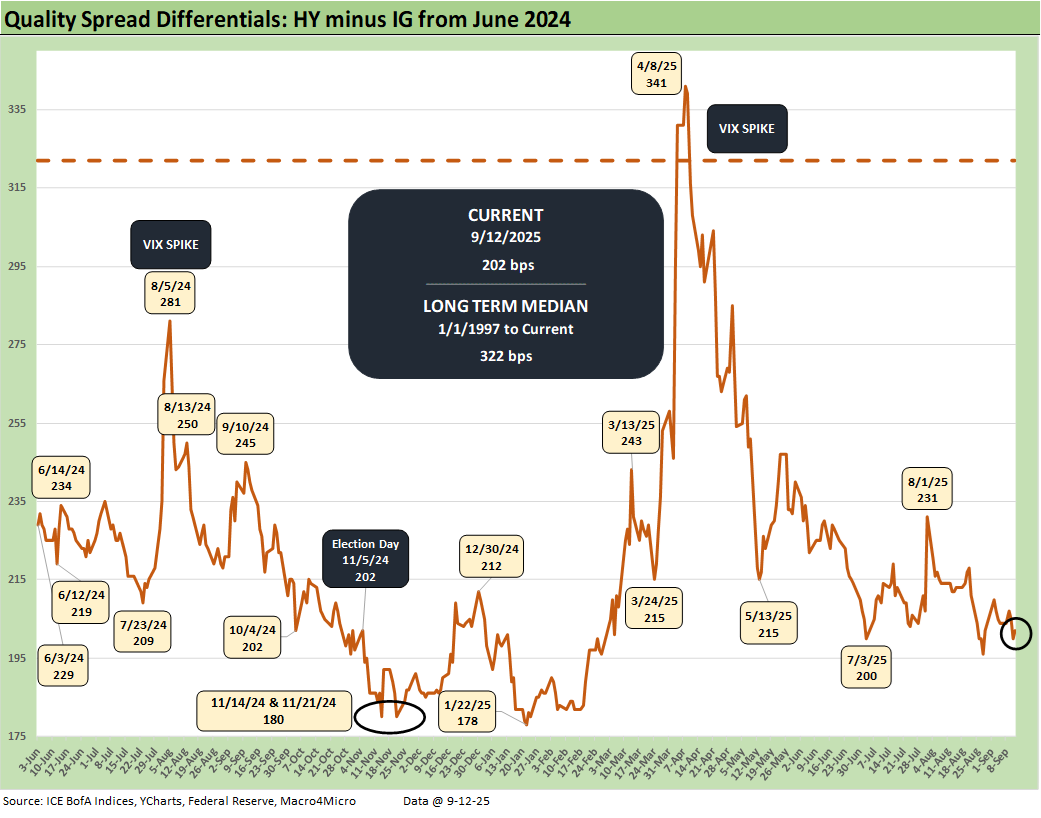
The above chart updates the quality spread differentials for HY vs. IG with “HY OAS minus IG OAS” -2 bps tighter on the week to +202 bps with HY -4 bps tighter and IG -2 bps tighter.
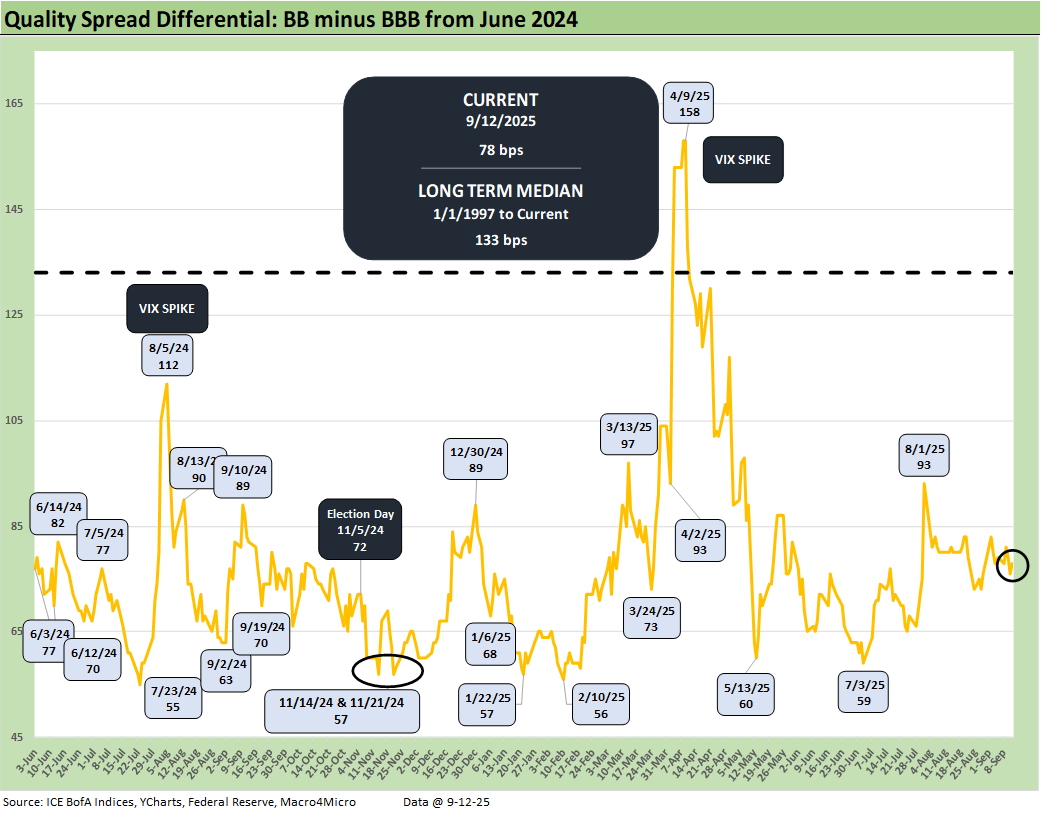
The above chart shows the “BB OAS minus BBB OAS” quality spread differential tightened by -1bps to +78 bps over the week with the BB tier -4 bps tighter and the BBB tier -3 bps tighter. The BBB vs. BB OAS differential remains wide to the early July level around +59 bps and +56 bps in Feb 2025.
See also:
CPI August 2025: Slow Burn or Fleeting Adjustment? 9-11-25
PPI Aug 2025: For my next trick… 9-10-25
Credit Markets: Spread Risk Lurks, but the World Waits 9-8-25
The Curve: The Road to Easing has been Long. 9-8-25
Footnotes and Flashbacks: Asset Returns 9-6-25
Mini Market Lookback: Job Trends Worst Since COVID 9-6-25
Payrolls Aug 2025: Into the Weeds 9-5-25
Employment August 2025: Payroll Flight 9-5-25
JOLTS July 2025: Job Market Softening, Not Retrenching 9-3-25
Hertz Update: Viable Balance Sheet a Long Way Off 9-3-25
The Curve: Risk Tradeoff - Tariffs vs. UST Supply 9-1-25
Mini Market Lookback: Tariffs Back on Front Burner 8-30-25
PCE July 2025: Prices, Income and Outlays 8-29-25
2Q25 GDP: Second Estimate, Updated Distortion Lines 8-28-25
Avis Update: Peak Travel Season is Here 8-27-25
Durable Goods July 2025: Signs of Underlying Stability 8-26-25
Toll Brothers Update: The Million Dollar Club Rolls On 8-26-25
New Home Sales July 2025: Next Leg of the Fed Relay? 8-25-25
The Curve: Powell’s Relief Pitch 8-24-25
Mini Market Lookback: The Popeye Powell Effect 8-23-25
Existing Home Sales July 2025: Rays of Hope Brighter on Rates? 8-21-25
Home Starts July 2025: Favorable Growth YoY Driven by South 8-19-25
Herc Holdings Update: Playing Catchup 8-17-25
Mini Market Lookback: Rising Inflation, Steady Low Growth? 8-16-25
Industrial Production July 2025: Capacity Utilization 8-15-25
Retail Sales Jul25: Cautious Optimism in the Aisles 8-15-25
PPI: A Snapshot of the Moving Parts 8-14-25
CPI July 2025: Slow Erosion of Purchasing Power 8-12-25
Iron Mountain Update: Records ‘R’ Us 8-11-25
Mini Market Lookback: Ghosts of Economics Past 8-9-25
Macro Menu: There is More Than “Recession” to Consider 8-5-25
Mini Market Lookback: Welcome To the New World of Data 8-2-25