
Payrolls Aug 2025: Into the Weeds
We look at the occupational details in the weak August payroll numbers with manufacturing deepening the slide in 2025.


If this continues, we may have to go in…
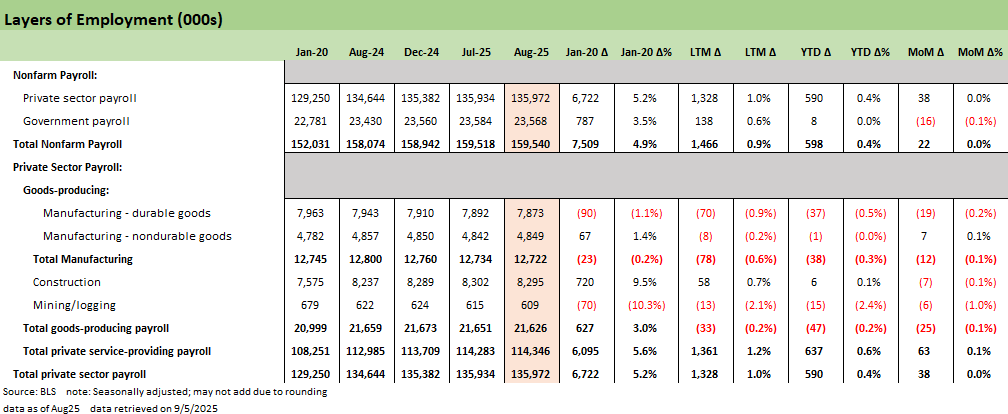
Nonfarm payrolls rose a meager +22K in August, adding pressure on the cooling labor market signals that started with last month’s major revisions. Private sector contributed +38K as State and Federal declines led to Government shedding -16K jobs.
With so many infrastructure and project commitments across the big tech, AI, and data center wave, the absence of growth for manufacturing calls into question the benefits of those investments – at the very least with respect to timing and magnitude for the AI customers.
Trump moved the goalposts this morning to next year with this report and under the rule of “the best is yet to come.” Though that could be the case, plant construction across numerous subsectors takes much more than a year with the tariffs falling under the heading of “now or soon.” We also cannot ignore the uncertainty of the IEEPA challenge and how that might challenge planning and confidence in the inputs to evaluate project economics. If Trump loses the “big gun” of IEEPA that gives Trump de facto unlimited “tariff ammo,” he could lose the ability to threaten and coerce with tariffs just by saying “emergency.” He could see trade partners backpedal on “commitments” that seem to be different subject to which side is talking. That range of outcomes slows the process. Even without IEEPA, there are a lot of tariff dollars on the table (and on the expense line).
Jobs lag and even contract in some cases…
The current environment sees Durable goods manufacturing (-19K), nondurables (-5K), and construction (-2K) all down this month. The influence of tariff policy towards increasing domestic manufacturing has backfired for now as the increased input pricing and uncertainty has muddied the economics of capex planning – and notably timing. The need to execute on tariff cost mitigation strategies can easily hit payrolls or deter additions.
Healthcare and social assistance are the major stabilizing factors for this year’s labor market at over 80% of Private Service gains and over 86% of nonfarm additions this year. Healthcare and social assistance have outpaced the rest of the labor market growth in 7 of the 8 payroll reports this year. In three of those months, the rest of the labor market was net negative. That points to a weaker cyclical picture now and labor market reliance on Healthcare means that the looming Medicare and Medicaid cuts could be a catalyst towards a very weak labor market.
This morning leaves a data dependent Fed with another softer labor print but inflation is clearly still looming. The market has voted that this morning should almost leave an upcoming -25bps cut a certainty, but we still have inflation data that remains stubborn that could surprise the market on the path for 2025. Easing with an inflation threat can drive UST steepening over linger horizons. As the market saw in Sept 2024 and in following cuts, UST shapeshifting does not always go as planned.
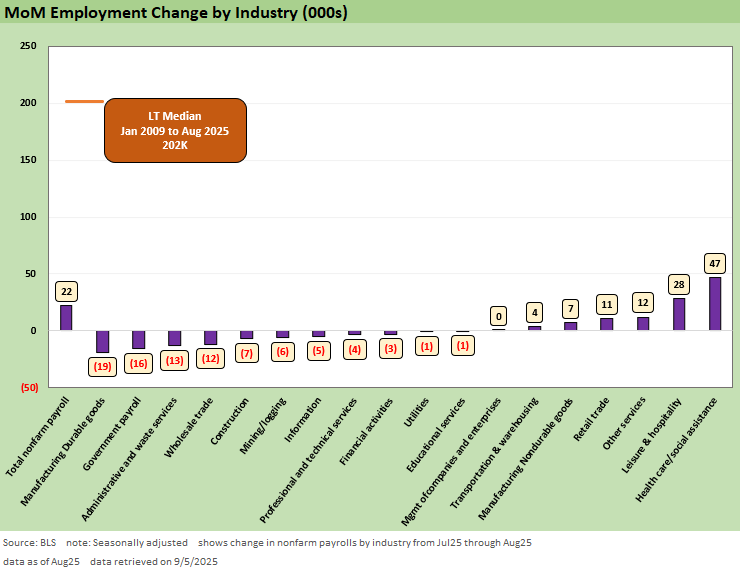
The above chart covers the monthly deltas by key industry groupings from Table B-1 of the Payrolls report. The revisions in last month’s report signaled a cooling labor market and the print today did little to change that with a +22K headline number. The breadth of the market is increasingly shallow as August sees 11 negatives, 1 flat, and 6 positives above. The breakout looks worse when considering private (+38K) vs. government (-16K) or services (+63K) vs. goods-producing (-25K).
We provide some more detail below, but the increasing reliance on Healthcare for payroll growth is becoming concerning for cyclical health. The month saw another decline for temporary help services, often a leading cyclical signal, which adds concerns. These are those jobs easiest to adjust when demand grows or weakens given the friction involved and such a slide raises concerns about labor outlooks.
The Durable goods and Construction payrolls also contracted this month in a continuation of the recent labor market trend and reflect poorly on the longer-term cyclical outlook as recent GDP investment also signaled.
The early innings of the tariff impacts are finally showing up in the hard data picture, even if the disaggregation is still challenging at this point. The inflation specter continues to loom big in recent reports and that inability to squarely dismiss it had kept the Fed patient to this point. The divergence of inflation and labor market from here continues to keep the Fed in a fraught position, but the market for now has voted that this report assures an upcoming cut at least with more to follow if CPI and PCE cooperate (we see that “cooperation” on goods pricing as unlikely). The path from there still requires a lot of finesse in navigating given the Fed calculus still could see stagflation as a very real possibility for the first time since 1980-1982.
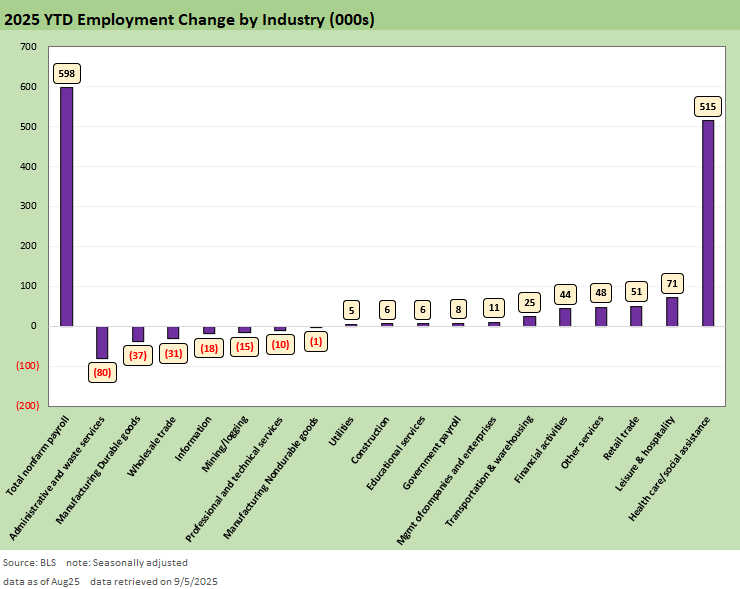
The above chart shows the same industry grouping on a YTD basis to pull back from the month-to-month variances. The big highlight is that 86% of the total nonfarm payrolls this year have been concentrated in healthcare and social assistance. The growth for Healthcare has remained fairly stable, not accelerating, as the remaining industries have seen slow or negative growth this year.
Healthcare is about 18% of GDP and under 15% on a payroll basis. Though massive, it cannot support the entire labor picture and Medicare and Medicaid cuts in the budget are a clear negative to the Healthcare outlook.
By contrast, durable goods manufacturing has lost -37K jobs, eclipsed only by the Administrative and waste services loss of -80K. With construction only barely positive on the year at +6K, the picture for the year looks increasingly bleak around domestic manufacturing needs. The current labor market is disproportionately tied to non-cyclical and limited growth areas that do not seem like a set up for a booming economy.
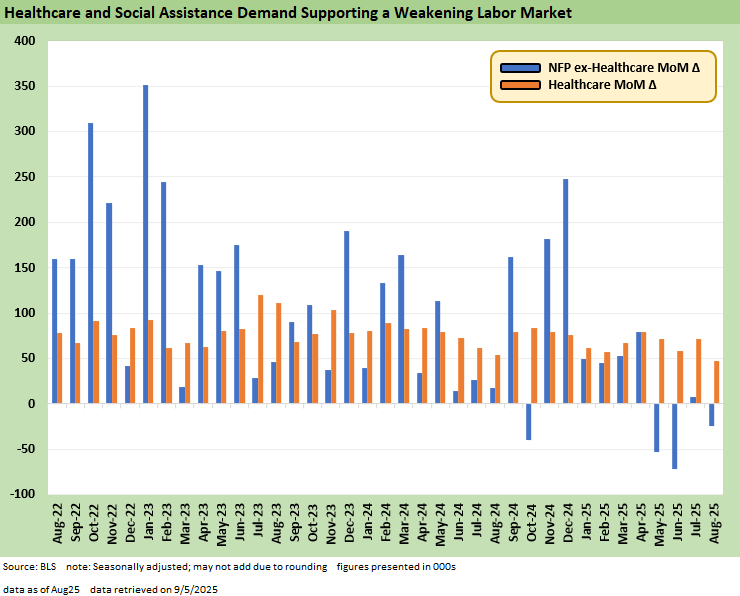
We add this above chart this month that shows the 3-year history of Healthcare and Social Assistance payroll adds vs. Nonfarm Payrolls ex-Healthcare adds(i.e. everything else). In the above we see that healthcare has outpaced all other sectors combined in half of the months above. The recent performance looks even more one-sided with 3 negative prints for ex-Healthcare and all months except April saw Healthcare adds eclipse the non-Healthcare additions (April saw 79.3K non-Healthcare vs. 78.7K Healthcare adds).
One can reasonably find some caveats around the intended cuts to Federal government but it is certainly difficult to look at the above and miss fragility across the overall private sector. The growing asymmetry this year raises questions about how durable the cycle is. Budget cuts for Medicare and Medicaid are easy to point to catalysts for a slowing Healthcare sector. With other areas signaling slowdowns, there appears to be little ability to absorb those workers elsewhere.
Into the Weeds…
The next series of charts break out granular detail of various occupation lines and industry groupings from this morning’s release with some key histories shown. We start with the broadest level that compares the Public and Private split and the Goods-Producing and Service-Providing sectors. Services typically dominates the payroll growth month to month and it did the heavy lifting as both Goods-Producing and Government were pretty deep in the red for August.
The picture above looks increasingly late-cycle, though late-cycle does not typically have a slew of tariff and immigration changes to simultaneously shock the policy environment. Non-discretionary services continue to hold up and see continued growth with physical goods and other discretionary areas seeing anemic growth or outright contraction. Without enough relief, it is hard to see how the picture improves with so much of the uncertainty in the market a feature of policy.
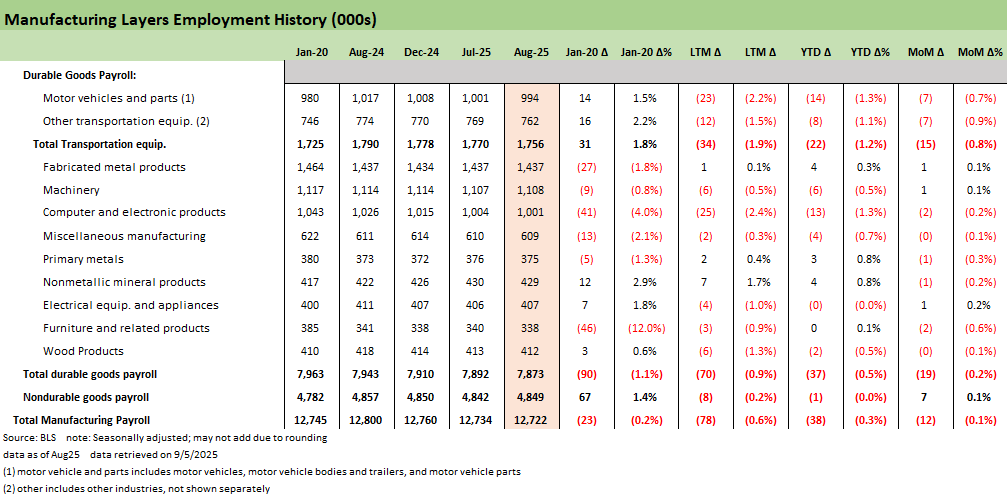
The overall Manufacturing picture is shown above with details on the Durables industries. The -12K this month comes stems largely from the -15K change in Transportation equipment as the remainder of durables contributed -4K and nondurables grew +7K. Durables demand is an easy area to point to for tariff impacts and the inflation has already shown up in hard data. The YTD numbers paint a worse picture with only 3 positives in Fabricated metals, Primary metals, and Nonmetallic mineral products.
There is little good news here. While some metals-linked lines saw minor hiring, the impact of input cost inflation appears to be outweighing the gains from industrial policy. Clearly, some of the metals-related lines above have seen some minor growth with aggressive tariffs on steel, aluminum, and copper but the trade-offs seen above raise many questions on the effectiveness of recent trade policy with some of the biggest impacts still ahead.
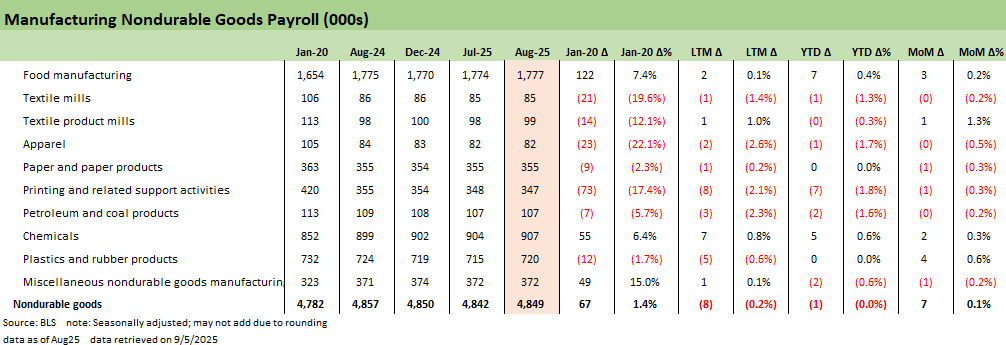
The nondurables lines above were a positive contributor for the month given decent performance in some areas. We do not see much of a signal from the variances above given the volatile nature of hiring month-to-month as these declining industries typically do not provide strong signals to the broader economic picture.
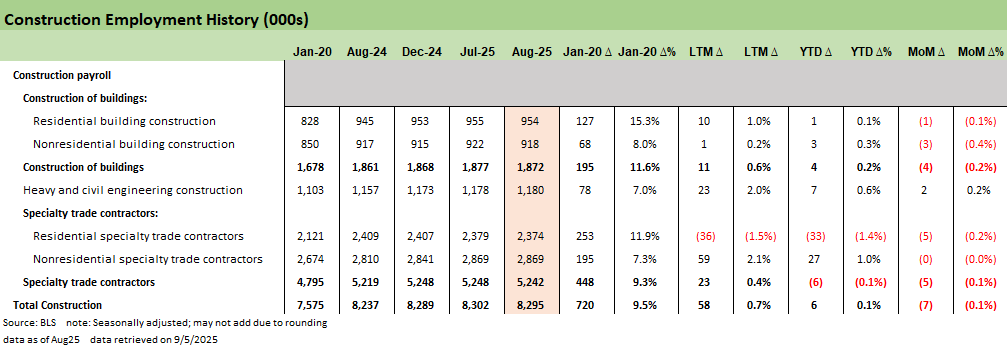
The Construction numbers are shown above, and these are an important reflection of economic activity given the breadth of multiplier effects that accompany construction growth. This month disappoints with a -7K that reduces the YTD total to +6K. The year has seen a large shift from residential to nonresidential contract work and continues to reflect a pressured project environment and the decline in residential projects. There are a lot of upcoming needs in power generation and data infrastructure with staying power, and the current state of affairs still does not reflect that upcoming activity. There are also some projects that are exposed to retrenchment (climate, clean energy, EVs)
There is certainly pent-up demand given tighter financial conditions that have kept permits and starts subdued. The impending rate cut decision after this report has the market voting lower and long rates have come down with it – for now. That UST moves after Sept 2024 easing into a UST bull flattener out the curve before shifting back to a bear steepener is a fresh memory. At least incrementally there is some tailwinds that could improve the narrow Construction picture in the near term – especially in data centers and power and even residential if mortgage rates do in fact drop closer to 6.0%.
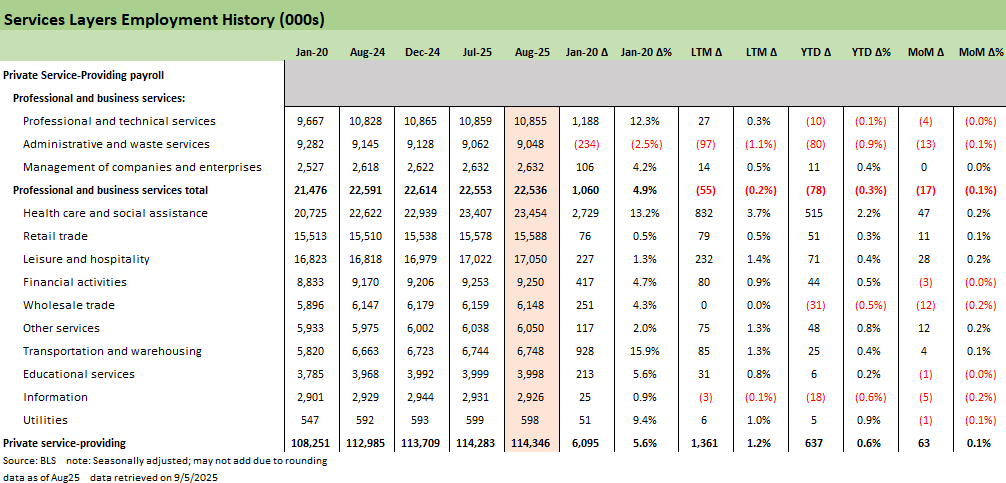
The Services payroll deltas are shown above with the Healthcare dominance already discussed in the sections above. This month sees mixed performance across the board with Leisure and Hospitality (+28K) and Retail Trade (+11K) as the other major contributors to positive service adds. The above shows where there is a mix of slow growth and stalling even in services that have anchored much of the labor market growth in the past few years.
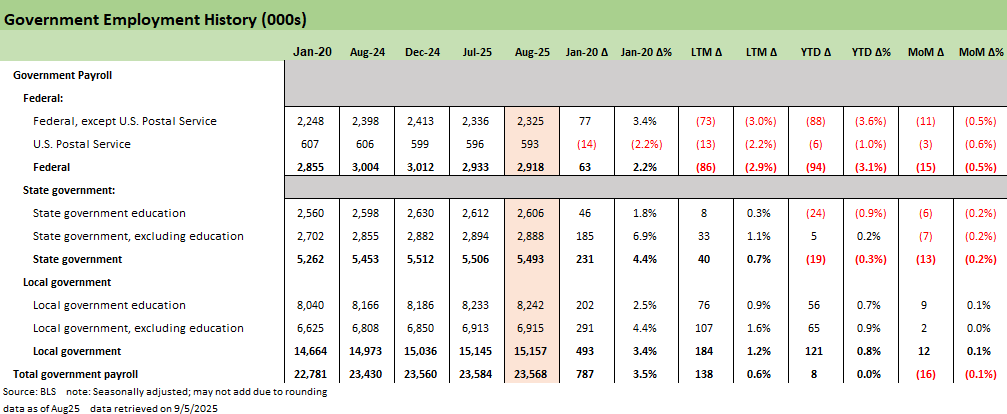
The employment picture for the Government is shown here as the last entry. Both State (-13K) and Federal (-15K) headcounts went lower in August. The strong hiring in the Local Government (+12K) was not enough to offset this month’s moves but it has kept the YTD total still positive.
See also:
Employment August 2025: Payroll Flight 9-5-25
JOLTS July 2025: Job Market Softening, Not Retrenching 9-3-25
Hertz Update: Viable Balance Sheet a Long Way Off 9-3-25
Credit Markets: Will the Heat Matter? 9-1-25
The Curve: Risk Tradeoff - Tariffs vs. UST Supply 9-1-25
Footnotes & Flashbacks: Asset Returns 8-31-25
Mini Market Lookback: Tariffs Back on Front Burner 8-30-25
PCE July 2025: Prices, Income and Outlays 8-29-25
2Q25 GDP: Second Estimate, Updated Distortion Lines 8-28-25
Avis Update: Peak Travel Season is Here 8-27-25
Durable Goods July 2025: Signs of Underlying Stability 8-26-25
Toll Brothers Update: The Million Dollar Club Rolls On 8-26-25
New Home Sales July 2025: Next Leg of the Fed Relay? 8-25-25
The Curve: Powell’s Relief Pitch 8-24-25
Mini Market Lookback: The Popeye Powell Effect 8-23-25
Existing Home Sales July 2025: Rays of Hope Brighter on Rates? 8-21-25
Home Starts July 2025: Favorable Growth YoY Driven by South 8-19-25
Herc Holdings Update: Playing Catchup 8-17-25
Mini Market Lookback: Rising Inflation, Steady Low Growth? 8-16-25
Industrial Production July 2025: Capacity Utilization 8-15-25
Retail Sales Jul25: Cautious Optimism in the Aisles 8-15-25
PPI: A Snapshot of the Moving Parts 8-14-25
CPI July 2025: Slow Erosion of Purchasing Power 8-12-25
Iron Mountain Update: Records ‘R’ Us 8-11-25
Mini Market Lookback: Ghosts of Economics Past 8-9-25
Macro Menu: There is More Than “Recession” to Consider 8-5-25
Mini Market Lookback: Welcome To the New World of Data 8-2-25
Happiness is Doing Your Own Report Card 8-1-25
Payrolls July 2025: Into the Occupation Weeds 8-1-25
Employment July 2025: Negative Revisions Make a Statement 8-1-25