Credit Snapshot: D.R. Horton (DHI)
We summarize the credit fundamentals of D.R Horton.

Credit Trend: Stable
Summary credit profile:
In early 2025, DHI morphed from a tight BBB with low credit risk to a cheap single A tier index bond with low credit risk. DHI certainly merited the upgrade to an A3 composite rating while S&P is overdue to join the other two in the single A range. Homebuilder equities have sold off hard since the fall and into 2025, but the core credit fundamentals are intact with respect to cash flow strength and excess asset protection (inventory to homebuilding debt, cash + inventory to homebuilder debt).
DHI bondholders are afforded the additional protection of the homebuilder subsidiaries not being a guarantor of the non-homebuilding debt, but that is not the prime driver of the exceptionally strong credit profile of DHI bonds (see Credit Crib Note: D.R. Horton (DHI) 8-8-24, D.R. Horton: Credit Profile 4-4-23)). It is about a track record, asset protection, cash flow, and the relative industry risk vs. comps set against a backdrop of favorable demographics and lower fixed cost exposure.
Relative value:
With two bond deals in the past year and an updated prospectus on the screen, IG funds have a choice out the curve in longer DHI including the 5% of Oct 2034 ($700 mn) and the 5.5% of Oct 2035 ($700 mn). The new issue could be anticipating the maturity of the $500 mn of the 2.6% bonds in Oct 2025. There are some more homebuilding bonds out the UST curve beyond the typically short-dated clusters of homebuilder bonds, but DHI is a good measuring stick at the high end of the peer group now that it has graduated to the A tier of the index alongside NVR with its sole 2030 bond (see Credit Crib Note: NVR, Inc. (NVR) 5-28-24). Both names offer very strong financials, stellar track records, and were long overdue for upgrades.
We view DHI as a defensive credit exposure at this point in the cycle given less disruption from tariffs, a very strong balance sheet, and the intrinsically resilient operating cash flows when homebuilder investment activity tails off. With so many capital-intensive and high fixed cost issuers in the market and myriad names exposed to commodity pricing in the BBB and A tiers, DHI offers better predictability in credit (in contrast to equities). There is also no shortage of asset quality risks in the high BBB/single A tiers in financials.
Business risk:
We see homebuilding business risk as low and especially in the context of fixed-cost-heavy bond issuers with high volume sensitivity and those with high commodity exposure. As the #1 homebuilder by units, DHI is a bellwether for the housing sector and for the health of the consumer. When the cycle softens, the financial dexterity of the builders is more evident given the nature of the working capital cycles and cash flow fundamentals as they allocate across land spend, inventory planning, and shareholder rewards (notably buybacks but also dividends in DHI’s case).
The wild cycles of recent years have driven home the industry’s financial resilience with mortgage rates swinging in a 200 bps range since the fall of 2023. The rebound of the sector coming out of COVID reinforced the secular demand profile. Very favorable demographics and the ability to effectively manage working capital and to design and price homes at a respectable margin take the worst of the risk out of the cycles for credit even if the equity markets march to a very different beat tied more closely to gross margin trends. For credit risk, asset coverage and cash flow dynamics rule the credit trend line.
Tariffs:
The homebuilders tend to play down tariff impacts on their earnings calls with a lot of red state headquarters in the mix and Texas and Florida ranking as two massive new home markets. The NAHB carries the ball on tariff complaints, however, and the trade groups are clear on the topic that material cost increases will come with tariffs even just considering Canada (lumber, aluminum, steel) and Mexico (gypsum). Appliances and a wide range of components/supplies from Asia also factor in. The good news is that the builders can work more easily with their trade partners to share the burden and can partly factor in the costs into their design and pricing decisions.
Profitability:
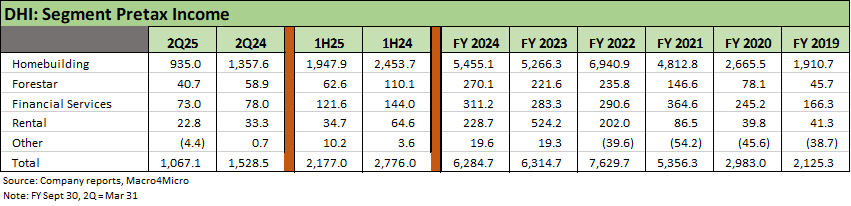
DHI operates in 4 distinct business lines with stand-alone credit quality (not guaranteed by the homebuilding subs). Those include Rental, Forestar, and Financial Services. We detail those in the charts below. Even with the diverse business line segments, the reality is that they are all driven by the homebuilding business line with that unit’s 6 geographic segments.
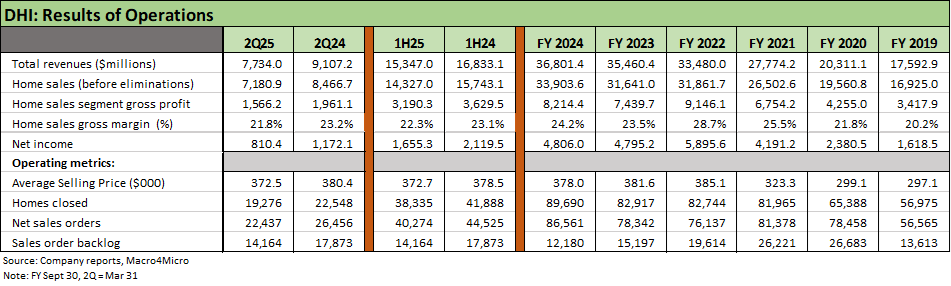
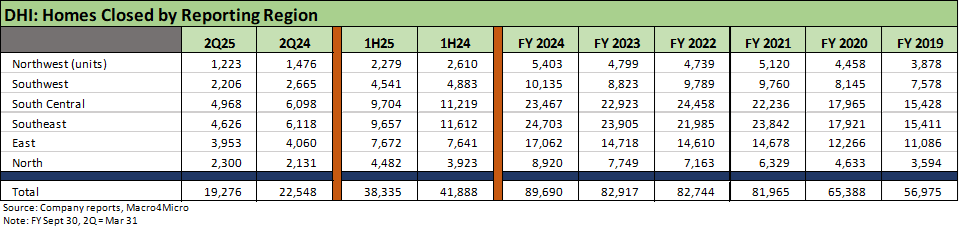
In a “price x volume” business such as homebuilding, DHI’s declining closings, declining orders, and declining backlog into 1H25 do not leave much room for misinterpretation. Total revenue, home sales revenue, and total closings hit record highs in FY 2024, so the recent turn in FY 2025 is coming off a record base. Stubbornly high mortgage rates since the brief lows of Sept 2024 now face the growing fears of broader cyclical weakness from the extreme tariff policies hurting consumers, builder margins, and potentially mortgage rates once again.
Despite the weakening homebuilding cycle, DHI’s gross margin pressure has been manageable through 1H25 (9-30 fiscal year) at 22.3% (21.8% for 2Q25), but that is well down from the exceptional FY 2022 peak of 28.7%. DHI posts the lowest average selling price (ASP) of the Top 10 builders at $372.5K in 1Q25 (only LGI Homes is slightly lower in the next tier of builders) or at a level 25% below the national average in the March quarter. DHI reported that 69% of sales were at a price below the recent national new home sales average. DHI crossed the $300K line in FY 2021. The entry level and first-time buyer mix of DHI has been more impacted by higher mortgage rates and higher prices.
Balance sheet:
The extraordinary strength of the DHI balance sheet can be underscored by a range of different metrics. The nuances of the DHI balance sheet include separate details of multiple entities (non-guarantors) that have stand-alone balance sheets as broken out in the “consolidating” balance sheet disclosure provided each quarter. The debt of the other entities is not guaranteed by the DHI homebuilding subsidiaries.
In our view, debt/EBITDA is the least useful and least relevant metric for homebuilders given the nature of the cash flows, working capital cycles, capitalized interest mix in cost of sales, and how the asset protection and fund flows work for homebuilders across housing cycles.
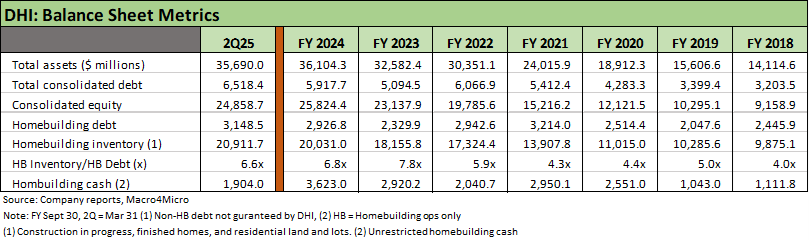
As we detail in the balance sheet chart below, DHI posted homebuilding cash in excess of total homebuilding debt at FY 2024 and FY 2023 even with a 2-year tally of record stock buybacks. The 2Q25 net homebuilding debt of $1.24 bn is set against homebuilding inventory of $20.9 bn, book equity of $24.9 bn, and a DHI equity market cap of $38.3 bn. In other words, that is a lot of excess asset protection alongside a massive base of discretionary cash flow generation. Net homebuilding debt is under 5% net debt/cap. That marks an increase from “net cash” at FY 2024 and FY 2023.
Homebuilding inventory is 6.6x total homebuilding debt. Total consolidated debt including all units (Homebuilding, Rental, Forestar, Financial Service) since 2019 has risen by $3.1 bn while book equity is $14.6 bn higher. Classic book debt % equity stats for homebuilders are often used by banks in tandem with a fixed charge coverage metric. They do that for a good reason. Inventory building/liquidation serves as the primary driver of cash flow deltas across cycles.
The working capital cycle in a declining market is a major cash flow generator, so the inventory coverage is critical despite it seldom being used by the rating agencies or equity analysts in comparative balance sheet trends. When markets slow down, the credit comfort is gained from the funds flow statement.
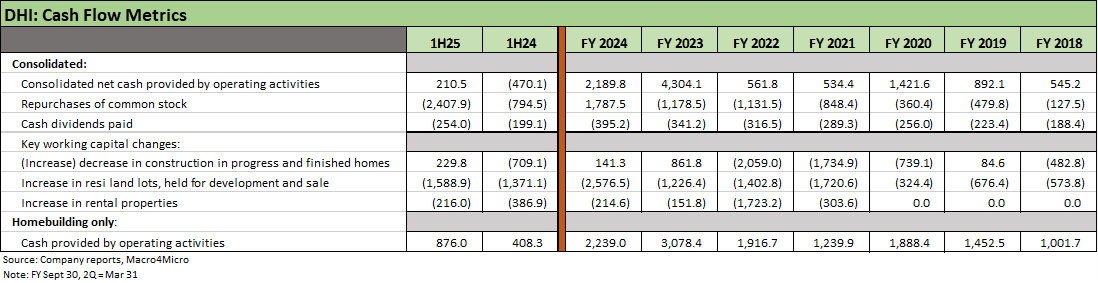
Cash flows and capital allocation:
We break out some key cash flow lines that highlight important working capital components but also the shareholder rewards of this past cycle with a heavy use of buybacks. With the building cycle easing off, DHI has materially increased its buyback goals in 2025. The 2Q25 release raised buyback guidance to $4.0 bn from the 1Q25 and 4Q24 estimates of $2.6 bn to $2.8 bn.
The liquidation of inventory in 2025 (barring a material change in interest rates and consumer sentiment) will be a major contributor to cash flow. DHI changed its consolidated cash flow from operations guidance for 2025 to “greater than $3 bn” at 2Q25 from “greater than 2024” at 1Q25 and 4Q24. That would be better than 2024 but not as high as 2023. Fine tuning cash flow can come down to land spend and inventory planning even beyond the obvious issues of total closings, selling prices, and gross margin trends.
SELECT CHARTS
Steady growth in volumes from 2019 to 2024 with margin erosion from 2022 peak.
Homebuilding dominates earnings. Other segments are extensions of the core.
The homebuilding geographic units drive home the breadth of DHI operations.
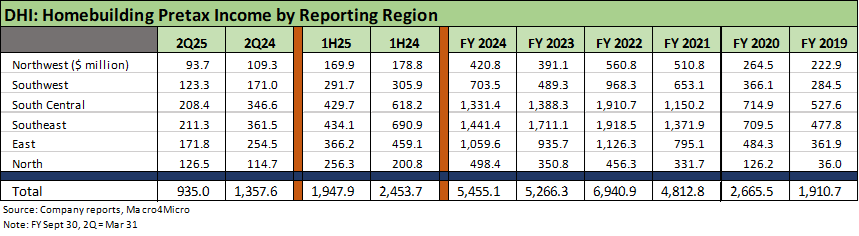
Volumes ran to record highs in 2024, but 2025 marks a slowdown.
Asset protection is self-evident. Inventory/total debt of 6.6x makes a statement.
Working capital and stock buybacks highlight financial flexibility.