
Mini Market Lookback: Welcome To the New World of Data
The week was chaotic with more signs of inflation in PCE lines and awful jobs numbers. Time to sack some data providers.


Now for the monthly economic release: “All good. I am doing great.”
The wave of critical economic releases and events of the past week (the Aug 1 tariff date, PCE inflation, income and outlays data, payroll/JOLTS, 2Q25 GDP advance estimate, FOMC release) joined with a very broad array of earnings releases and guidance to – on balance – tell a story of a weakening economy, inflation creep by product bucket, and weaker corporate sector investment as reflected in the GDP data. It was all too much for Trump as he lashed out at “rigged” data (see Employment July 2025: Negative Revisions Make a Statement 8-1-25, PCE June 2025: Prices, Income, and Outlays 7-31-25, 2Q25 GDP: First Cut of Another Distorted Quarter 7-30-25).
The reaction from Trump was to sack the BLS data head claiming Biden favoritism. The overuse of the word “rigged” gets old, but he also seems to forget he used the 2024 revisions released in the summer of 2024 (lowered job adds dramatically) against Biden in the election. So, it helped him! (Trump’s steel trap memory at work). In the fall of 2024 (before the election), Trump even claimed Biden was experiencing depression level employment.
The attack on the BLS (the BEA is likely next) is a move that was telegraphed in the Project 2025 ambitions to control the two most important metrics that impact Fed policy – inflation and employment. The game plan for tighter control of data providers had long been signaled in Chapter 21 of Project 2025, which endorses consolidating control and unifying oversight under loyalists. The fact that the architect of Project 2025 and current OMB head was alongside Trump on the Fed tour is not a coincidence (see Happiness is Doing Your Own Report Card 8-1-25). He of course has no background in capital markets or economics. The Fed was covered in Chapter 24 of Project 2025.
The payroll and inflation data has been a source of ire in many pockets of the market and especially payroll. Investment in staffing and technology at the BLS and BEA would be critical to make such data sources better if quality and transparency were in fact the priorities. That is not the case. It is about controlling the people and the data. As with DOGE, the plan is more about downsizing, consolidating, and removing career personnel who flunk the loyalty test. Those goals can look to the Cabinet as Exhibit A. It is not about competence.
Event risk tends to roil models generally as revisions and more data rolls in, and a lousy 3 months of payroll can be easily dated from the Liberation Day month of April that sent many businesses into shock and fell especially hard on small businesses and retailers. That is why small business fallout from tariffs is seldom cited by Team Trump and Bessent. That pain for small businesses and private companies is showing up in the payroll data. There is more coming. The models would be hard pressed to reflect a 6-standard deviation event (Liberation Day and the off-the-chart tariffs) on Day 1. More challenges to models and surveys lie ahead when you have a President who will not even admit the buyer pays the tariffs with his outside voice, and his minions all fall into line.
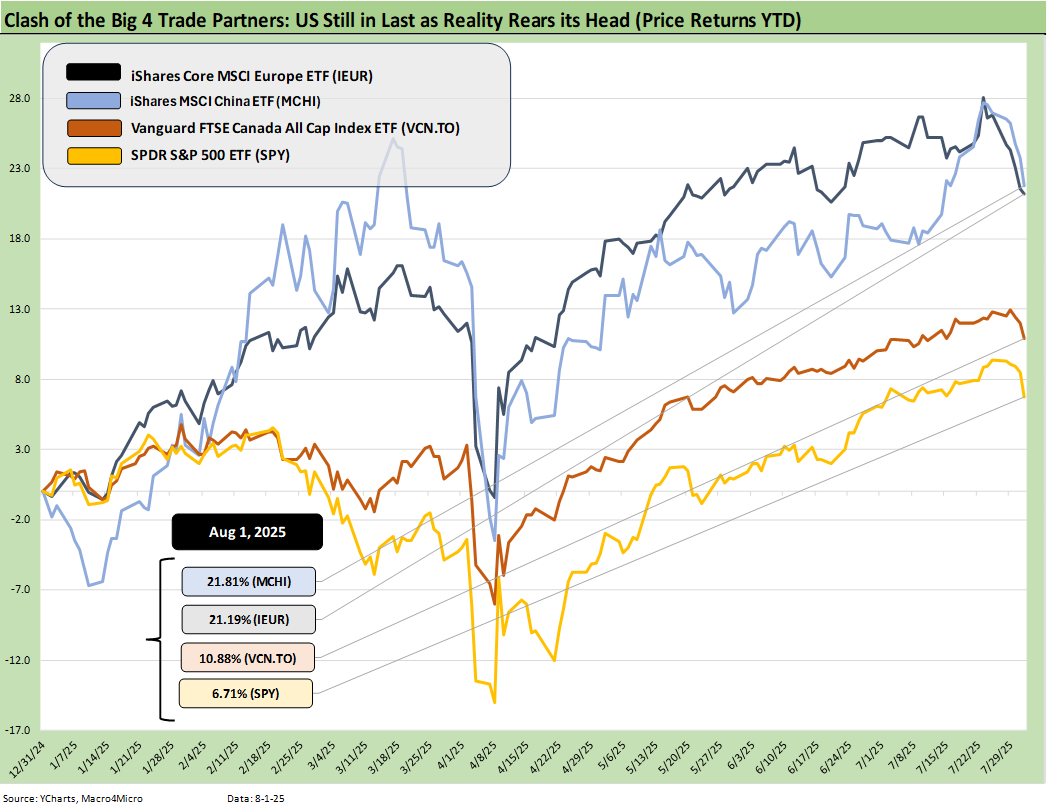
The above chart updates the running YTD returns for the Big 4 developed markets trade partners. We use the S&P 500 broad market ETF (SPY) for this purpose. We omit a Mexico benchmark from this chart given its Emerging Market status for many investors, but the Mexico ETF (EWW) would be at the top of this chart YTD.
The US remains in dead last across the group with all 4 showing the pain unfolding with the Aug 1 start date for so many tariffs under the reciprocal tariff program. Those tariffs of course should not be called “reciprocal” but should be called “trade deficit elimination tariffs”. The tariffs could also be called a “ban on low-cost sourcing.” That means lower margins.
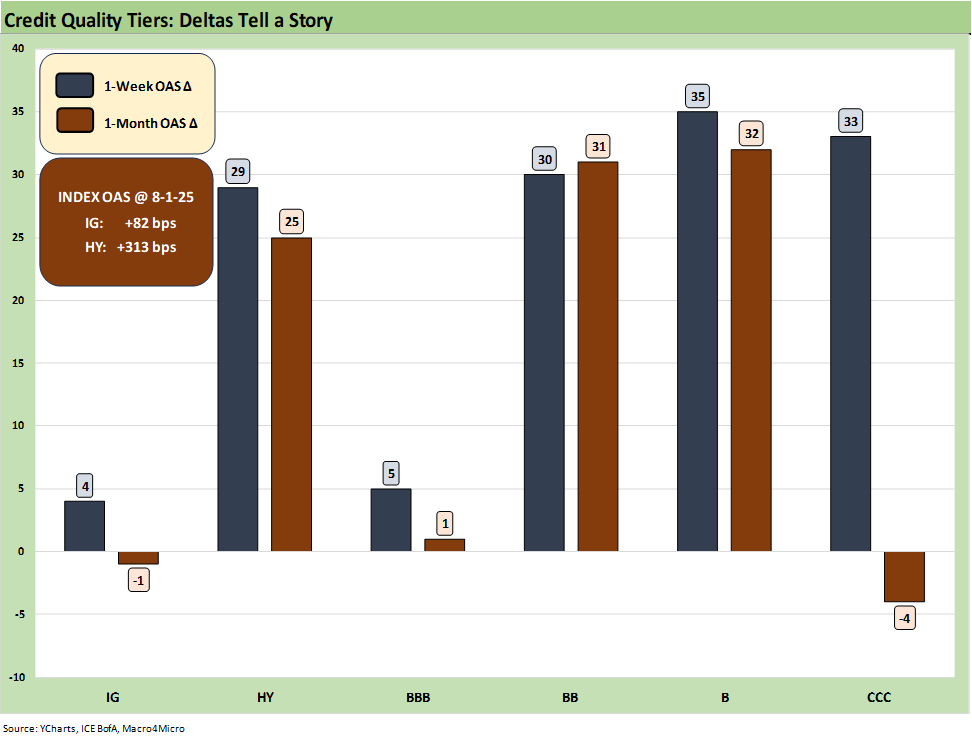
The above chart updates the 1-week and 1-month credit spread deltas for IG and HY as well as the BBB tier and below. The HY market had a bad week and gapped by +29 bps to +313 bps. For context, the material widening on the week only takes the new HY index OAS level to around the early Oct 2018 credit cycle spreads lows (+316 bps), inside the June 2014 spread lows (+335 bps), and modestly wide to the Dec 2021 lows (+301 bps). The most recent perspective on spread lows is shaped by the +259 bps in Jan 2025. In other words, the recent sense of HY OAS is more like the June 2007 bubble.
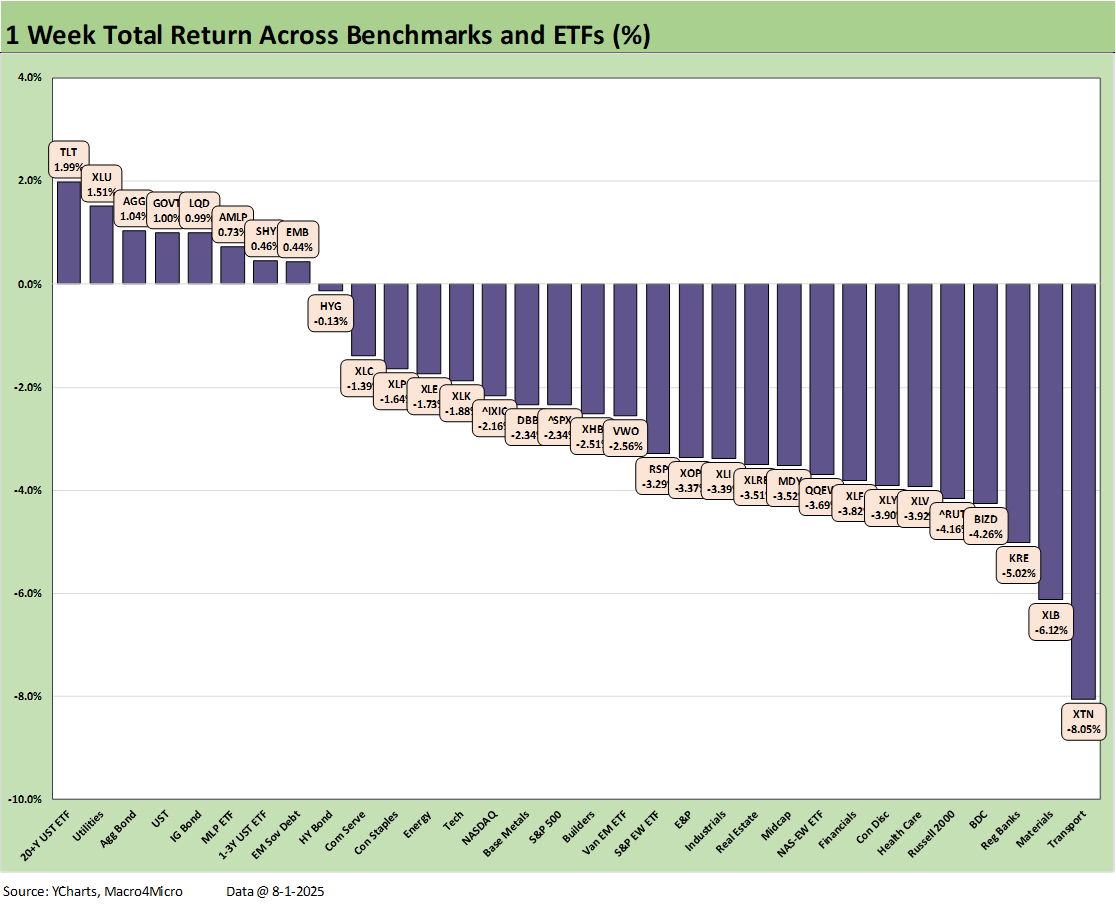
The 1-week returns for the 32 benchmarks and ETFs we track weighed in with a score of 8-24. We see 6 of the 8 in the top quartile comprised of bond ETFs joined by the Utilities ETF (XLU) and Midstream Energy (AMLP). AMLP is anchored by the high dividend income flow but also is seeing a lot of headlines around what Trump is demanding in trade deals even if those promised are unrealistic, statistically vague, and legally dubious in enforceability. XLU strength is a recurring theme with utilities offering fundamental support along with income (2.7% dividend yield vs. 1.15% on the SPY).
The bottom of the group sees Transports (XTN) taking a beating (-8.1%) on the official start date of so many global tariffs under the misnamed “reciprocal tariff” program. The cyclical Materials ETF (XLB) faces a range of exposure problems with chemicals, metals, and steel in the top 10 holdings and major names such as Freeport Mac taking a beating this past week. Besides the tariff sorting drill, there is also an increasingly challenging cyclical handicapping exercise going on. The 2Q25 GDP lines were weak in terms of fixed investment trends (see 2Q25 GDP: Into the Investment Weeds 7-30-25, 2Q25 GDP: First Cut of Another Distorted Quarter 7-30-25).
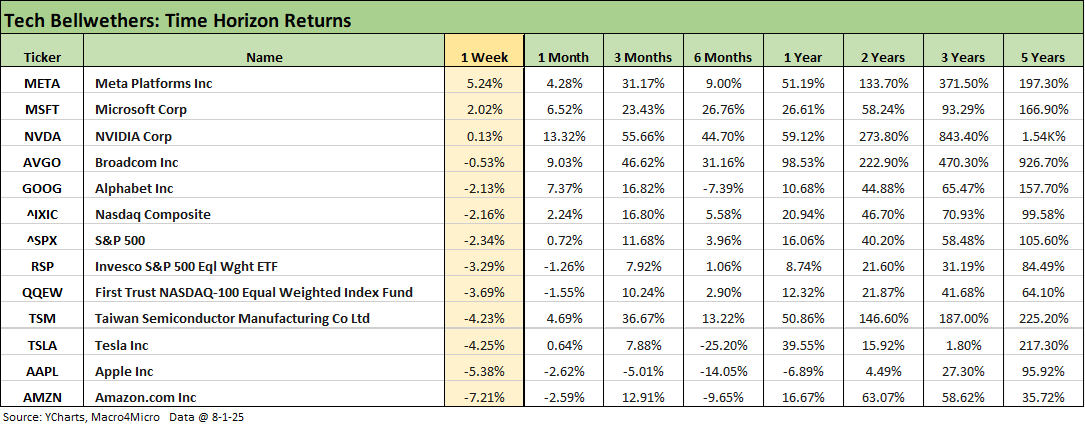
The tech bellwethers in the above chart show a soft week even in the face of some very solid quarterly earnings reports (notably META, MSFT). Only NVIDIA, Microsoft, and Meta posted positive return weeks. We see the bottom 3 slots held by Mag 7 members (AMZN, AAPL, TSLA) to go with 3 Mag 7 on top and Alphabet at #5.
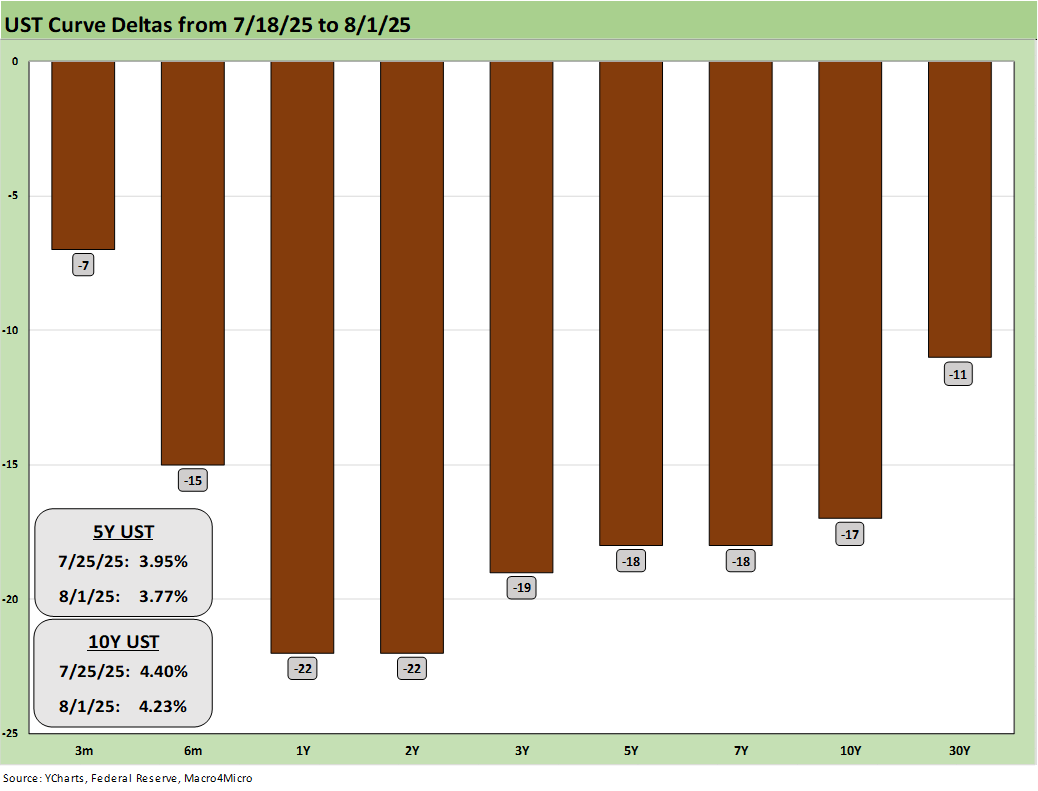
The above chart updates the UST deltas for the week with the payroll shock sending the 2Y UST sharply lower but also moving the entire curve. The odds of the Fed easing in Sept is now up to 80% as we go to print. Some more bad payroll data could get 50 bps in the dialogue as we discussed on Friday, but the inflation anxiety in August numbers will thicken the plot.
If inflation by product groups keeps rising in MoM trends (whether CPI or PCE) and tell an unfavorable story on tariffs, the Fed would face some tough choices. Of course, we could start seeing more terminations in the BEA and BLS who become victims of their integrity and competence.
Trump’s expertise in the area of economics is underscored by his steadfast and often frequently articulated view that the “seller pays” the tariff, so what could go wrong? The head of the House Ways and Means Committee agrees with him (shock) and the Secretary of Treasury has 6 views of a two-sided coin. In other words, confidence in data integrity will have a hard time improving from here if those controlling the mission don’t have the best data and most accurate measurement as their main goal in substance. They will of course claim that is the goal.
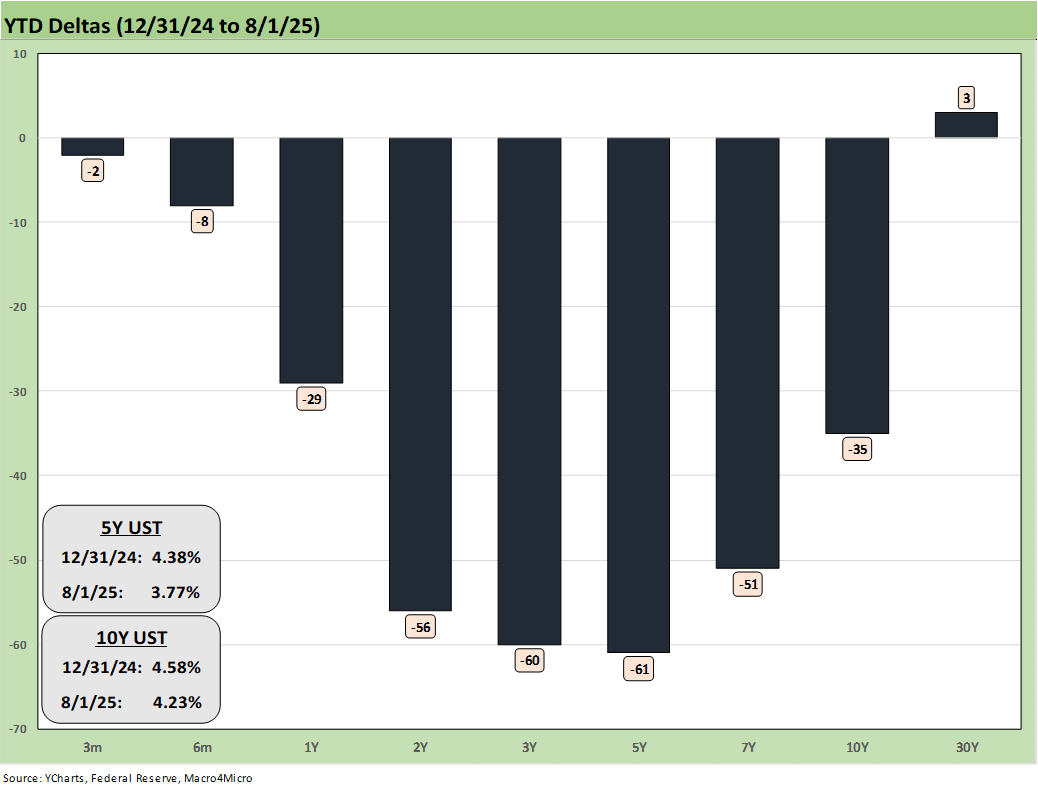
The YTD UST deltas still show the bull steepener trend that has supported short to intermediate debt with the 30Y now only slightly higher at +3 bps after the week’s UST rally.
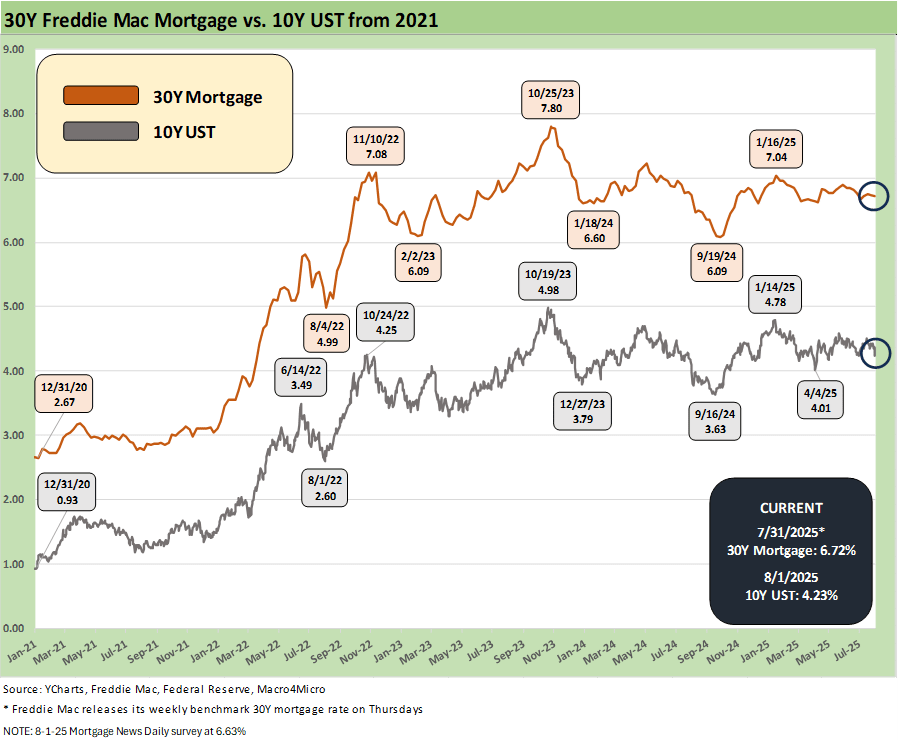
The above chart plots the history of the 10Y UST vs. Freddie Mac 30Y mortgage released each Thursday at noon. On Friday after payroll numbers, we saw other mortgage surveys rally with the Mortgage News Daily numbers down to 6.63% or -12 bps lower on the day.
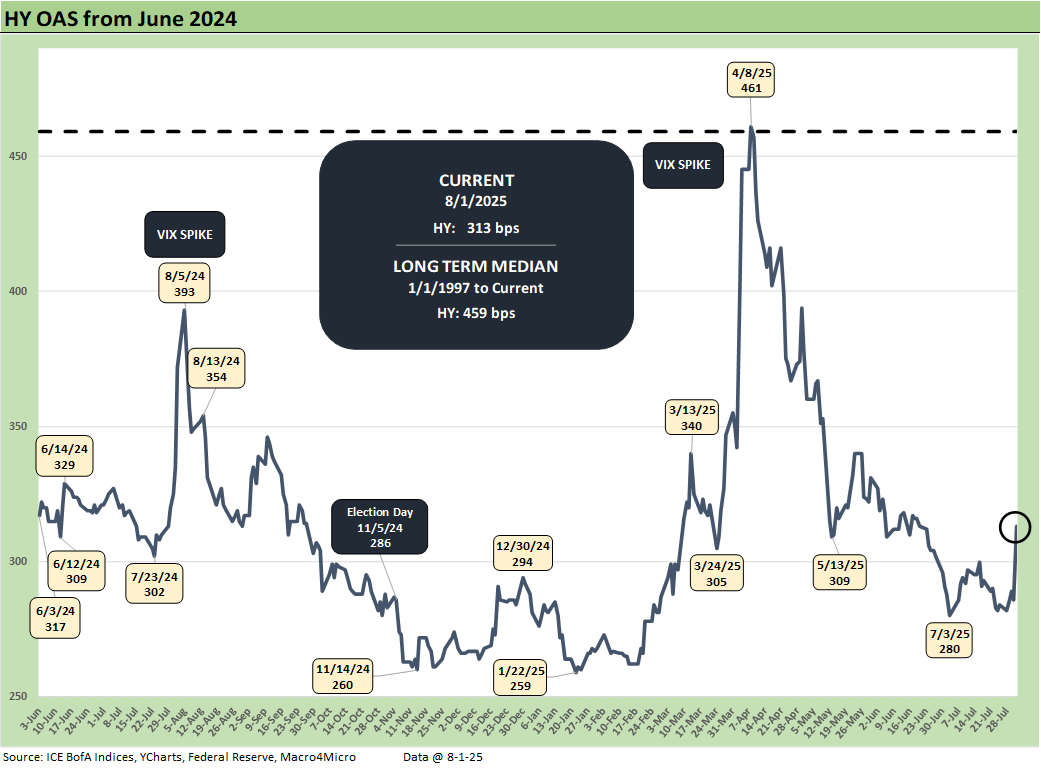
The above chart updates the HY OAS with spreads +29 bps wider to +313 bps. That is +54 bps off the Jan 2025 lows. YTD HY OAS is +21 bps wider.
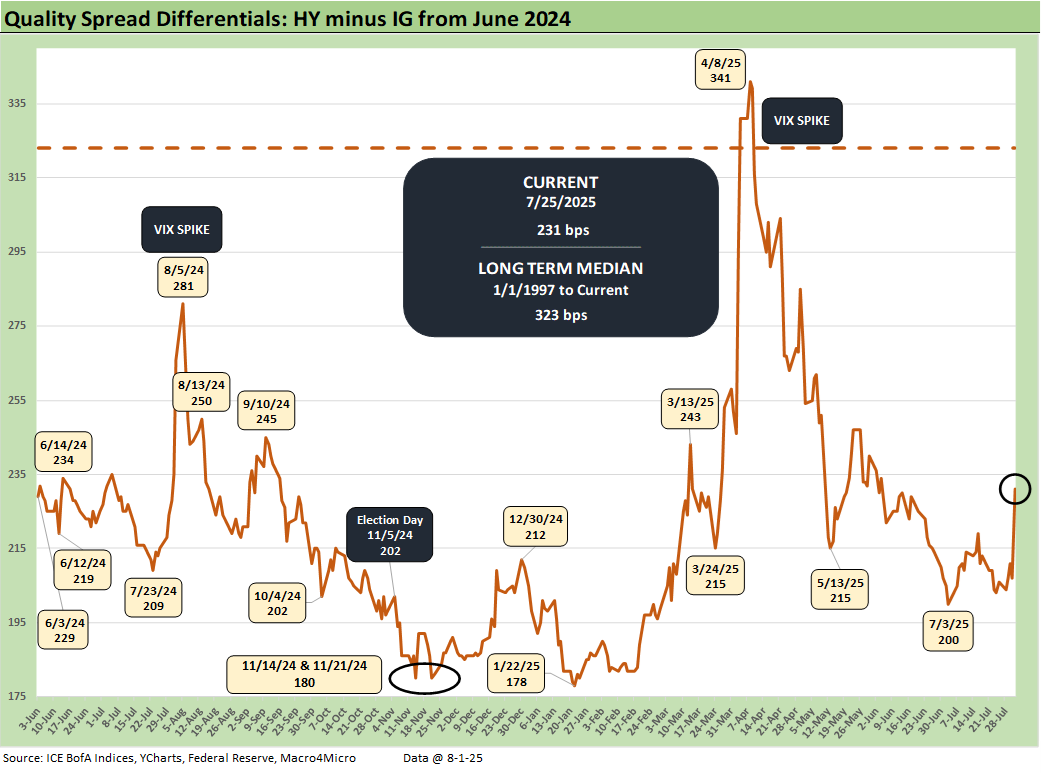
The “HY OAS minus IG OAS” quality spread differential moved +25 bps wider this week as quality spreads react to data and headlines from the bottom up. The +231 bps is still very compressed to the +323 bps long-term median and +53 bps above the Jan 2025 lows.
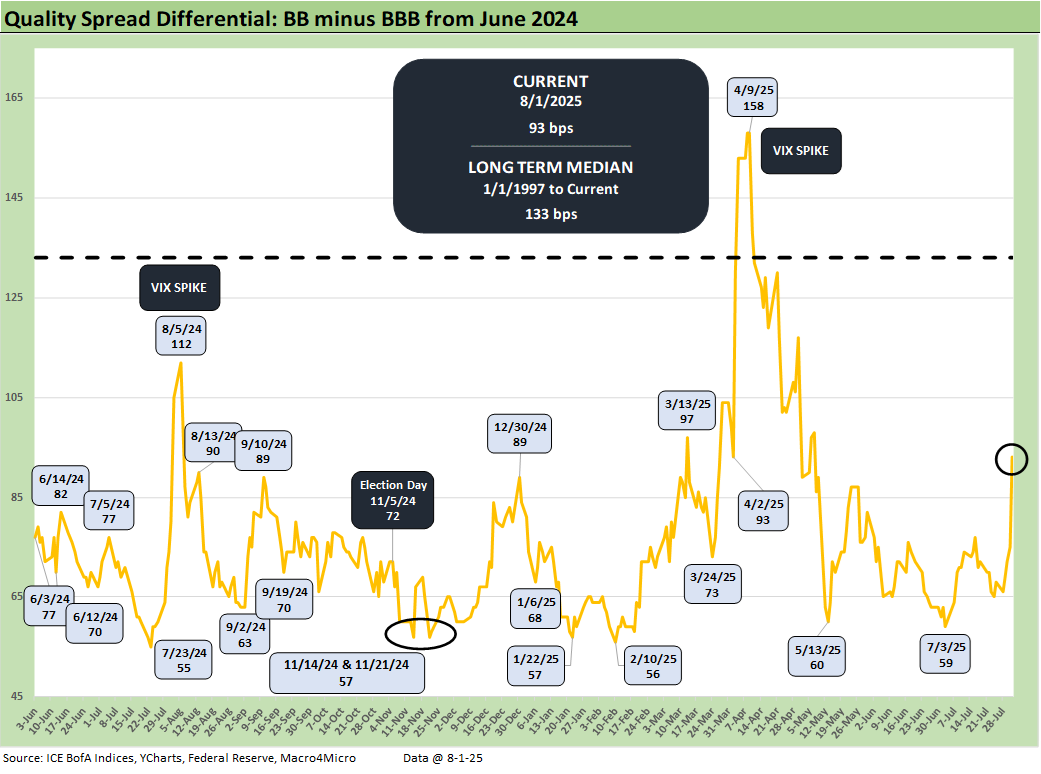
The BB OAS minus the BBB OAS quality spread differential is +25 bps wider to +93 bps as the BB tier gapped wider by +30 bps on the week and BBBs only moved +5 bps wider.
See also:
Happiness is Doing Your Own Report Card 8-1-25
Payrolls July 2025: Into the Occupation Weeds 8-1-25
Employment July 2025: Negative Revisions Make a Statement 8-1-25
Employment Cost Index 2Q25: Labor in Quiet Mode 7-31-25
PCE June 2025: Prices, Income, and Outlays 7-31-25
2Q25 GDP: Into the Investment Weeds 7-30-25
2Q25 GDP: First Cut of Another Distorted Quarter 7-30-25
United Rentals: Cyclical Bellwether Votes for a Steady Cycle 7-29-25
JOLTS June 2025: Lower Openings and Hires, Higher Layoffs YoY and Flat MoM 7-29-25
Footnotes & Flashbacks: Credit Markets 7-28-2025
Footnotes & Flashbacks: State of Yields 7-27-25
Footnotes & Flashbacks: Asset Returns 7-27-25
Mini Market Lookback: Mixed Week Behind, Big Week Coming 7-26-25
Durable Goods Jun25: Air Pocket N+1 7-25-25
Taylor Morrison 2Q25: Resilient but Feeling the Same Macro Pressure 7-25-25
New Home Sales June 2025: Mixed Bag 7-24-25
Existing Home Sales June 2025: The Math Still Doesn’t Work 7-23-25
PulteGroup 2Q25: Still-Lofty Margins see a Mild Fade 7-23-25
D.R. Horton 3Q25: Material Slowdown Still Good Enough 7-22-25
Housing Starts June 2025: Single Family Slips, Multifamily Bounces 7-18-25
Mini Market Lookback: Macro Muddle, Political Spin 7-19-25
Housing Starts June 2025: Single Family Slips, Multifamily Bounces 7-18-25
Retail Sales Jun25: Staying Afloat 7-17-25
June 2025 Industrial Production: 2Q25 Growth, June Steady 7-16-25
CPI June 2025: Slow Flowthrough but Starting 7-15-25
Footnotes & Flashbacks: Credit Markets 7-14-25
Mini Market Lookback: Tariffs Run Amok, Part Deux 7-12-25
Mini Market Lookback: Bracing for Tariff Impact 7-5-25
Payrolls June 2025: Into the Weeds 7-3-25
Employment June 2025: A State and Local World 7-3-25
Asset Return Quilts for 2H24/1H25 7-1-25
JOLTS May 2025: Job Openings vs. Filling Openings 7-1-25
Midyear Excess Returns: Too little or just not losing? 7-1-25