
Toll Brothers Update: The Million Dollar Club Rolls On
Toll Brothers (TOL) posted steady numbers with mild gross margin compression, but home sales still saw a record 3Q25.


Toll Brothers covers a wider range of models than many assume.
Toll’s July 3Q25 period saw modest gross margin pressures from a high base (25.6% 3Q25 vs. 27.4% 3Q24 with adjusted gross margins at 27.5% vs. 28.8%). TOL remains in the upper tier of the margin comps for the major builders.
The equity market reaction was mild with TOL outperforming its large peers on earnings release day. That comes after some harsh reactions earlier in the year as some common headwinds were experienced across homebuilders (see Toll Brothers 1Q25: Performing with a Net 2-20-25).
TOL equity had been the banner #1 performer across the trailing 2 years, but the trailing 1-year started from a strong position as weakness was racing into the builder equity performance in 4Q24 (after Sept 2024) before the recent rallies (see Footnotes & Flashbacks: Asset Returns 8-24-25).
We have consistently viewed TOL credit quality as rock solid and the company underrated relative to the business risk, the metrics, the cash flow resilience inherent in the working capital cycles, the asset coverage, and the brand power. Toll deserves higher credit ratings with its stellar performance, mix of financial risk variables, and low industry risk.
With net debt to capital of 19.3% on a book basis and 12.7% using market adjusted equity (8-25-25), TOL offers a lot of net asset cushion with inventory alone at 3Q25 totaling 5.7x net debt. That is impressive asset coverage.
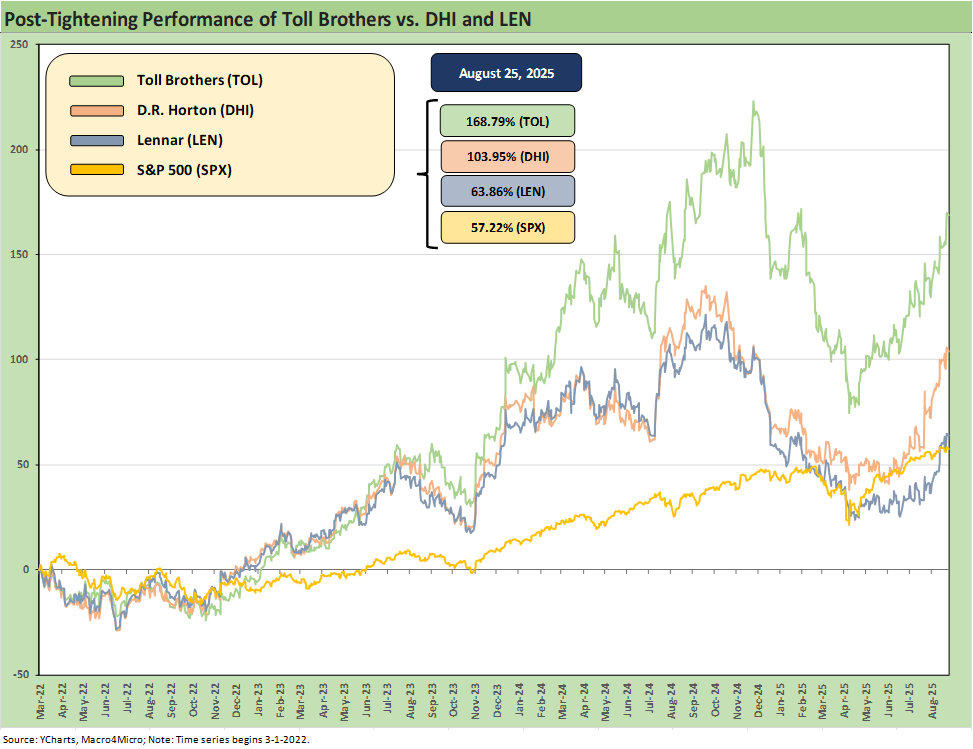
The above stock return time series shows Toll Brothers (TOL) well ahead of D.R. Horton (DHI) and Lennar (LEN) as the Big 2 of homebuilding (#1 ranking depends on unit volumes vs. dollar revenues). DHI and LEN offer a broader view of the overall national housing market across more price tiers, and TOL fits in with the narrow luxury segment.
With TOL posting the highest average selling prices of the Top 10 public builders and DHI the lowest in that group, the three combined make for a useful frame of reference even if the median TOL homebuyer is not the median DHI or LEN buyer (see Homebuilder Rankings: Volumes, Market Caps, ASPs 5-28-25).
As past commentaries have detailed and TOL routinely highlights on its earnings calls, the well-heeled customer base of TOL and the ability to design and price homes consistent with a healthy margin have been tested against a mixed backdrop of high mortgage rates. TOL is a differentiated way for the equity market to play the housing cycle than the average builder and the same fundamental distinction applies in credit markets.
The time horizon in the chart begins at the start of March 2022 when the tightening cycle sent short and long rates on a multiyear ride that saw mortgages in a 200 bps range from fall of 2023 through current days. We look at those UST curve trends in our rolling yield curve updates (The Curve: Powell’s Relief Pitch 8-24-25).
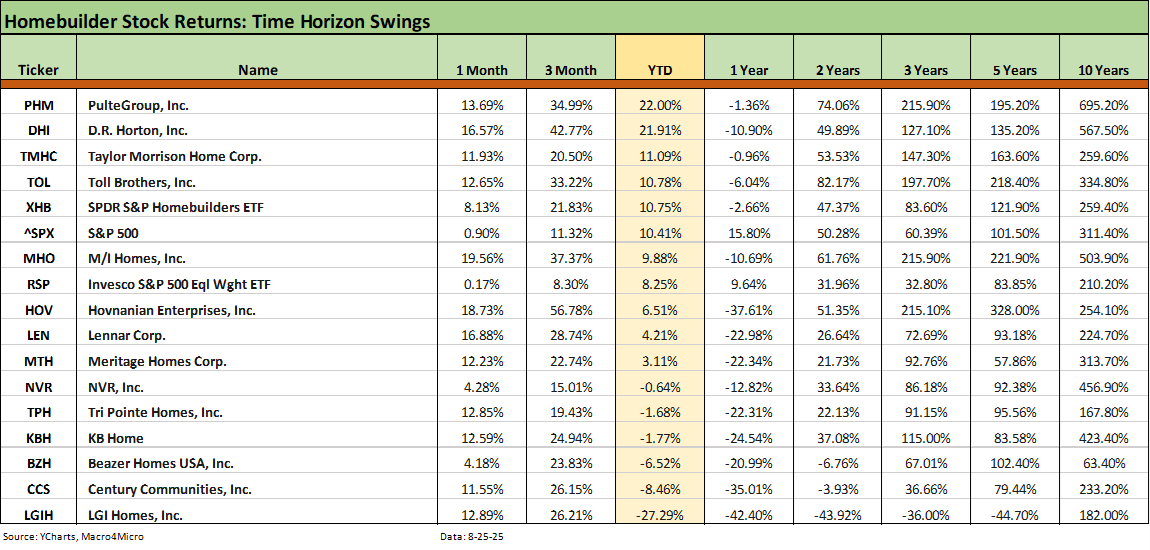
We add more time horizons for equity returns in the above chart, and we line them up in descending order of YTD total returns. The recent rebound is in evidence after a very rough path across 4Q24 and into the early spring with the rolling 1-month and 3-months period above underscoring the rally. TOL hung in better in the initial downdraft in late 2024 and early 2025, so had less room to rally.
We see TOL in the top 5 YTD at a modest +10.8% vs. Pulte at #1 with 22.0% and DHI #2 at +21.9%. Lennar is modestly positive at +4.2%. We see 1Y in the red for TOL at -6.0%, but the 2Y horizon ranks TOL at an impressive #1 with a +82% return.
On a broader industry note, the chart offers a reminder of how impressively the homebuilding sector performed well into the tightening cycle even with mortgage rates rising and the economy doing well. That came to a screeching halt in 4Q24, and now we are moving back into a bounce as noted in the chart. Toll is +33% over the trailing 3-months vs. +21.8% for the Homebuilder ETF (XHB).
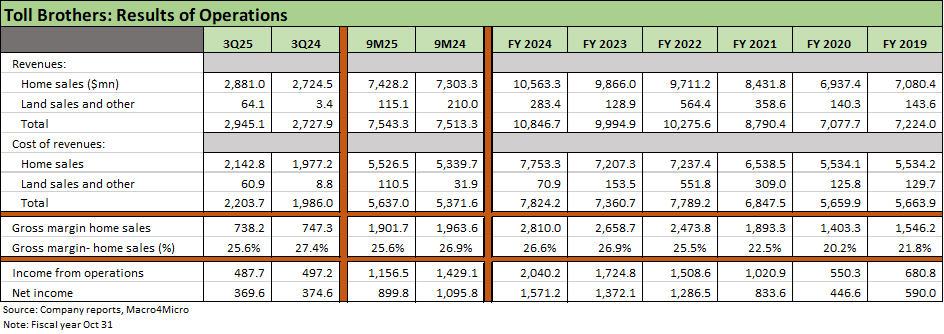
The above table details the results of operations for TOL, and the numbers highlight the steady solid margins alongside resilient revenue and earnings. The 3Q25 quarter (7-31-25) saw a favorable volume variance at +5% along with a slight tick higher in average selling prices (ASPs) for the quarter but a weaker ASP trend YTD 9M FY2025. The 3Q25 home sales revenue line was in fact a record. Net signed contract value was flat YoY vs. 3Q24 while contracted homes by units edged lower by -4% with ASPs up +4.5% to $1.0 million.
The margin story is still constructive relative to the direction seen at other major builders. Home sales margins dropped to 25% handles in 3Q25 at 25.6% vs. 27.4% in 3Q24. Adjusted gross margin (ex-interest and inventory write-downs) was 27.5% in 3Q25 vs. 28.8% in 3Q24. These are strong margins in historical context as highlighted by the 2019 to 2021 margin history in the table. Guidance is calling for a 27.0% adjusted gross margin in 4Q25 and 27.25% for FY 2025.
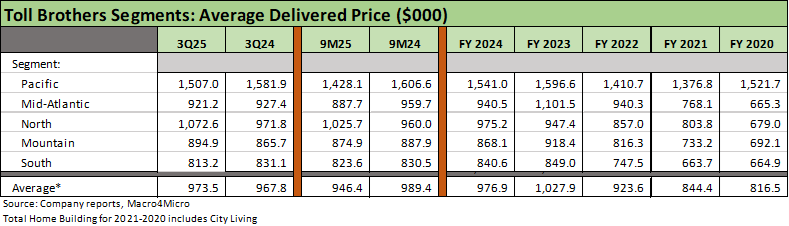
The above table highlights the ASP trend line for the highest price levels among the major builder peer group. The ASPs for Toll are more then double the median national average for all new homes (see New Home Sales July 2025: Next Leg of the Fed Relay? 8-25-25). As always, the Pacific geographic segment is in its own price zone at over a $1.5 million.
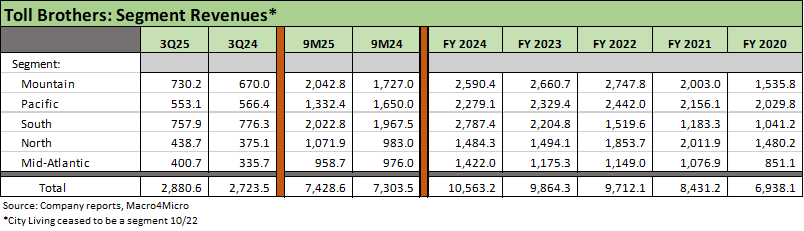
The above table details the geographic revenue mix and trend line with the Mountain region leading the pack through 9 months just ahead of the South. The Mountain region is #2 in total units through 9 months at 2,335 units with the second lowest ASP at $874.9K. The South is #2 in dollar revenue through 9M 2025 but #1 in units at 2,456 with the lowest ASP of $823.6K.
The highest ASP region of the Pacific has the lowest volume at 933 but in a very pricey region. The #2 region in ASP is the North at over $1.0 million ($1,025K) but second lowest in units through 9M 3Q25 behind the Pacific.
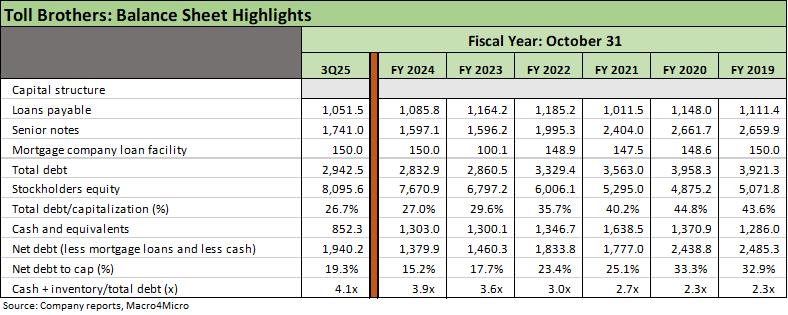
The balance sheet is strong even if book value leverage ticked higher pro forma for the $500 million bond deal priced in June (5.6% of June 2035) that saw the redemption of the $350 million of 4.875% due Nov 2025.
Net debt to cap of 19.3% at 3Q25 was down sequentially from 2Q25 but up from 15.2% at 4Q24. The asset coverage metrics have improved with cash + inventory rising to 4.1x total debt at 3Q25 vs. 3.9x at 4Q24.
See also:
Homebuilder Rankings: Volumes, Market Caps, ASPs 5-28-25
Toll Brothers 1Q25: Performing with a Net 2-20-25
Toll Brothers: Rich Get Richer 12-12-24
Toll Brothers: A Rising Tide Lifts Big Boats 5-23-24
Credit Crib Notes: Toll Brothers (TOL) 9-11-23
Toll Brothers F2Q23: Company Comment 5-25-23
Housing sector:
New Home Sales July 2025: Next Leg of the Fed Relay? 8-25-25
Existing Home Sales July 2025: Rays of Hope Brighter on Rates? 8-21-25
Home Starts July 2025: Favorable Growth YoY Driven by South 8-19-25
Other Homebuilders:
Taylor Morrison 2Q25: Resilient but Feeling the Same Macro Pressure 7-25-25
PulteGroup 2Q25: Still-Lofty Margins see a Mild Fade 7-23-25
D.R. Horton 3Q25: Material Slowdown Still Good Enough 7-22-25
KB Home 2Q25: Negative Industry Trends Keep Coming 6-25-25
Lennar 2Q25: Bellwether Blues 6-20-25
Credit Snapshot: Meritage Homes (MTH) 5-30-25
Homebuilder Rankings: Volumes, Market Caps, ASPs 5-28-25
Credit Snapshot: PulteGroup (PHM) 5-7-25
Credit Snapshot: D.R. Horton (DHI) 4-28-25
Credit Snapshot: Lennar (LEN) 4-15-25
Credit Snapshot: Taylor Morrison Home Corp (TMHC) 4-2-25
Lennar: Cash Flow and Balance Sheet > Gross Margins 3-24-25
KB Home 1Q25: The Consumer Theme Piles On 3-25-25
Credit Crib Note: Lennar Corp (LEN) 1-30-25