
New Home Sales July 2025: Next Leg of the Fed Relay?
New home sales were unimpressive YoY with expectations stirring on the downward move in mortgage rates.


Trump is a sick man. Baltimore is a great city.
We saw 3 of 4 regions post lower YoY sales with the critical #1 South region (60% of sales) down by -4.0% and the #2 sector of the West (23% of sales) down by -19.9% YoY. The smaller Midwest (13%) was higher by +4.9% while the smallest region of the Northeast (4%) was off by -23.5%.
The median price of $403.8K comes with the asterisk of mix by region and product tier, but it was the lowest since Nov 2024 ($397.6K)
Total inventory was higher YoY at +7.3% with prices down and sales volume at -8.2% YoY. That is an unfavorable combination. Sequential MoM inventory is down slightly by -0.6%. Sales volumes also declined by -0.6%.
The major rally in homebuilding equities the past few months reflects a combination of valuation and pent-up demand along with supply-demand imbalances. The recent economic weakness could ironically support housing demand and homebuyer appetites if the UST curve sees a bull flattener (see The Curve: Powell’s Relief Pitch 8-24-25, Footnotes & Flashbacks: Asset Returns 8-24-24).
With tariff uncertainty, that downward shift in long rates flowing into mortgages is hardly a foregone conclusion with the stagflation wildcard hanging around. Homebuilder incentives could start to have the desired effects again in the 5% range net of incentives.
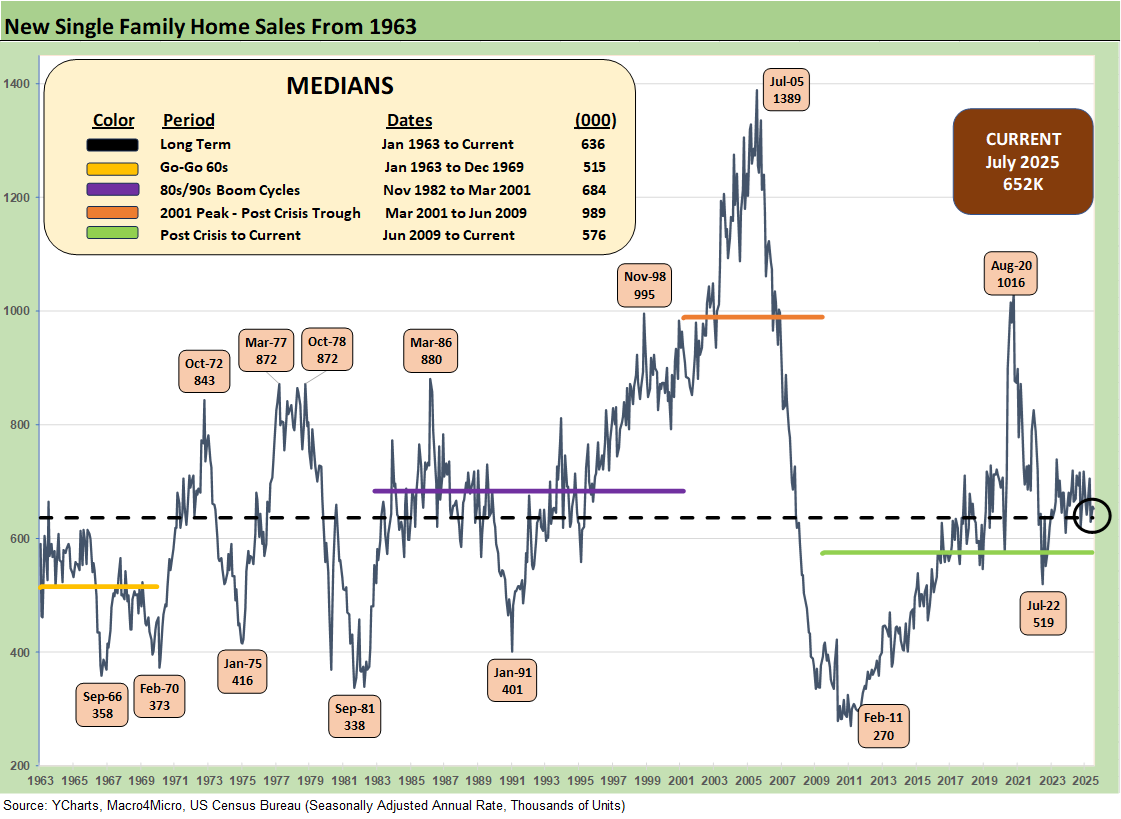
The above chart updates the new single family sales time series from 1963, and the current 652K is a small sequential move lower of -0.6% for July. We saw 3 of 4 regions with negative MoM variances with only the West posting a sequential increase of +11.7%. The largest region is the South at 60% of total, and that region posted -3.5% MoM with the Midwest at -6.6% and the Northeast flat at 0%.
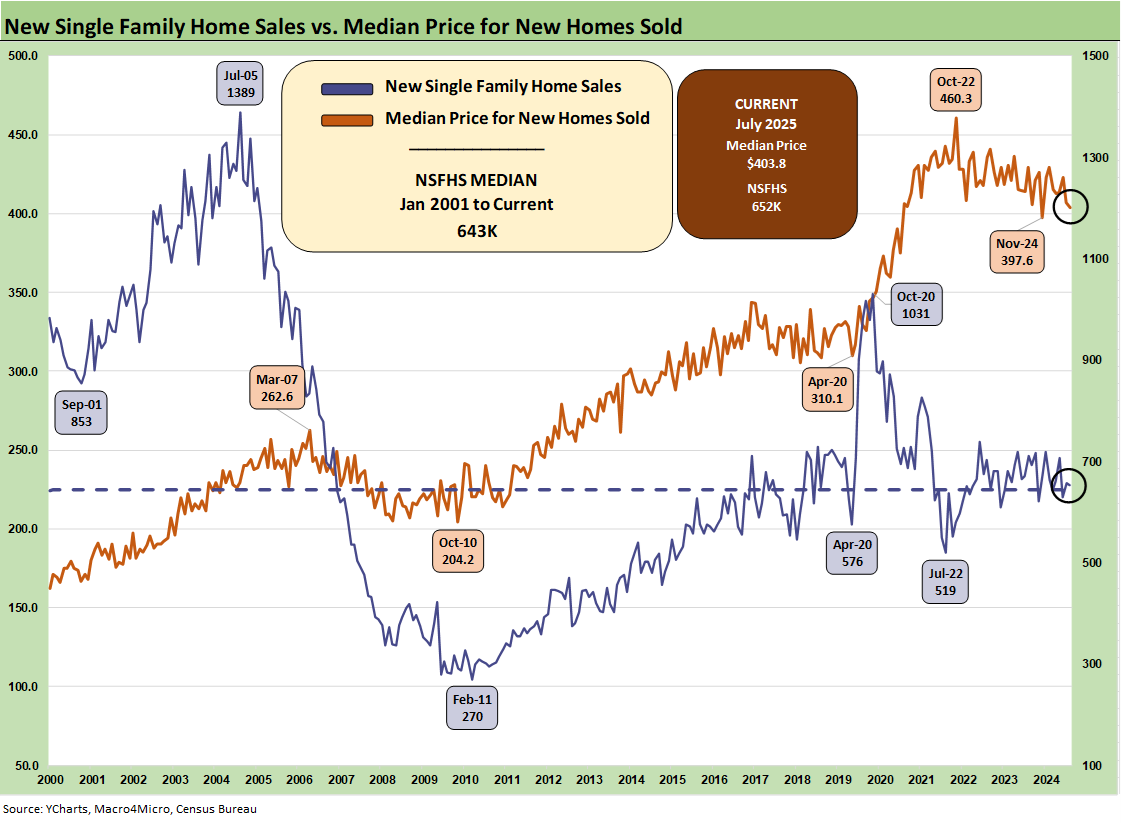
The above two-sided chart shows the sales pattern for the new home sales line since 2000 vs. the median prices, which weighed in at $403.8K for July, down from $407.2K (as revised) in June. The fact that prices had trended materially higher across the post-COVID cycle is old news, but the sensitivity of monthly payments is married more to mortgage rates as a critical variable in monthly payments.
Mortgages have been stubbornly high but are starting to see some relief with the Freddie Mac 30Y (set each Thursday) migrating to 6.58% on its weekly reset. Mortgage rates remain the primary driver of weaker volumes in the lower price tiers in both new and existing home sales (see Existing Home Sales July 2025: Rays of Hope Brighter on Rates? 8-21-25).
For the largest share of the housing market in the mid-price tiers, the combination of lower prices and in some cases sustained incentives is part of a pattern of gross margin erosion into 2025. Each builder has distinctive geographic mix shifts to consider when framing ASP trends. We look at a number of those trends in our single name coverage (see links at the bottom). The current $403.8K is below the calendar 2024 median of $420.3K and 2023 median of $428.6K.
While prices always come with a very big asterisk of regional mix and product tier shifts, we are starting to get more color from builders on the mixed challenges of cost creep and the sustained need to discount prices or offer incentives. That means margin squeeze.
We are seeing numerous major builders post declining orders and lower backlogs in earnings reports. The “pace vs. price” topic has been hot again, but there will be a fresh round of actions if rates keep sliding. We see highs in completed home inventory in this latest sales report, so the builders could use some more demand right now.
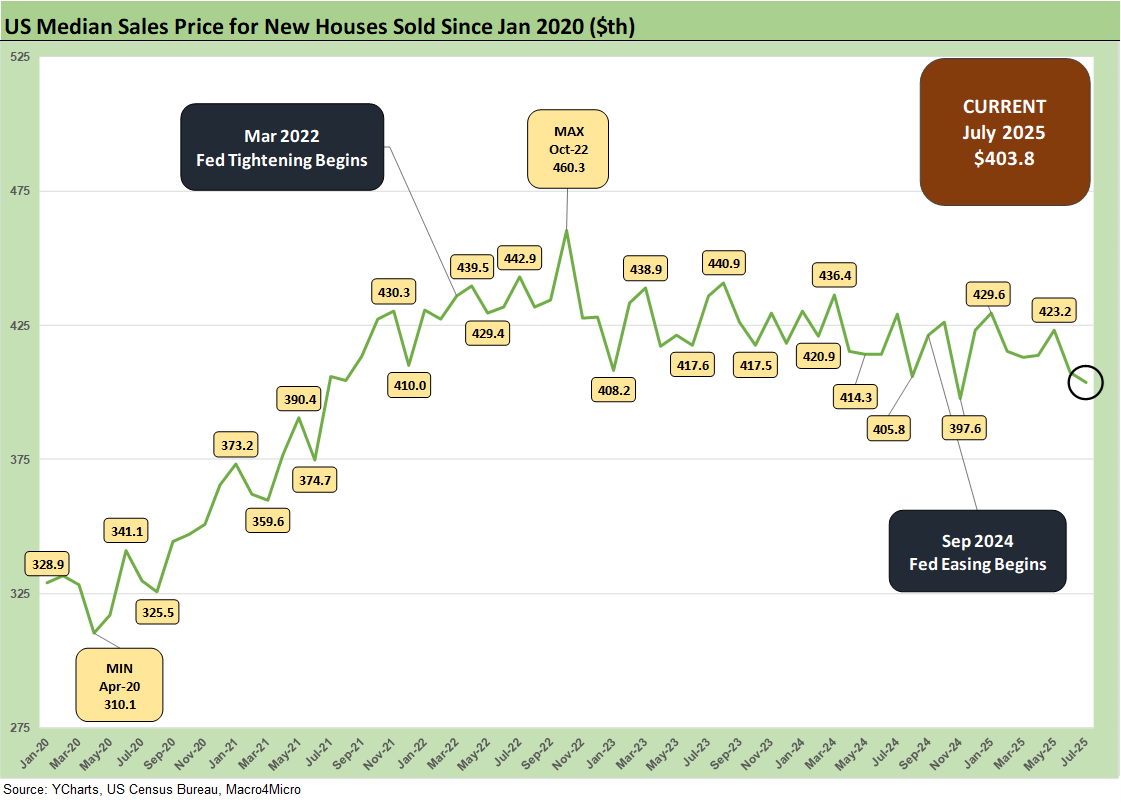
The above chart updates the running median price trends. Builder fears of higher materials and supplier chain costs are not going to do much to relieve homebuilders in their pricing strategies with gross margins softening in 2025. That said, most are posting margins still above pre-COVID levels even if down sharply from abnormal margin peaks in 2022.
The big picture on price vs. pace and unit costs flowing into margins…
The word “normalization” shows up more lately in prices and margins, but there are also ample cyclical reasons for prices to react to weaker demand. The builders need to frame how they can get into a gross margin zone that works, and they know that the expectation of costs can get wagged meaningfully by tariffs.
We have commented on the NAHB view on tariff distortions in the past. They will be very busy in coming months sorting out what is next subject to lumber and materials tariffs heading into the later stages of 2025. Already, the NAHB has put out some numbers for the average home cost from recent tariffs (over $9K per average home).
Higher duties on Canadian lumber are here already with more Section 232 detail to come. Some of the earnings commentary indicated that the builders do not expect full tariff impact until late 2025 and then into 2026 numbers for the next peak season pricing strategies.
Beyond lumber, materials costs from Mexico for other building-related supplies such as gypsum will see pressure. The NAHB had earlier published a commentary on tariffs (see NAHB: How Tariffs Impact the Home Building Industry March 2025, NAHB Members Cite Impact of Tariff Uncertainty on Home Building 5-22-25). That news was not good. We got more color in updates from the NAHB recently (see Framing Lumber Prices 8-25-25, Metals and Equipment Drove Material Prices Higher in June 7-18-25 , Trump Extends Tariff Deadline to Aug. 1, Adds 50% Tariff to Copper 7-9-25).
The homebuilders downplay the problem on earnings calls and let the NAHB trade group do their talking for them. The bottom line is lumber, materials, appliances, etc. will bring lower margins or higher prices or both. The early signals are margins taking the hit.
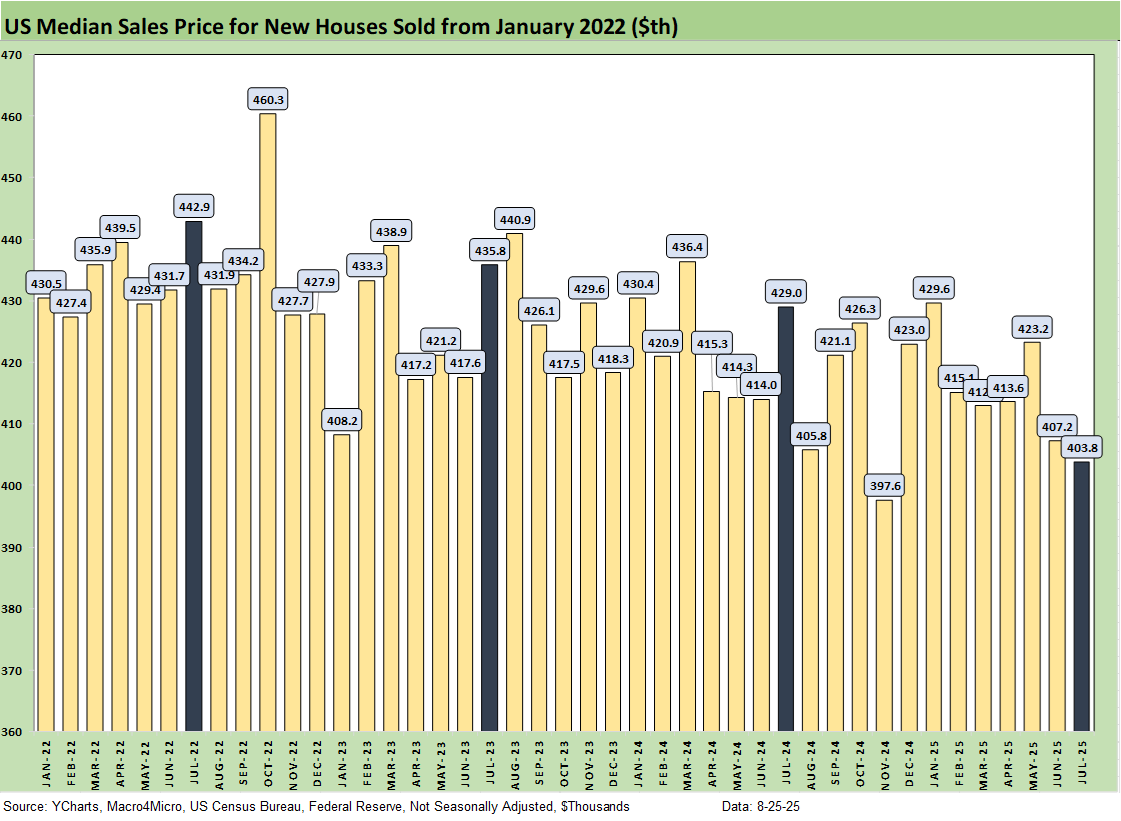
The above chart gives a different visual angle on the median home prices from early 2022. That is a lot of $400K handles with one sub-$400K outlier in Nov 2024. The current $403.8K is the lowest in 8 months and the second lowest in the chart above from Jan 2022 (3 years, 7 months).
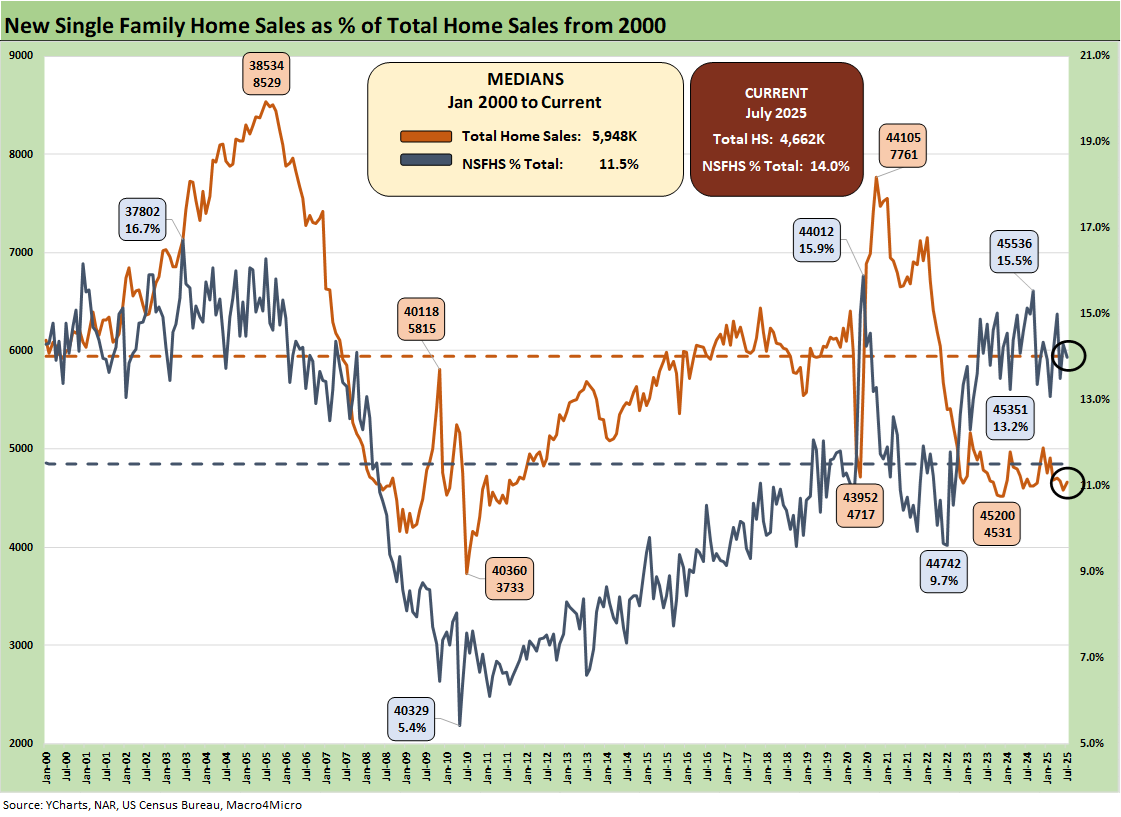
The above chart updates the share of total home sales captured by new homes given the relative constraints on existing home sales. Existing home sales totals always dominate the total home sales number (historically closer to 90%) but have been reeled in this cycle on the “golden handcuff” challenge with so many sub-3% and sub-4% mortgages in a market where high 6% and low 7% are on the other side of a home sale when the buyer looks to move up or downsize. That means monthly payment pressures. For July 2025, new home sales captured 14.0% of total home sales vs. the long-term median of 11.5%.
The focus on mortgage rate headwinds has been a feature of the post-tightening cycle demand trend as volatility in long rates since later in 2023 made home closing and delivery schedules tight and a factor in inventory planning. Move-in ready” or “within 60 days of move-in ready” became a part of working capital management. Even a luxury player such as Toll gave that factor more consideration. The summer “inflation watch” and sustained focus on steepening risk kept this topic alive, but we are seeing homebuilders dial back their spec inventory.
For those thinking a Fed easing move will solve the mortgage rate problem, just look back at the fall easing of 100 basis points and what has ensued since then. The market saw 6% area mortgages in Sept 2024 and early Oct on the initial rally, and then the steepening move kicked in with a vengeance. Record borrowing needs, record UST supply, and the worst performance of the dollar since the 1970s all factor into the UST yield anxiety (see The Curve: Powell’s Relief Pitch 8-24-25).
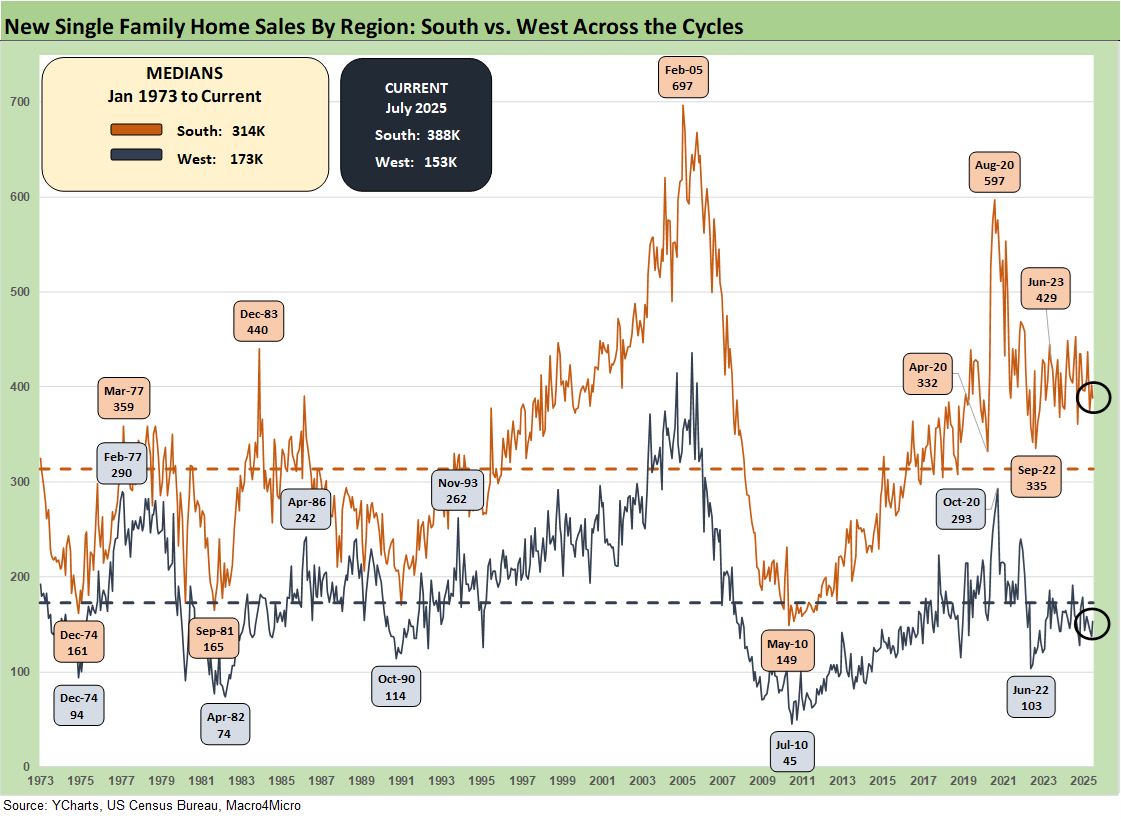
The time series above updates the new single family home sales across the cycles since 1973 for the #1 and #2 regions of the South and the West. The 388K for the South is around 60% of the total of all single family new home sales (SAAR) and posted a sequential decline of -3.5% from July and down by -4.0% YoY. The West at 153K is 23% of the total. For the month, the West was +11.7% sequentially and -19.9% YoY.
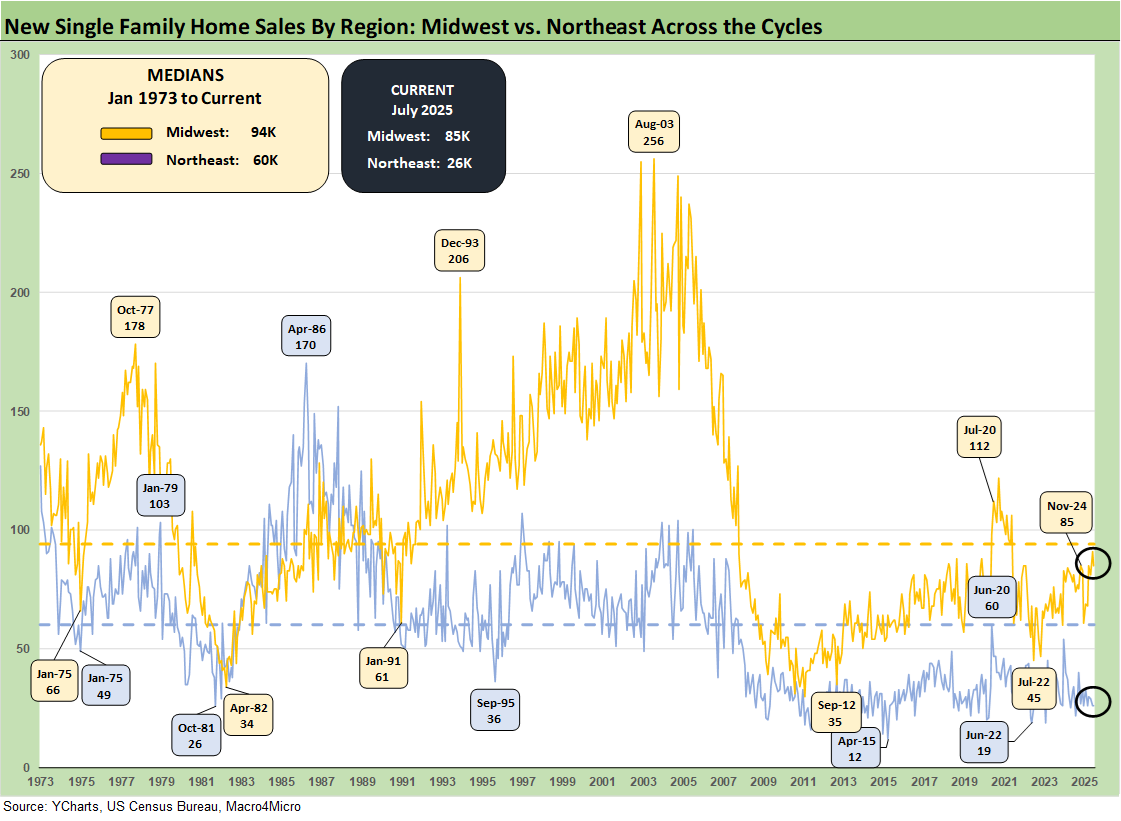
The timeline for new home sales for the smaller Midwest and much smaller Northeast market is detailed above. The Midwest (13% of total) was -6.6% sequentially and +4.9% YoY. The Northeast market (4% of total) was flat at 0% sequentially and -23.5% YoY.
Housing sector:
Existing Home Sales July 2025: Rays of Hope Brighter on Rates? 8-21-25
Home Starts July 2025: Favorable Growth YoY Driven by South 8-19-25
Homebuilders:
Taylor Morrison 2Q25: Resilient but Feeling the Same Macro Pressure 7-25-25
PulteGroup 2Q25: Still-Lofty Margins see a Mild Fade 7-23-25
D.R. Horton 3Q25: Material Slowdown Still Good Enough 7-22-25
KB Home 2Q25: Negative Industry Trends Keep Coming 6-25-25
Lennar 2Q25: Bellwether Blues 6-20-25
Credit Snapshot: Meritage Homes (MTH) 5-30-25
Homebuilder Rankings: Volumes, Market Caps, ASPs 5-28-25
Credit Snapshot: PulteGroup (PHM) 5-7-25
Credit Snapshot: D.R. Horton (DHI) 4-28-25
Credit Snapshot: Lennar (LEN) 4-15-25
Credit Snapshot: Taylor Morrison Home Corp (TMHC) 4-2-25
Lennar: Cash Flow and Balance Sheet > Gross Margins 3-24-25
KB Home 1Q25: The Consumer Theme Piles On 3-25-25
Toll Brothers 1Q25: Performing with a Net 2-20-25
Credit Crib Note: Lennar Corp (LEN) 1-30-25