
Hertz Update: Viable Balance Sheet a Long Way Off
While the valuation story is always about tomorrow’s earnings and not the past, Hertz badly needs a very strong 2026.


Whatever it takes…
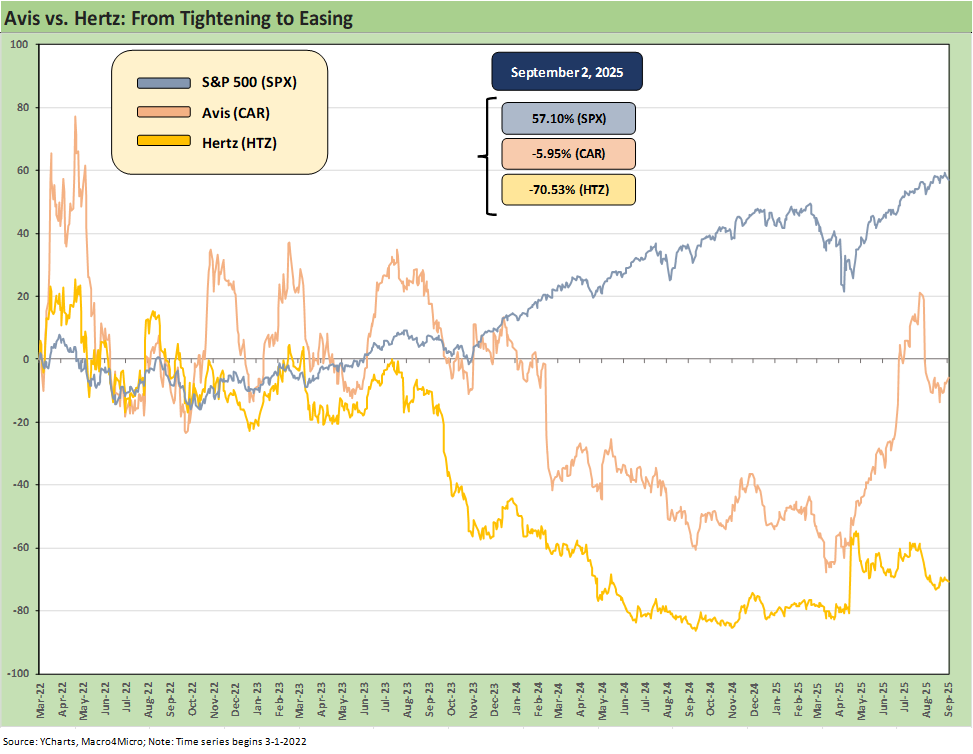
The painful equity performance of Hertz since its emergence from Chapter 11 and making a big bet on EVs has haunted the company in both the debt and equity markets. The recapitalization and private equity derisking came first, and then the company looked for a touchdown with Tom Brady in EVs. The company is still digging out of its latest hole and is looking for almost a $2 bn swing in LTM EBITDA by 2027.
Hertz now needs to bolster confidence that it can get back above $1 bn in EBITDA to sustain a viable equity market cap with too much secured debt and little financial flexibility as the current reality. The peak travel season of summer is crucial for car rental operators on the EBITDA line, and 2025 will not be bringing relief based on current guidance.
The encumbered, layered and stretched balance sheet remains the second biggest problem behind operating losses. Hertz continues to address their cost structure and strategic game plan for the fleet. The history is not a good one on fleet planning when they deviate from the norm as they tried one too many times in the timeline from 2015 to 2024.
As we covered in the recent Avis commentary (see Avis Update: Peak Travel Season is Here 8-27-25), the period after COVID was quite volatile in the used car market, and that drove car rental margins to record levels as used vehicle inflation radically reduced unit costs for Avis and Hertz. The car rental profit windfall from used car valuations also drove a major increase in shareholder enhancement actions that were dominated by stock buybacks. Debt reduction was not a priority but reduced structural subordination was a priority for Avis.
The trend line for Hertz in the above stock chart is glaring enough. As HTZ plunged with its massive EV fleet problems and they endured a fleet cost spike, the challenge of excessive debt got much worse. Avis also showed high volatility during that wild period of dazzling EBITDA margins but had a rough run in 2024 until the big rebound in 2025. The result has been that some equity investors looking for a play on the high free cash flow car rental business would rather look to Avis on the basis of much greater financial flexibility and better financial risk symmetry to deal with any unexpected developments.
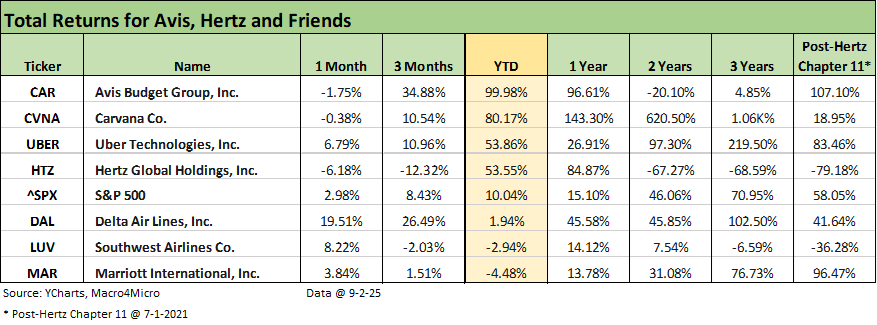
The above table opens up a wider range of comps for the car rental companies given the oligopolistic nature of the industry (with private Enterprise as the third player and by far #1 rental operation). The group above includes plays on travel via hotel and lodging (Marriott) and airlines (Delta and Southwest), on mobility (Uber), and on used cars (Carvana).
We frame the group against the S&P 500. Looking back to the longest time horizon (the emergence of Hertz from Chapter 11), the contrast between Avis and Hertz is a stark one with Avis +107% and Hert at -79%. Avis materially outperformed the S&P 500 as did Marriott and Uber.
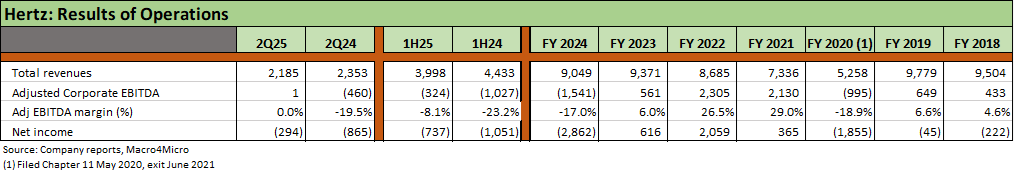
We detail the consolidated results above for Hertz, and the EBITDA and EBITDA margin lines tell quite a story from the boom of 2021-2022 into the deep plunge of 2024 and a negative EBITDA of -$1.5 bn. The negative EBITDA line of 1H25 and 1H24 at least saw the positive line crossed (barely) in 2Q25. A notable backdrop for the travel-sensitive Hertz is the strong airport travel volumes (notably in 2023-2024) and decent travel period so far in 2025 that ran alongside the deep Hertz losses in 2024 and 1H25. That came after material margin erosion in 2023 while airport volumes and leisure travel soared.
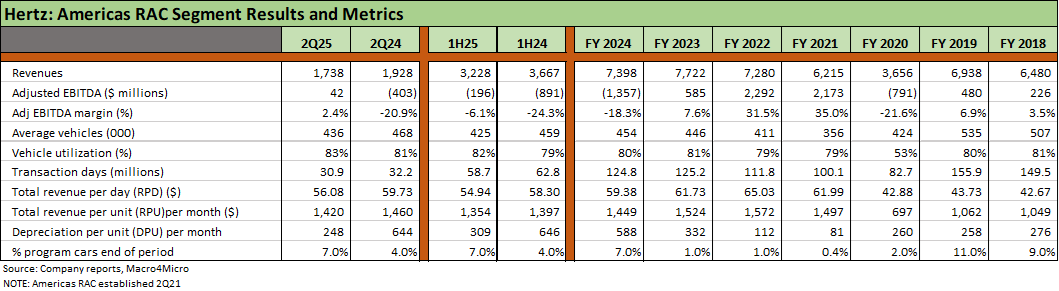
The above chart frames the Americas RAC segment numbers. Americas RAC was where the most extreme volatility in the numbers can be found since that is where the fleet risks tied to residuals are concentrated along with around 80% of the global fleet (2Q25). We see the dramatic improvement in Adjusted EBITDA YoY in the Americas for 2Q25 and 1H25, but there is a long way to go to get a total Hertz EBITDA run rate above $1 bn for Global RAC.
The segment fleet size was lower YoY in 2Q25 and 1H25, but utilization has improved. Management cited a fleet age that showed 80% under 1 year. Market pricing was “challenged” (RPU), and HTZ still has a target of $1500 per month. Costs at $248 per unit was a solid improvement and inside the Hertz “North Star” target of $300.
The fleet replacement cycle and OEM negotiations are complicated by uncertain tariff risk and how materials costs (steel, aluminum, copper, textiles/upholstery, etc.) will flow into OEM fleet pricing strategies. The need to protect retail customers and key franchise dealers may not extend as generously to car rental customers.
While resilient used car prices usually are associated with higher new car prices, the reality of the new vehicle replacement costs brings a challenge to car rental in 2026 and 2027 given what is unfolding under Section 232 for autos and metals. That headwind will be there regardless of the outcome of the recent IEEPA legal challenge. The SCOTUS decision on the “reciprocal” and “emergency” tariffs are to be resolved in coming weeks (mid-Oct) after the Appeals Court ruled against the emergency Trump tariffs.

The above chart highlights the weak numbers in the International RAC operations but at least we see profits. The higher base of program cars reduces a major piece of the puzzle seen in the Americas.
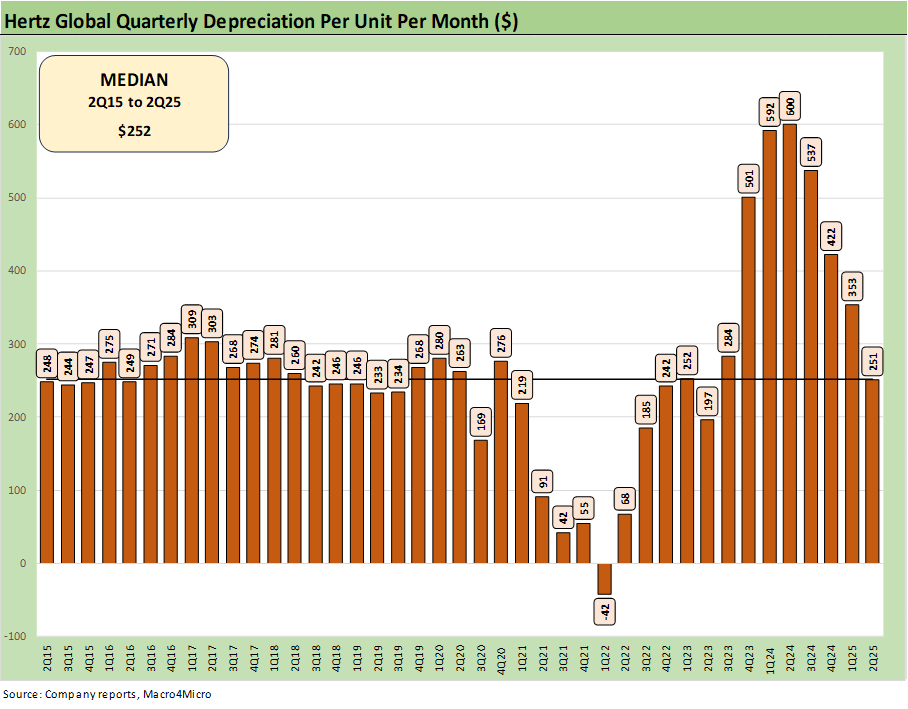
The above chart highlights the “Depreciation per unit per month” (“DPU”) timeline across the recent cycles starting in 2015. The most striking numbers in the chart can be found in the benefits provided by the spike in used car prices with the supply-demand imbalance for used cars narrowly and vehicles broadly after COVID and semiconductors. The size of the bars in 2021-2022 and where they migrated into 2024 is an obviously negative visual capturing the financial performance of Hertz in 2024.
Managing residual value risk and building a core strength in used car remarketing has been a multi-cycle challenge in a world where technology is revolutionizing used cars sales. That is true for the dedicated used car players (Carvana, CarMax) and the leading franchise retailers (e.g. Lithia, AutoNation, etc.).
Hertz has tried to highlight how far it has come in used vehicle retail, and the recent Hertz-Amazon headline is the latest move. In the bigger context of financial risk and earnings, it is more about Hertz having a better read on forward residual risks and car rental pricing strategies to improve their ability to recover fleet costs.
Those 2Q21 to 2Q22 numbers drove record margins for Americas RAC segment including 34% in 2Q21, 39% in 3Q21, 32% in 4Q21, 34% in 1Q22, 33% in 2Q22, and 25% in 3Q22. That level of profitability fueled cash flow and EBITDA increases that sent debt/EBITDA metrics well below 1.0x in 2021-2022.
As the DPU chart drives home, that unit cost advantage reversed with a vengeance into 2023-2024 as EBITDA spiraled into the negative zone in late 2023 and into 2024. Peak travel period margins started to get cut in half in 2023 and then the serious loss period started.
Even operating in a normal environment was a struggle for Hertz in framing residual risks. Looking back, the period of 2016-2017 was a very rough one for Hertz in fleet residual risk as Hertz completely mismanaged investor guidance on vehicle depreciation (a de facto cash expense line in car rental and EBITDA definition) before blindsiding them in 3Q16.
Investors went into that late 2016 period armed with bad information. The DPU numbers back in the pre-COVID period seem low in today’s context, but vehicles were also much cheaper then and there was less to recover.
Those pre-COVID years are not very important now, but they were a part of a history that has led to so much turnover and different leaders at Hertz. The chaos from there across 2016-2017 led to damaged credibility in the credit and equity markets until COVID erased it all and sent Hertz into Chapter 11. Many of the strategic priorities and new Hertz speech content on how they fix the company sounds very familiar across time.
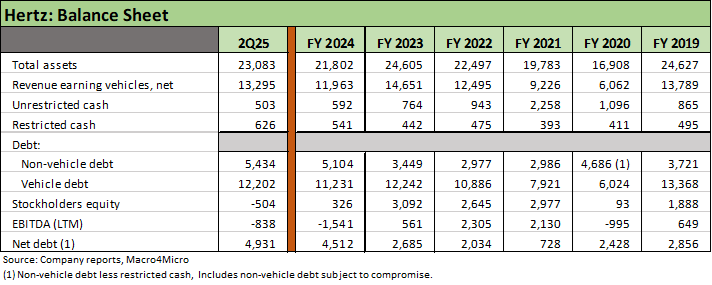
The above table captures the high-level balance sheet lines across total assets, revenue earning vehicles and the cash level with unrestricted cash low in historical context. The negative (-838 mn) EBITDA LTM is a long way from the $1 bn EBITDA targeted by 2027.
Unless Hertz starts reducing debt, EBITDA levels above $1 bn will be needed to have a viable balance sheet. That is certainly the case in the context of expected EV multiples (7x? 8x for a healthy Hertz?) and even justifying meaningful equity value commensurate with current levels (market cap $1.75 bn for Hertz, $5.7 bn for Avis).
For FY 2025, HTZ management cited the expectation of a slight negative EBITDA, which marked a slightly negative guidance revision. The $1 bn EBITDA line is a long way off.
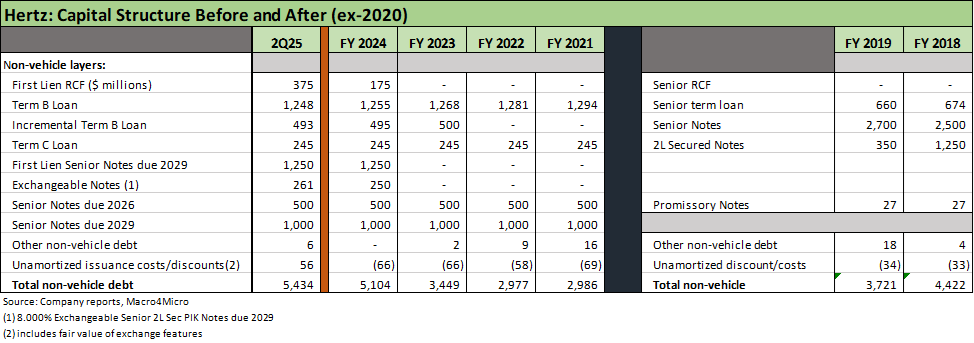
The above table shows the capital structure line items across time since 2018, and the line items underscore the magnitude of the realignment from before the Hertz Chapter 11 filing in 2020 and ensuing re-leveraging of HTZ as it emerged from bankruptcy. We detail the very active capital allocation events further below.
The easy takeaway is that we see a lot more non-vehicle debt for both total and net non-vehicle debt (Hertz “corporate debt.”) We also see a much more encumbered balance sheet from term loans and secured bonds.
The First Lien Senior Notes ($1.25 bn) and Exchangeable PIK Notes ($261 mn) were part of a very busy series of 2024 financings. We also see the First Lien Revolving Credit Facility at $375 mn drawn, down sequentially from 1Q25 but up from year end 2024. As we see in the charts, the earlier years saw the RCF rarely drawn at balance sheet date and were usually for letters of credit and overcollateralization needs in vehicle funding.
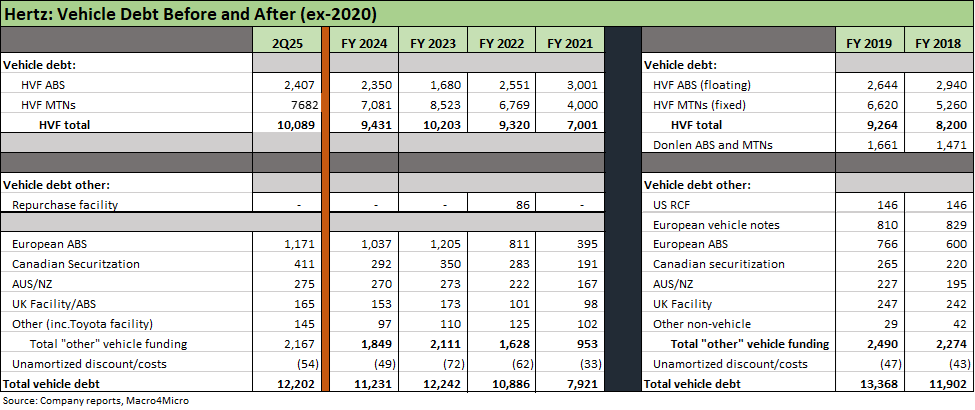
The above table breaks out the trends in vehicle funding totals across various funding entities in the ABS markets and with the banks. We see ABS and MTN totals along with an array of international funding “vehicles” in the international operations. These vehicle funding entities were on the front burner during COVID as the rental fleet turned into a crisis. The collapse of travel made car rental fleets the “world’s most expensive parking lot” with debt service and depreciation payment requirements at a time when travel, car rental revenue, and earnings collapsed.
The fleet chaos, cash drain, and downsizing are all part of a longer and separate history tied up in the Chapter 11 process. The history offers a reminder of how “liened up” Hertz has become yet again during an economic expansion and multiyear travel boom. That leveraging took place in a hot credit market when it could have been terming out unsecured debt and unencumbering assets for any potential cyclical rainy days ahead. Operating trends and fleet mistakes prevented such prudent measures. Too much secured debt in a bad market would offer a reminder of what was the final straw for Hertz in 2020 at a time when Avis could make it through.
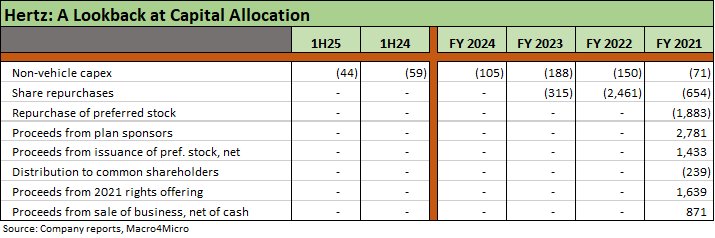
The above table goes more under the heading of “how we got here” as Hertz emerged from Chapter 11 at mid-2021 and then proceeded to derisk its private equity holders and engage in what at the time (and in retrospect) was a very aggressive set of financial policies in borrowing and buybacks.
That came with an extremely bullish stance on Electric Vehicles that soon sent the company into another residual value crisis and extremely negative EBITDA position. The company essentially turned once again into a quasi-distressed credit and lost access to the unsecured bond market.
This years peak season is over and it will barely put a dent in the earnings challenge the company faces.
See also:
Hertz:
Credit Snapshot: Hertz Global Holdings 6-12-25
Credit Crib Note: Hertz 5-14-24
Not Your Father's Hertz 2-7-23
Avis:
Avis Update: Peak Travel Season is Here 8-27-25
Credit Snapshot: Avis Budget Group 4-9-25
Credit Crib Note: Avis Budget Group 5-8-24
Avis: Gearing Up for a Transition Year in Fleet Costs 5-2-24
Avis: Credit Profile 8-3-23