
CPI August 2025: Slow Burn or Fleeting Adjustment?
CPI was slightly warmer following a benign PPI report, but a very bad weekly jobs claims number (27K higher) heightens FOMC tension.


Running a special on coffee, beef and apples.
The CPI debate will remain hot with jobs getting worse and CPI numbers (2.9% headline, 3.1% core) manageable at the aggregate levels. CPI still shows a lot of MoM sequential increases that flag inflation in key lines such as food, apparel, used and new vehicles, electricity, and piped gas while shelter also took a fresh turn in the wrong direction. The “All items” CPI ticked up on a MoM basis from +0.2% to +0.4% with the same for “All items less shelter.”
The question around tariffs will stay hot as the market seeks to sort out how tariff costs flow into price levels and purchasing power and how higher expenses for buyers along the supplier chains play out in both manufacturing and services. It will also be important to monitor strategic moves in the various goods ecosystems in supplier chains (cost mitigation, payroll, capex, reshoring, relocation, expansion plans, etc.).
The PPI this week marked somewhat of a reversal from last month after July posted some notably adverse sequential numbers across numerous lines items. You could see the mounting pressure in select MoM trends into July from springtime in both PPI and CPI in July, but the shift in this month’s PPI thickens the plot (see PPI Aug 2025: For my next trick… 9-10-25, Producer Price Index: A Snapshot of the Moving Parts 8-14-25).
With IEEPA facing a legal showdown in coming weeks, numerous Section 232 actions (e.g. pharma, semis, lumber, furniture) are ahead along with a need to finalize critical deals still in process (Canada, Mexico, China), and clarify some major “deals” in need a lot of more detail infill and clear interpretations of intent (the EU, Japan, and South Korea.).
The labor market pressures that are very much in evidence at this point got another data point with a weekly claims number well above consensus as CPI was released, so the FOMC ammo for a more aggressive easing is on the screen. That comes even as the market still faces a longer timeline lag on how these trade policies flow into cyclical risks via the consumer and corporate effects (see The Curve: Risk Tradeoff - Tariffs vs. UST Supply 9-1-25).
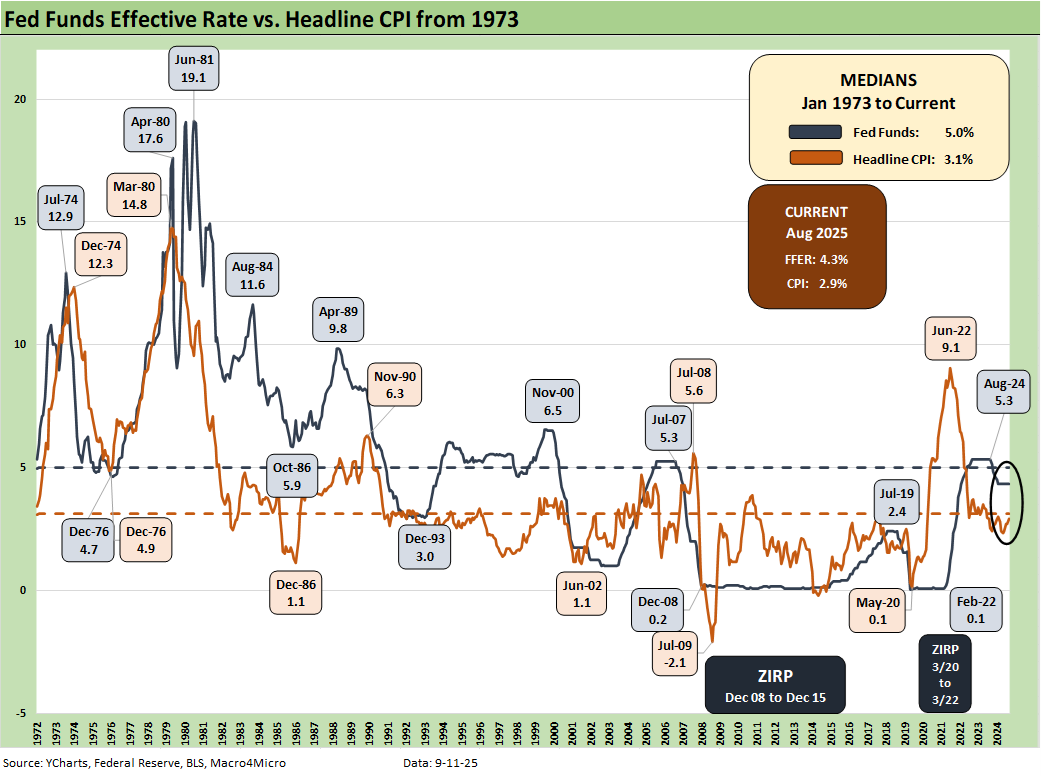
The above chart is our usual update of headline CPI across the cycles plotted against fed funds. Those of us who came of working age back in the 1970s stagflation years fully appreciate the caution of the FOMC in being worried about tariff effects and inflation and GDP growth. Their desire to come to grips with the flow-through effect of tariffs is rational and not partisan. Stagflation is the worst enemy and that risk is not gone.
The recent weakness in payrolls heightens the focus on the dual mandate (see Mini Market Lookback: Job Trends Worst Since COVID 9-6-25, Payrolls Aug 2025: Into the Weeds 9-5-25,Employment August 2025: Payroll Flight 9-5-25). Today posted up a weekly claims number of 263K (for week ended 9-6-25) that was well above consensus and the highest since late 2021.
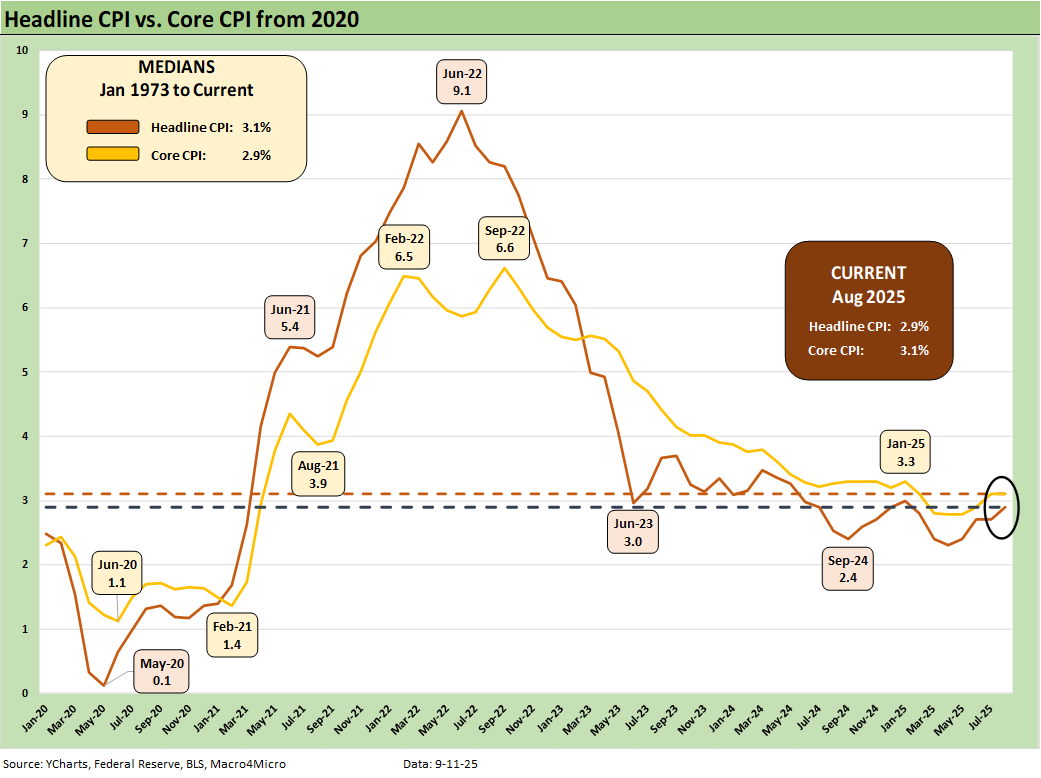
The above chart updates the running headline CPI vs. core CPI from 2020 for a frame of reference that is heavily wagged by energy. We frame recent numbers vs. the post-1973 medians in the box in the upper left of the chart.
The simple statement is the current headline CPI is 2 ticks below the long-term median from 1973 while the current core CPI is 2 ticks above the long-term median. With Trump’s usual display of technical virtuosity and grasp of the numbers, he frames this market as “we have no inflation.”
As someone who arrived to a job in NYC in June 1980 with a 22% Misery Index, these current numbers are high in the context of the new millennium but seem quite low vs. inflation pain cycles of decades gone by. Those 1973 to 1982 bouts of volatility are just what the FOMC is determined to avoid. Trump is about immediate gratification (300 bps cut now!).
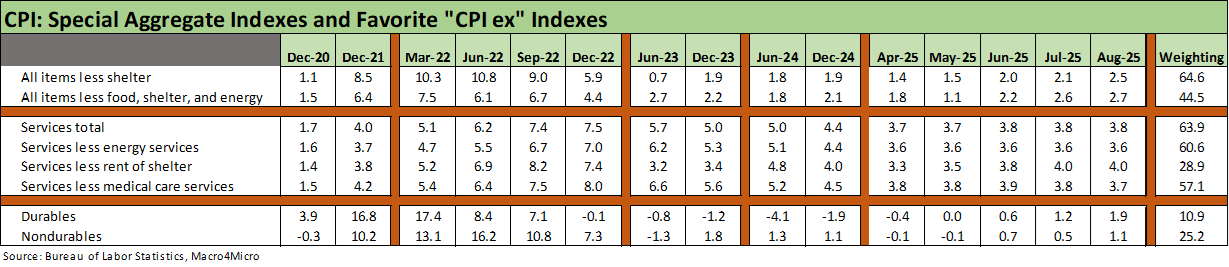
The above chart highlights some more specialized CPI indexes (the “CPI ex” lines), and these still look respectable on an ex-shelter basis at +2.5%. That said, we see the “all items ex shelter” line at a recent high after ending 2024 at +1.9% and 2023 at 1.9% June +0.7%) with 2022 a case study in ugly.
Goods (Durables and Nondurables) are low, but the Durables CPI had stepped up since the spring at back-to-back +0.4% months in July and August. Durables had exited its deflation zone on the back of tariff pressures. Nondurables MoM swung from -0.2% in July to +0.6% in August.
Services remains a challenge across a few variations with shelter or ex-shelter but has stabilized in the MoM trend line with 3 months in a row at +0.3%. That is good news given the size of the services sector in the economy.
The Big 5 groupings above include our own version of the automotive mix (see Automotive Inflation: More than Meets the Eye 10-17-22). Energy has been helping the headline number with deflation in gasoline, but electricity and piped gas are at high inflation numbers. Crude oil remains weak to this point, and that helped consumers during peak driving season.
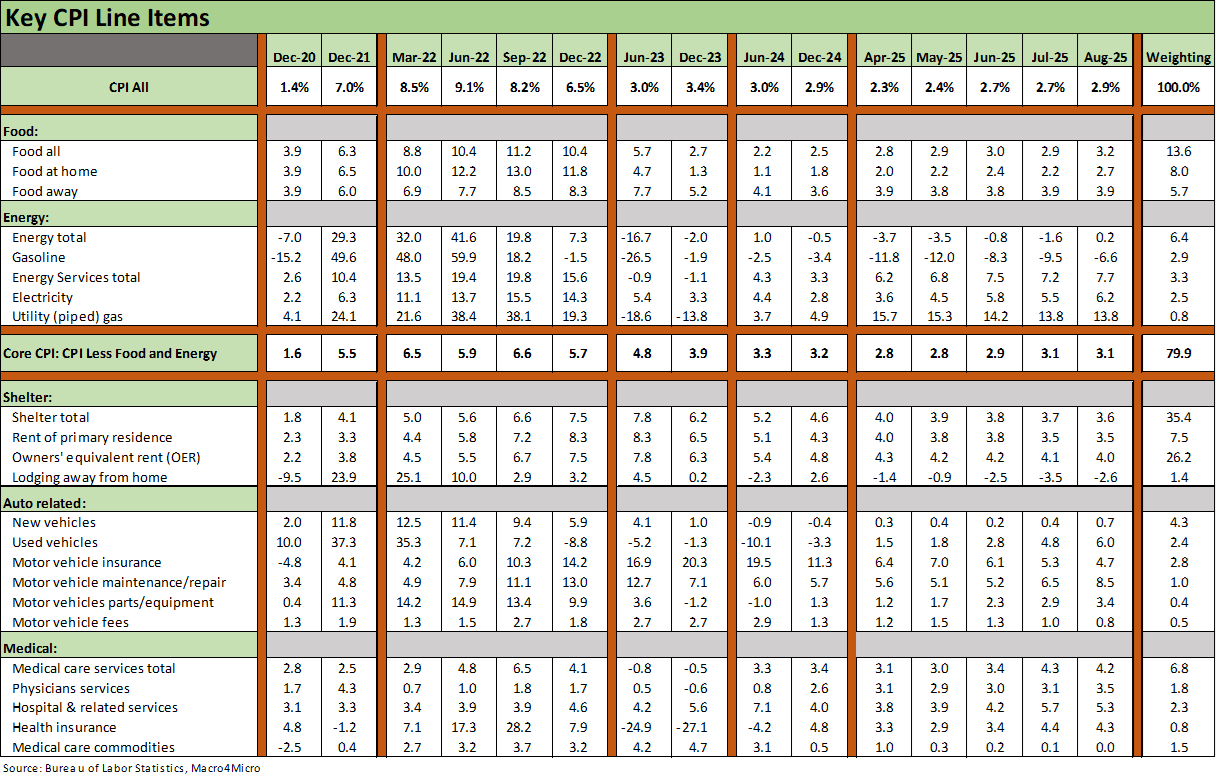
Last month we framed some of the auto tariff issues, and that is one major multiplier effects industry that bears close watching in coming months (see CPI July 2025: Slow Erosion of Purchasing Power 8-12-25). For autos, used vehicles posted +1.0% on the month (vs. negative in May and June and +0.5% in July). New vehicles also ticked higher to +0.3% MoM from +0.0% in July, and -0.3% in June and May. The OEMs remain very cautious in their strategy by eating some costs and managing the retail customer comfort zone while supporting dealer networks.
The full effects in automotive will play out over the course of late 2025 and into 2026 as the OEMs look to their supplier chains and internal cost-mitigation strategies to make the requisite adjustments. The auto trade rags are packed full of opinions and theories on how it will all play out. Major factors are a final set of terms for Mexico and Canada.
The Big 5 is where we see a lot of action with Food overall notably high on a MoM basis from 0.0% to +0.5% at +3.2% YoY. The crucial Food at Home line ran from -0.1% to +0.6%, but the interesting part is the tariff impacts on various food groups. We break out a few samples below:
Meats: Meats are up +7.3% YoY and August MoM up +1.8% again from +1.0% in July. The subcategory of “Beef and Veal” is +13.9% YoY and sharply higher at +2.7% MoM in August after +1.5% MoM for July.
Coffee: Coffee has been soaring in stores of late. Some bags not long ago in a nearby store that were priced around $10 are now over $20. In the CPI lines, Coffee is +20.9% YoY (21.7% for roasted coffee) and +3.6% MoM in August after +2.3% in July and +2.2% in June.
Bacon, Lettuce and Tomatoes: Your “BLT” is rising with bacon CPI (and related products such as sausage) at +5.4% YoY and +1.2% MoM vs. -0.5% in July. Lettuce is only +3.8% YoY but August saw +3.5% for MoM after +4.0% in in July. Tomatoes are at -1.2% YoY but are now making a surge at +4.5% MoM in August after +3.3% in July.
Apples and Bananas: Apples are at +9.6% YoY with August +3.5% MoM in August. Bananas posted +6.6% YoY with August +2.1% MoM vs. +0.4% in July and -0.9% in June.
Obviously, there are lot of line items low, flat and even deflating, but it is very hard to see how consumers ride the aisles and don’t feel it at the cash register.
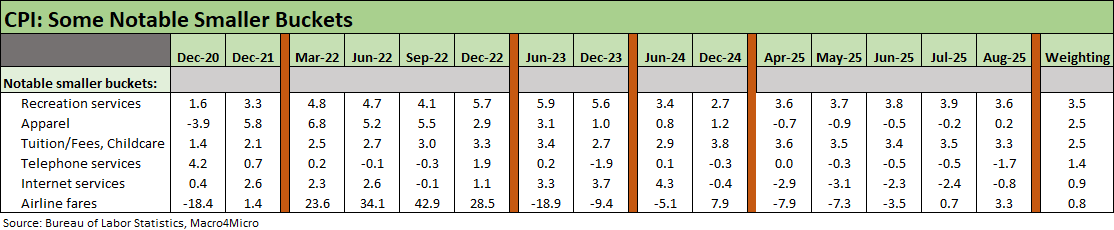
The above chart highlights some line items near and dear to households. We see some line items such as Apparel move sharply higher MoM (+0.5% August vs. +.01% July), but those apparel numbers from here will turn heavily on the IEEPA case given how that was used in slamming some of the small Asian “labor arb” countries in the reciprocal tariff program. Interestingly, Footwear tailed off sharply on a MoM basis after a big move in July. Recreation Services also tailed off MoM in August.
See other Inflation Related:
PPI Aug 2025: For my next trick… 9-10-25
PCE July 2025: Prices, Income and Outlays 8-29-25
Producer Price Index: A Snapshot of the Moving Parts 8-14-25
CPI July 2025: Slow Erosion of Purchasing Power 8-12-25
PCE June 2025: Prices, Income, and Outlays 7-31-25
Employment Cost Index 2Q25: Labor in Quiet Mode 7-31-25
CPI June 2025: Slow Flowthrough but Starting 7-15-25
PCE May 2025: Personal Income and Outlays 6-27-25
CPI May 2025: The Slow Tariff Policy Grind 6-11-25
Employment Cost Index 1Q25: Labor is Not the Main Worry 5-1-25
Inflation: The Grocery Price Thing vs. Energy 12-16-24
Inflation Timelines: Cyclical Histories, Key CPI Buckets11-20-23
Fed Funds – Inflation Differentials: Strange History 7-1-23
Fed Funds, CPI, and the Stairway to Where? 10-20-22
Automotive Inflation: More than Meets the Eye10-17-22
Inflation: Events ‘R’ Us Timeline 10-6-22
See also:
Credit Markets: Spread Risk Lurks, but the World Waits 9-8-25
The Curve: The Road to Easing has been Long. 9-8-25
Footnotes and Flashbacks: Asset Returns 9-6-25
Mini Market Lookback: Job Trends Worst Since COVID 9-6-25
Payrolls Aug 2025: Into the Weeds 9-5-25
Employment August 2025: Payroll Flight 9-5-25
JOLTS July 2025: Job Market Softening, Not Retrenching 9-3-25
The Curve: Risk Tradeoff - Tariffs vs. UST Supply 9-1-25
Mini Market Lookback: Tariffs Back on Front Burner 8-30-25
2Q25 GDP: Second Estimate, Updated Distortion Lines 8-28-25
Durable Goods July 2025: Signs of Underlying Stability 8-26-25
The Curve: Powell’s Relief Pitch 8-24-25
Mini Market Lookback: The Popeye Powell Effect 8-23-25
Mini Market Lookback: Rising Inflation, Steady Low Growth? 8-16-25
Industrial Production July 2025: Capacity Utilization 8-15-25
Retail Sales Jul25: Cautious Optimism in the Aisles 8-15-25
Mini Market Lookback: Ghosts of Economics Past 8-9-25
Macro Menu: There is More Than “Recession” to Consider 8-5-25
Mini Market Lookback: Welcome To the New World of Data 8-2-25
Happiness is Doing Your Own Report Card 8-1-25