
Existing Home Sales July 2025: Rays of Hope Brighter on Rates?
July saw 3 of 4 regions post increases in existing home sales. Single family prices dipped sequentially but were higher YoY.


July existing home sales saw median prices decline MoM and posted the 25th straight YoY increase. Inventory rose again alongside prices. The dysfunction is stubborn on inventory vs. price dynamics in recent months although that comes with product tier and regional asterisks where mix can drive the headline price trends.
As we see with homebuilders, the existing home sales trend will see real estate brokers everywhere watching the PCE price index (Aug 2025) and the August payroll release very closely in coming days (plus one more CPI release during Sept prior to the FOMC meeting).
The hope is not just for an FOMC easing in mid-Sept but also a flattening or downward shift of the UST curve (or at least absence of a bear steepening). The period after the Sept 2024 easing did not cooperate on mortgage rates, so this is hardly a layup even if Powell and team pull the trigger.
The equity market confidence in better housing news ahead has been evident in the performance of the Homebuilder ETF (XHB) and the major builders (see Footnotes & Flashbacks: Asset Returns 8-16-25). Whether Fed action and macro fundamentals will translate into materially higher existing sales volumes will be tied more to mortgage rates and homebuyer appetites with the cyclical question marks and consumer confidence still uncertain.
The above chart shows the sales deltas by price tier for July, and we see increases for the highest 4 price tiers with the 2 lowest tiers posting decreases. We look at this mix from a different angle in the final chart in this collection.
The usual factor is that lower price tiers can more logically get squeezed out based on mortgage qualifications and monthly payment stress. That is a pattern we have seen frequently over the past year and seems likely to remain a factor unless Fed action or a more measured set of inflation numbers can help with mortgage rates getting back into the low 6% zone. We saw that 6.0% area briefly around the -50 bps easing in Sept 2024 ahead of 2 more cuts in 4Q24. That mortgage level did not last long, and the steepening risk of the UST curve remains high heading into this fall. We update the UST dynamics in Footnotes & Flashbacks: State of Yields (8-17-25).
The rising price trends are not helping the affordability challenge, but mortgage rates are a very important variable for monthly payments. The barrier to selling in a “move up” trade, to downsize, and/or to make an empty nester change still reflects the “locked in” mortgage problem of trying to sell a 3% or 4% mortgage house and take on a mid to high 6% mortgage on other side of the trade. That is a well-known problem at this point.
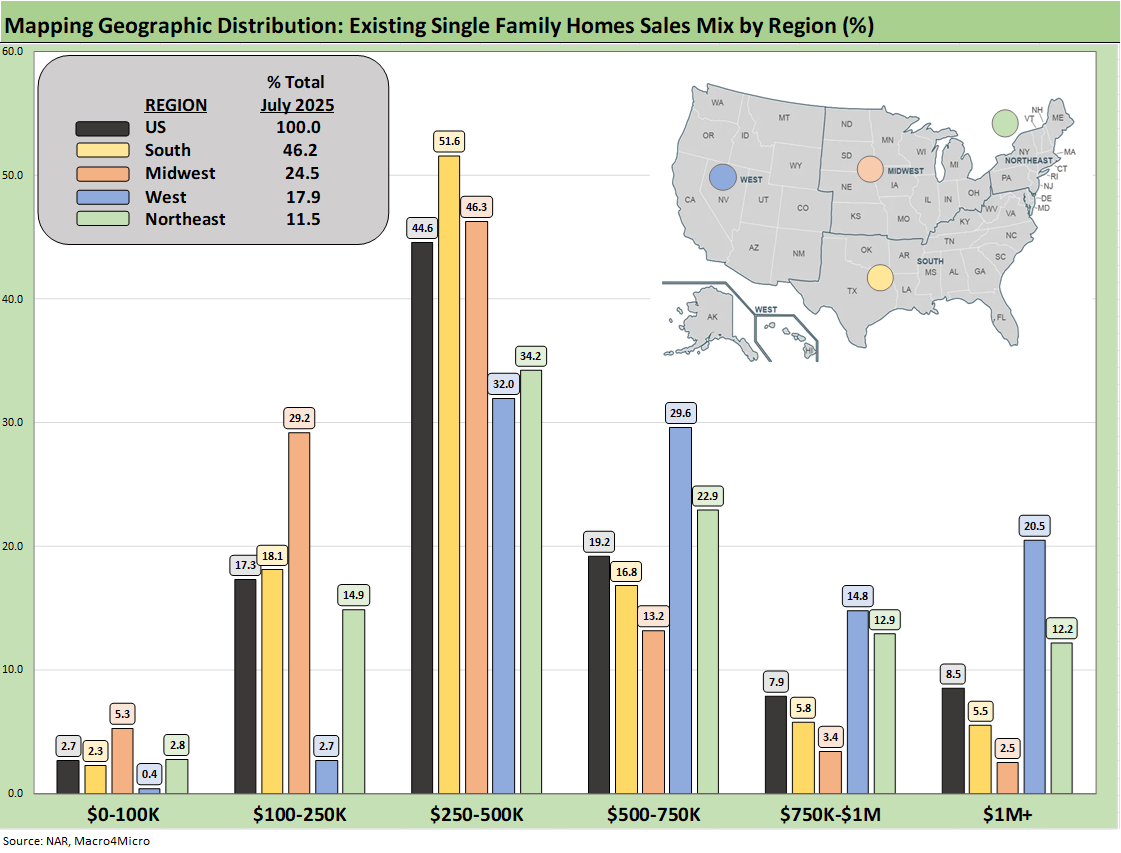
The above chart shows the geographic mix of volumes and details on price mix by region. The South is the main event in single family volumes whether new or existing at around 45% of volumes for single family existing sales.
For the bar chart, we break out the mix for each region by price tier. For example, the South shows over 51% of its existing home sales volume in the $250k to $500K and almost 17% of its sales in the $500 to $750K bucket. The bars for each region add up to 100%.
The high cost of homes in the West (notably California) is clear enough in the West price mix just by glancing at the bar chart with almost 21% at prices over $1 million. The second highest in the $1 million club is the Northeast at over 12%.
We see a big concentration in the $250K to $500K bracket for all regions at over 44% of the total and a heavy weighting in the $100K to $250K bracket for the Midwest at 29%. The map explains what states are in each Census region. There is a very wide range of home price profiles in the West and Midwest.
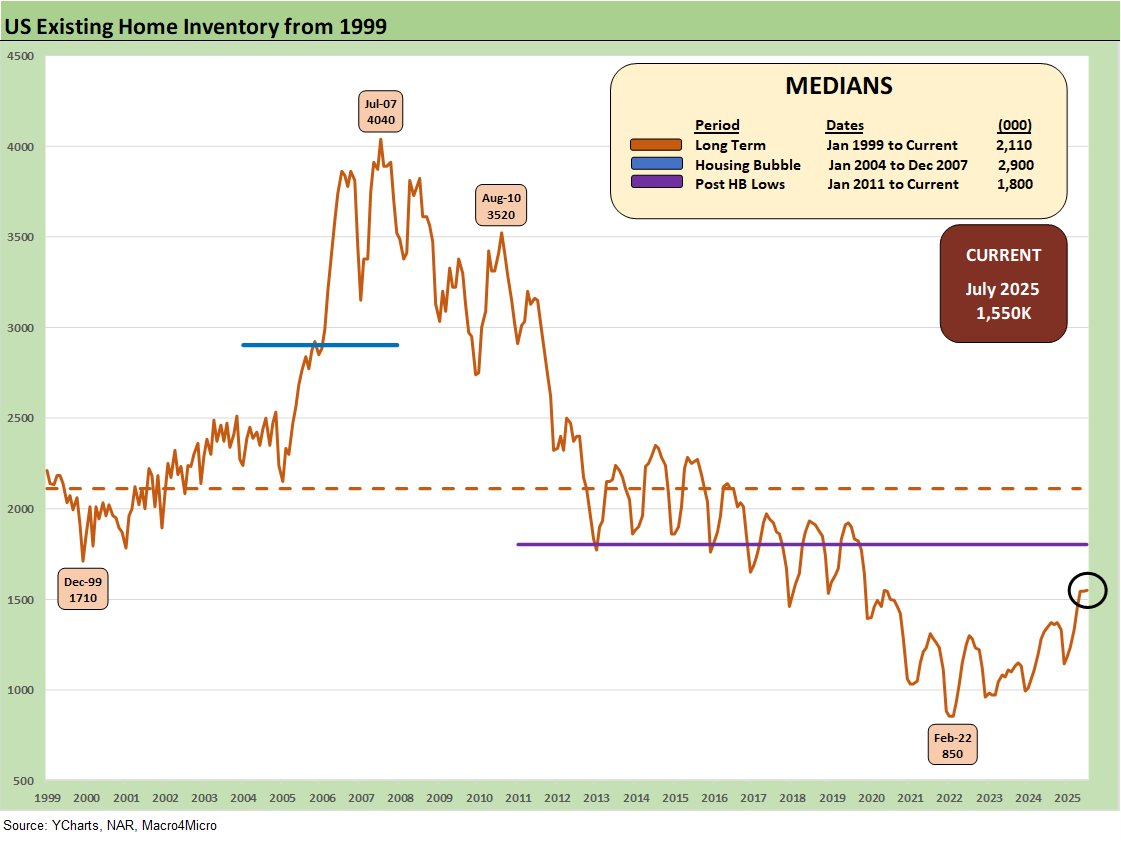
Inventory ticked slightly higher by +0.6% to 1.55 million units but +15.7% higher YoY. The existing home inventory balance has shown a steady rise off the sub-1 million lows of 2022-2023. Inventory had risen into the 1.3 million handle range in 2024 before dipping back down to a recent low of 1.14 million to close out 2024. We have bounced off those numbers in 2025 to get back to the current 1.55 million.
We see the Feb 2022 lows at 850K above when demand was very high just before the tightening cycle kicked into gear in March 2022. Separately, single family home inventory is up by +15.3% YoY and down +1.5% sequentially. Condos and Co-op inventory is up by +19.8% YoY but -0.5% from June 2025.
The ability of prices to push higher in the face of rising YoY inventory has been one of the more multilayered issues across price tiers and regions. Whether it is the time-honored gap between seller and buyer or the belief that a sharp yield curve move could favor one side or the other, volumes suffer (and brokers are not too happy either).
We see many in the trade focusing on 6.0% as the trigger point for a sharp rise in sales. As noted earlier, the mortgage market was last at 6% in Sept 2024 around the FOMC easing but only briefly before the UST curve went higher and steeper and took mortgage rates along with it. Fed funds cuts in the fall of 2024 (that was 100 bps in 3 moves) were not magic for mortgages then, and the stagflation risks are higher in Sept 2025.
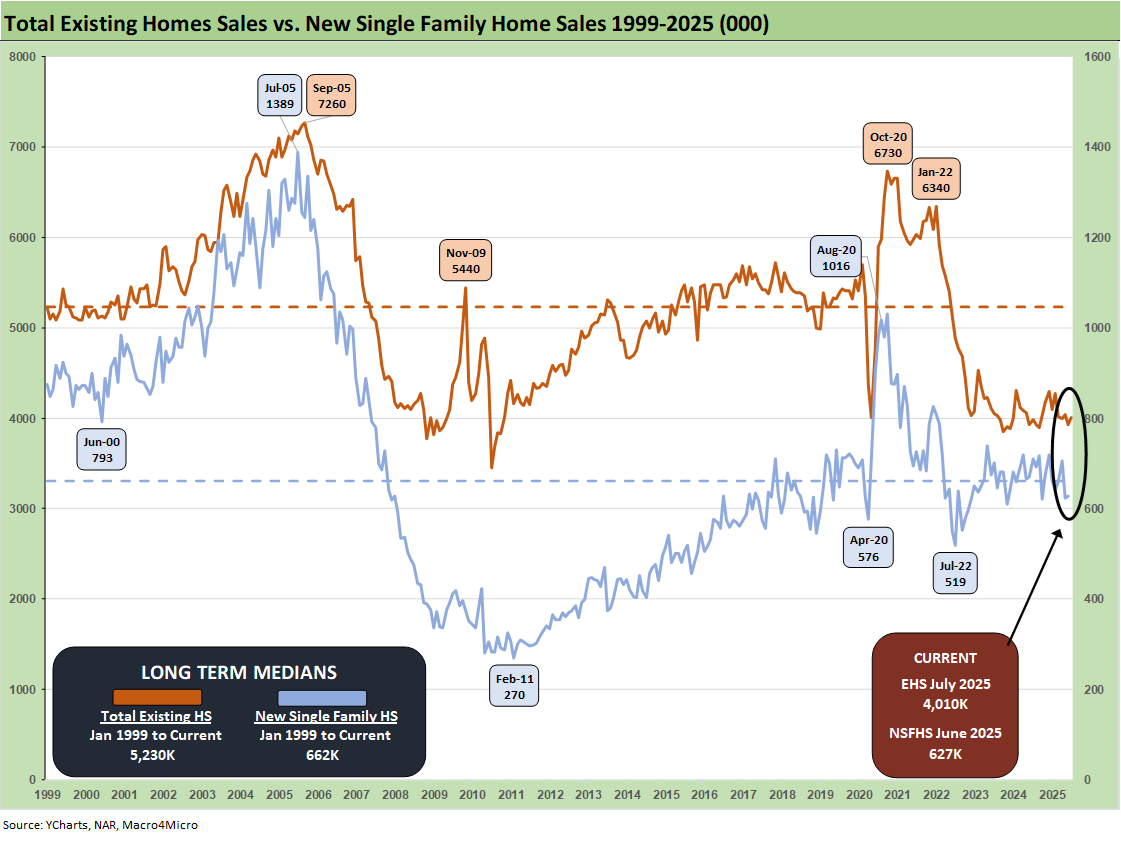
The above two-sided chart updates the trend line in total existing home sales vs. new single family homes. We get the new home sales numbers for July on Monday, so we include the June 2025 new home number above. With mortgage rates shifting into the mid-6% range again and Freddie Mac’s benchmark at 6.58% (reset today at noon), the affordability headwinds are lighter but still a barrier for some who’d rather wait.
Color from the homebuilders in some recent earnings reports has been somewhat mixed (see links at bottom). The feedback from 1Q25 and recent 2Q25 reports so far is that the mortgage buydowns and incentives have not been as effective in the new home sales market even as the existing home sales markets are still seeing a gap between what the seller wants and how the buyer sees the world. The price expectation gap in turn continues to undermine transaction volumes.
We see a continued rise in inventory and higher median prices YoY, which shows that the existing home sales market remains in somewhat of a state of dysfunction. That reinforces the view that there are some expectation challenges in the buyer and seller ranks.
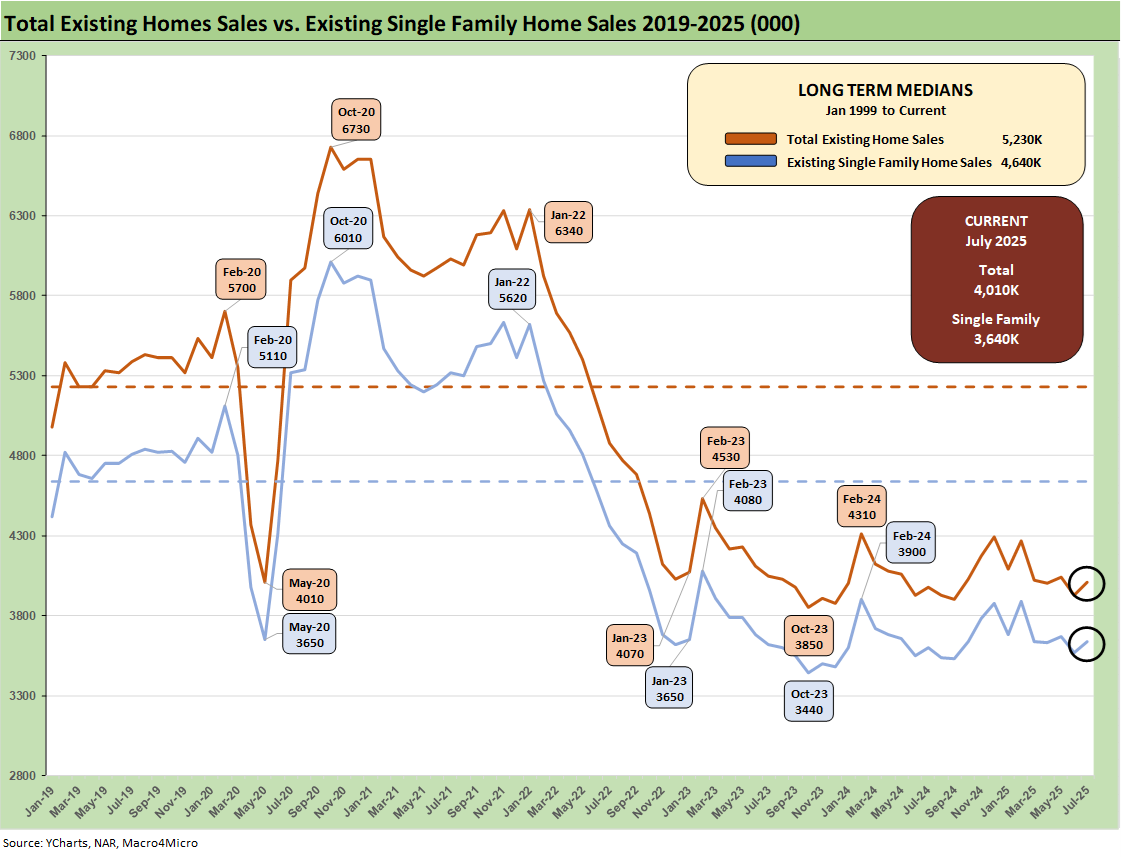
The above chart breaks out the timeline for single family alone of 3.64 million vs. total existing home sales of 4.01 million, which is well below the long-term median (from Jan 1999) of 5.23 million for total existing homes. Single family was +2.0% sequentially and +0.6% YoY. The lower line is ex-condo/ex-co-ops. We saw 370K in condos and co-ops in July 2025, down from 380K YoY in July 2024 but up from 360K in June 2025.
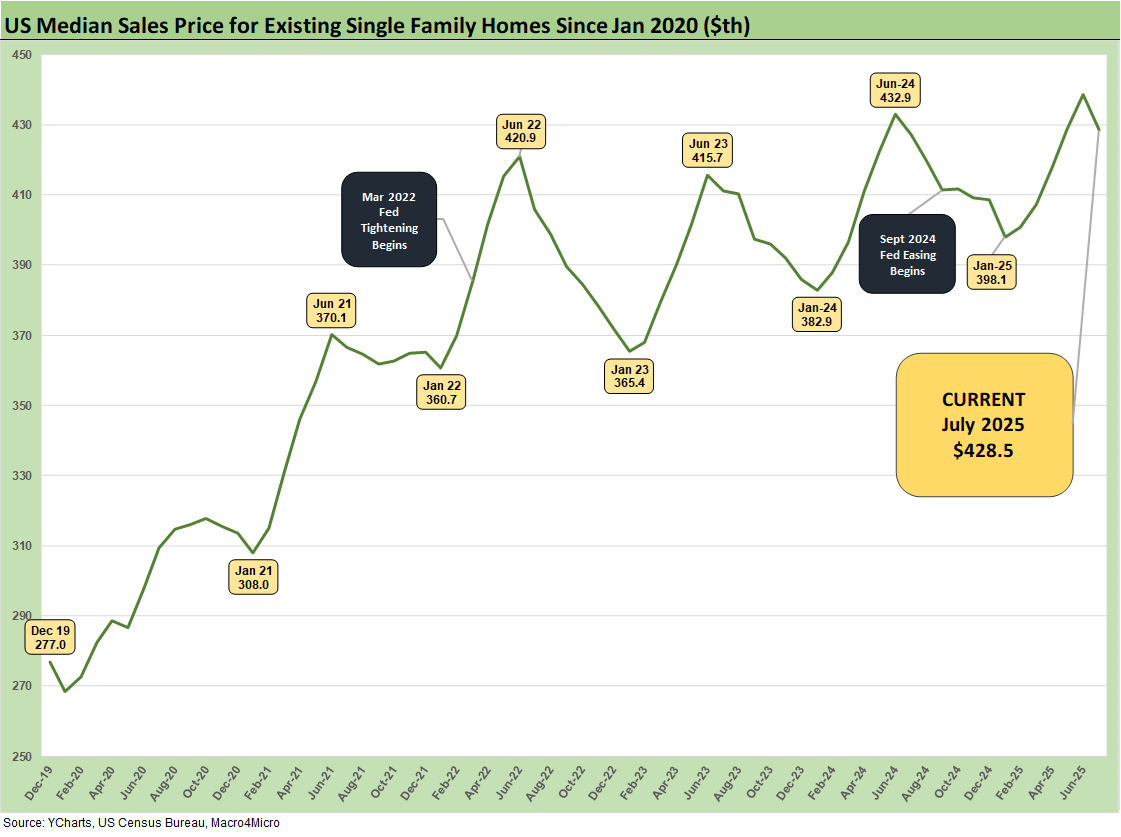
The above chart updates the median price for existing single-family homes at $428.5 K after June 2025 hit a record $438.6K and trumped the June 2024 $432.9K. The median price in July 2025 is dramatically above the $308K level back in Jan 2021 and $277K in Dec 2019 when mortgage rates were in a different zip code.
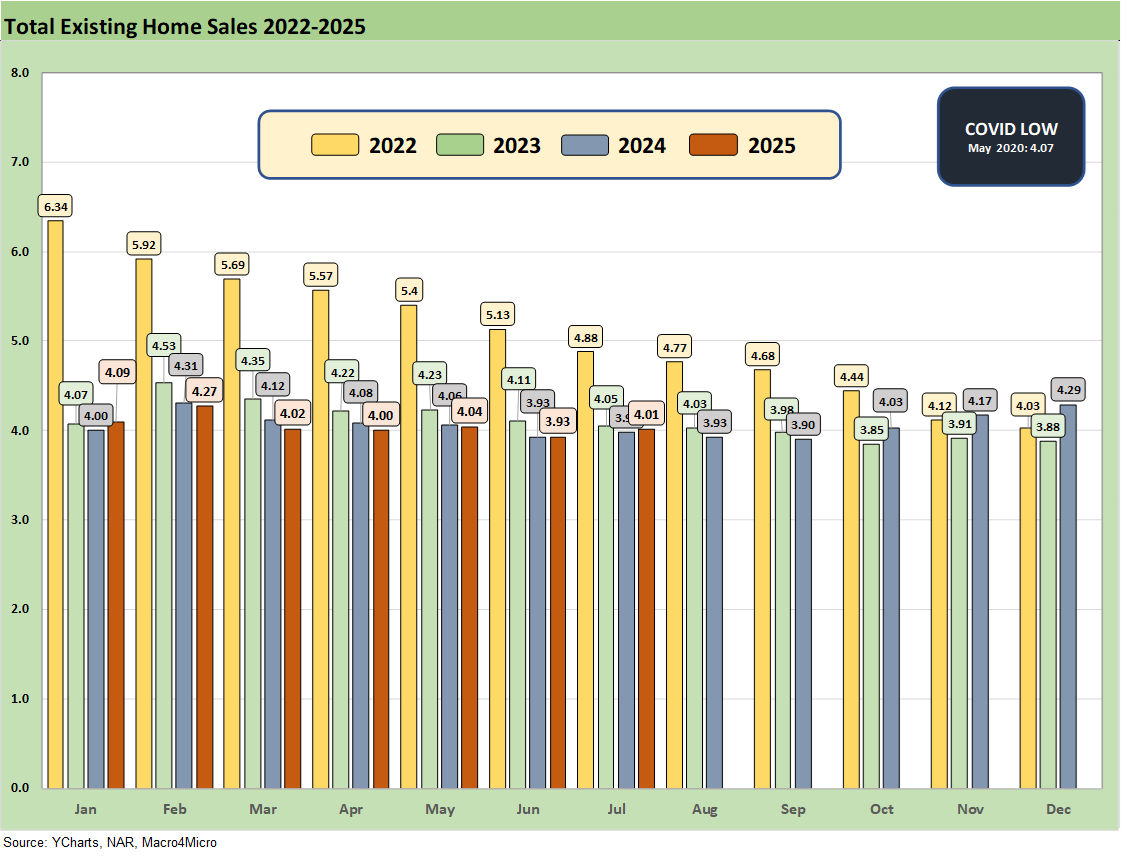
The above chart updates the monthly existing home sales across the timeline from Jan 2022 through July 2025. The existing home sales volume is a long way from the mid-6 and high 5 million handles of 2021 and then into early 2022 when many homeowners refinanced, and new buyers locked in low mortgages. ZIRP ended in March 2022 and then the UST migration began.
The July 2025 total of 4.01 million is below the May 2020 COVID trough of 4.07, so the current run rates remain quite low in cyclical context. We had a few more sub-4 million handles along the way as noted in the chart, so this has been a brutal period for real estate brokers.
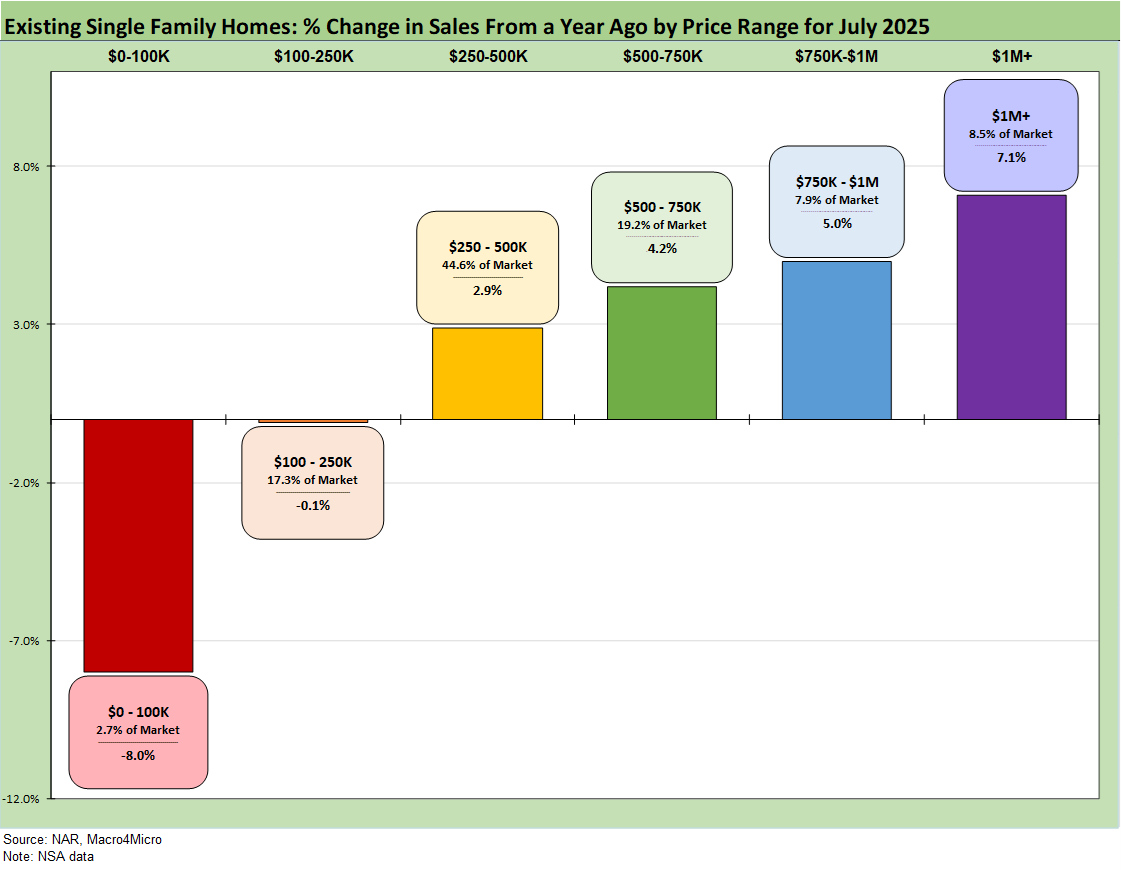
The above chart revisits the topical area addressed earlier on the existing home sales deltas by price tier. The largest tier is the $250K to $500K at over 44% of sales volumes, and that tier was only at +2.9% in a month that is in the peak selling season.
The challenge for the lower tier buyer is somewhat evident this month with the $100K to $250K tier at -0.1% in a tier that comprises 17.3% of volume. The $500K to $750K tier is 19.2% of the market and was up by +4.2% for July. We see the $1+ million up by +7.1% for July. The highest price tier is +8.5% of the market.
Housing sector:
Home Starts July 2025: Favorable Growth YoY Driven by South 8-19-25
New Home Sales June 2025: Mixed Bag 7-24-25
Homebuilders:
Taylor Morrison 2Q25: Resilient but Feeling the Same Macro Pressure 7-25-25
PulteGroup 2Q25: Still-Lofty Margins see a Mild Fade 7-23-25
D.R. Horton 3Q25: Material Slowdown Still Good Enough 7-22-25
KB Home 2Q25: Negative Industry Trends Keep Coming 6-25-25
Lennar 2Q25: Bellwether Blues 6-20-25
Credit Snapshot: Meritage Homes (MTH) 5-30-25
Homebuilder Rankings: Volumes, Market Caps, ASPs 5-28-25
Credit Snapshot: PulteGroup (PHM) 5-7-25
Credit Snapshot: D.R. Horton (DHI) 4-28-25
Credit Snapshot: Lennar (LEN) 4-15-25
Credit Snapshot: Taylor Morrison Home Corp (TMHC) 4-2-25
Lennar: Cash Flow and Balance Sheet > Gross Margins 3-24-25
KB Home 1Q25: The Consumer Theme Piles On 3-25-25
Toll Brothers 1Q25: Performing with a Net 2-20-25
Credit Crib Note: Lennar Corp (LEN) 1-30-25