
Footnotes & Flashbacks: Asset Returns 9-14-25
Constructive asset returns were once again unfazed by US political toxicity with the FOMC and SCOTUS (IEEPA) the major events near term.


The world is a mixed picture, but asset returns remain a day at the beach.
Equities and bonds had a relatively solid week and there was no meaningful reaction to the usual left-right toxic shocks after another round of political violence that is in fact becoming the norm. No one is defusing the hate-fest from the top down (despite some ceremonial language) while bottom-up feedback requires body armor.
This week we get the official news from the FOMC on rates and related color from the quarterly SEP and dot plots. The market awaits any hint of how the Fed might be leaning one way or the other in their forecasts subject to the SCOTUS ruling on IEEPA tariffs (see Mini Market Lookback: Ugly Week in America, Mild in Markets 9-13-25).
The past week of inflation releases (CPI, PPI) were not exactly a split decision, but they added up to a small net negative on the warm CPI details trumping a cooler PPI. That CPI reading was not enough to rattle the markets (see CPI August 2025: Slow Burn or Fleeting Adjustment? 9-11-25, PPI Aug 2025: For my next trick… 9-10-25).
The IEEPA appeal might not be cleaned up until November, so the trade progress could turn on whether the “other side of the table” will have its bottomless retaliation arsenal available. The tariffs remain in effect pending the decision, but with Trump demanding that the EU and Mexico slap high tariffs on China, the prospects of a clean timeline for China and Mexico deals are under a cloud while Europe could take issue with the interpretations of what they have agreed to with the US.
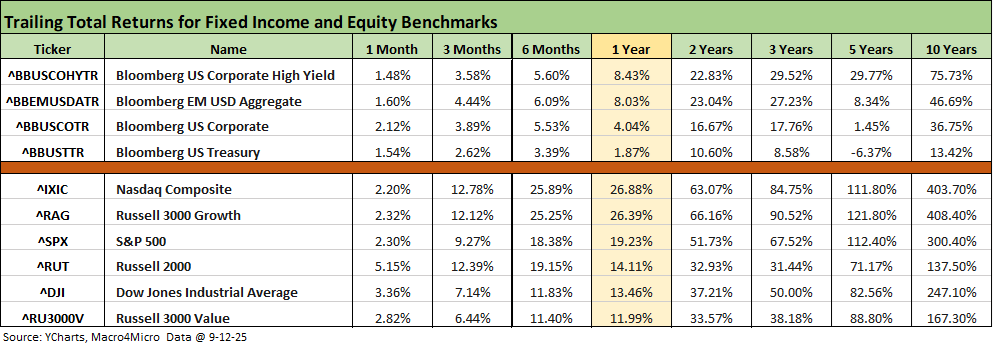
The above table updates the running returns for the high-level benchmarks we watch. We line up the fixed income and equity benchmarks separately in descending order of 1-year total returns.
We see all the lines and columns turning up in positive range until the trailing 5 years for the UST index that reflects the tightening cycle and UST curve migration.
The healthy double digit returns in equities over 6 months and 1 year tell a favorable story of market expectations from that investor base. We note that the credit markets have generally led the way on predicting trouble and not equities, but the credit asset classes are posting tight spreads with HY in the June 2007 credit bubble range and IG more in line with past credit cycle peaks.
The rolling return visual
In the next section, we get into the details of the 32 ETFs and benchmarks for a mix of trailing periods. Below we offer a condensed 4-chart view for an easy visual on how the mix of positive vs. negative returns shape up. This is a useful exercise we do each week looking for signals across industry groups and asset classes.
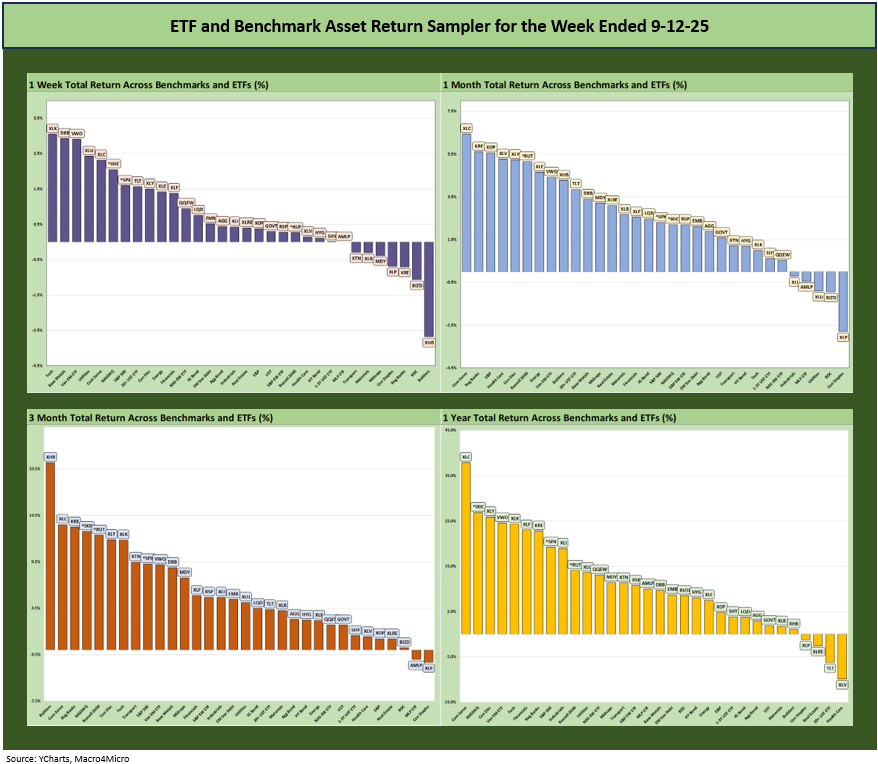
The symmetry of positive vs. negative above is clear enough with overwhelmingly positive returns across all the timelines presented. We detail the moving parts further below and add a YTD return profile as well.
The Magnificent 7 heavy ETFs…
Some of the benchmarks and industry ETFs we include have issuer concentration elements that leave them wagged by a few names. When looking across some of the bellwether industry and subsector ETFs in the rankings, it is good to keep in mind which narrow ETFs (vs. broad market benchmarks) get wagged more by the “Magnificent 7” including Consumer Discretionary (XLY) with Amazon and Tesla, Tech (XLK) with Microsoft, Apple, and NVIDIA, and Communications Services (XLC) with Alphabet and Meta.
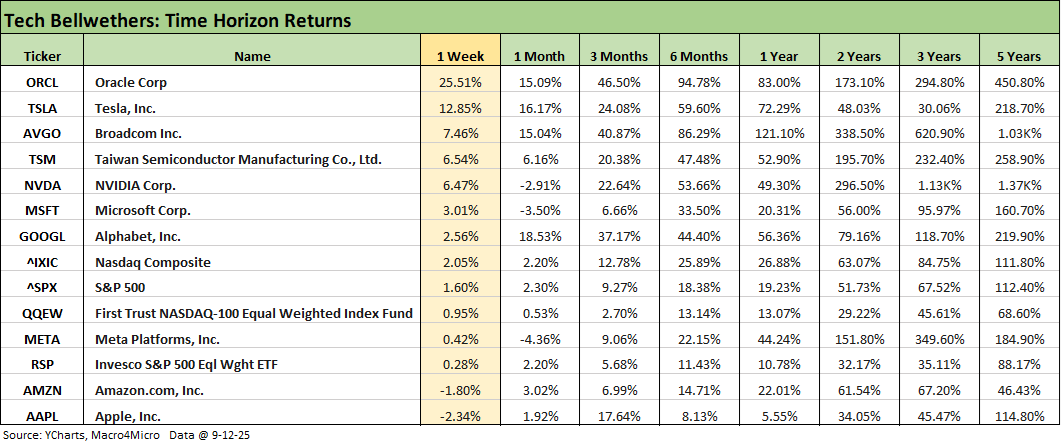
We already looked at the tech bellwether lineup in our Mini Market Lookback: Ugly Week in America, Mild in Markets (9-13-25). We added Oracle to the list this week (that was overdue given its Top 10 market cap), and this week saw a major home run from ORCL after its earnings report and the related commentary from the company.
If we look at the trailing 3 months, 6 months, and 1 year, the numbers show “Magnificent” numbers for Broadcom and Oracle. We also see some “small m” magnificence from some the of traditional Mag 7 players whose equities have been struggling (notably Apple).
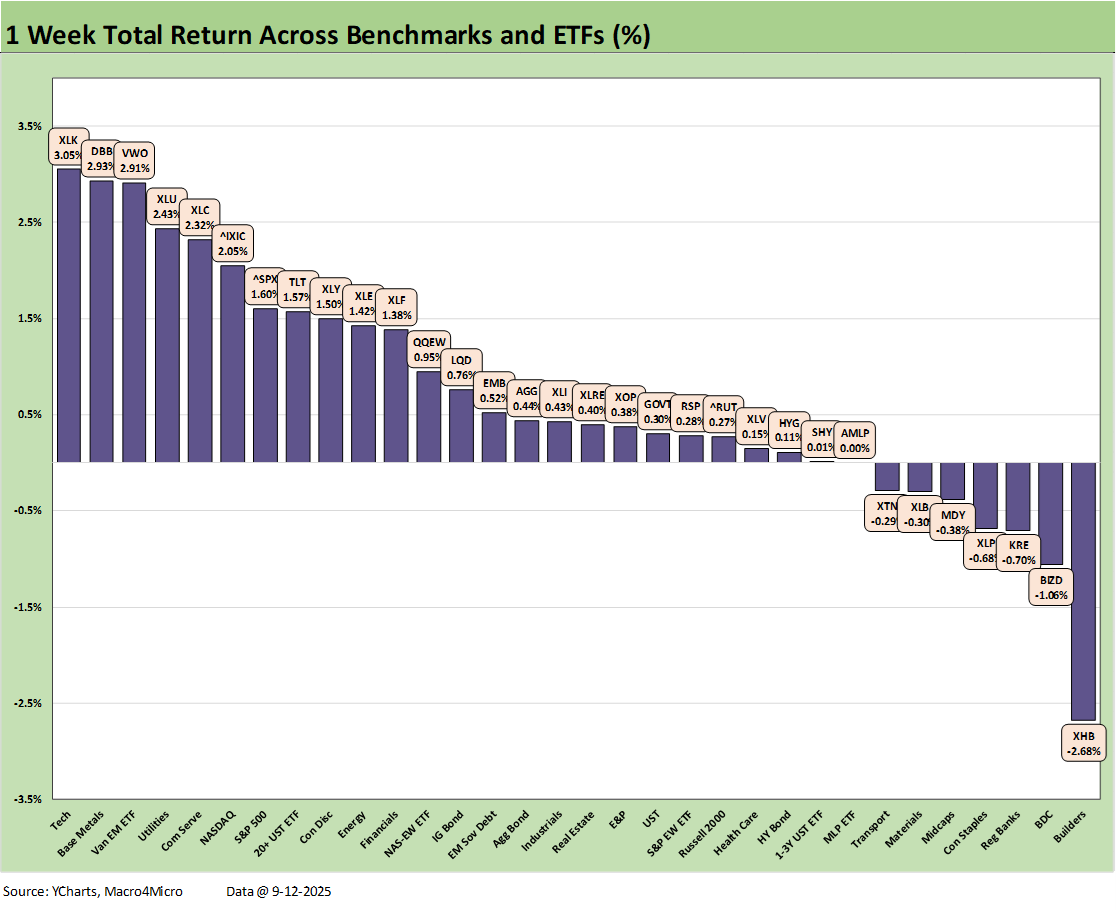
We look at the trailing 1-week returns and the 25-7 score in our Mini Market Lookback: Ugly Week in America, Mild in Markets (9-13-25). While tech did have a strong week as covered in the earlier bellwether chart, we do see some ETFs such as Base Metals (DBB), EM Equities (VWO), and Utilities (XLU) in the top 5. The Tech ETF (XLK) at #1 includes Oracle, Broadcom and NVDIA with their banner week.
The Homebuilder ETF (XHB) was counterintuitive in the trend of lower long UST long rates and more attractive mortgage rates. XHB has posted quite a rally for the rolling 3 months at +20.2%, and the weakness this past week could simply be some defensive moves ahead of the FOMC, the risk of guarded commentary from Powell, and/or a SEP report and dot plot that could roil optimism around the UST curve. Most remember the big rally in mortgages that did not last long after the Sept 2024 -50 bps easing. The rally soon gave way to a bear steepening and sharp rise in mortgage rates.
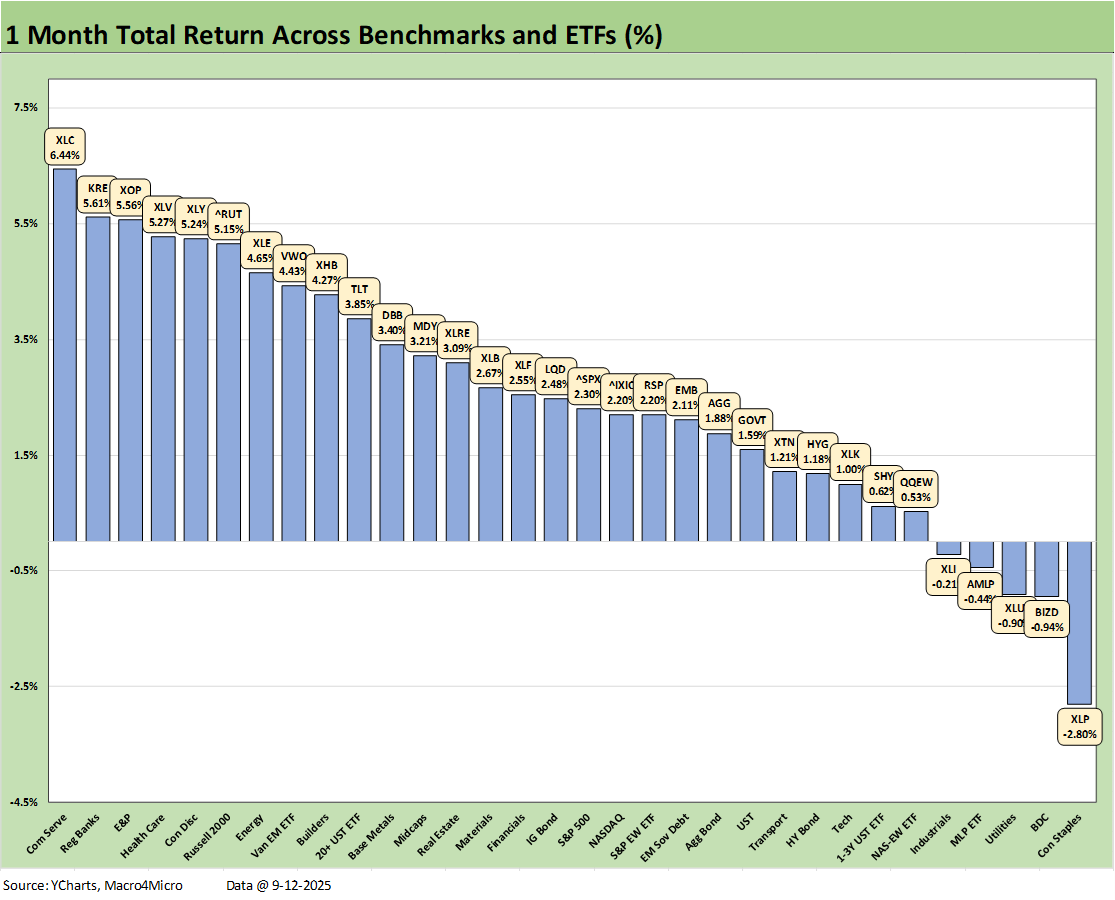
The 1-month score of 27-5 shows a comeback for energy (XLE, XOP) and small cap Russell 2000 with Regional Banks (KRE) at #2 helping small caps. Health Care (XLV) made the top quartile but remains mired in last place LTM and in the bottom quartile YTD. On the low end, we see Industrials (XLI), Midstream Energy (AMLP), Utilities (XLU), BDCs (BIZD) and Consumer Staples (XLP) in the red.
Tech carried #1 with Communications Services (XLC), but the Tech ETF (XLK) is all the way down the ranks in the bottom quartile. We also see the Equal Weight NASDAQ 100 ETF (QQEW) in the bottom quartile. As noted earlier in the tech bellwether chart, the 1-month trailing period was a sloppy one for the Mag 7 with 3 posting negative returns (NVDA, MSFT,META). Meanwhile, AAPL and AMZN posted low single digits.
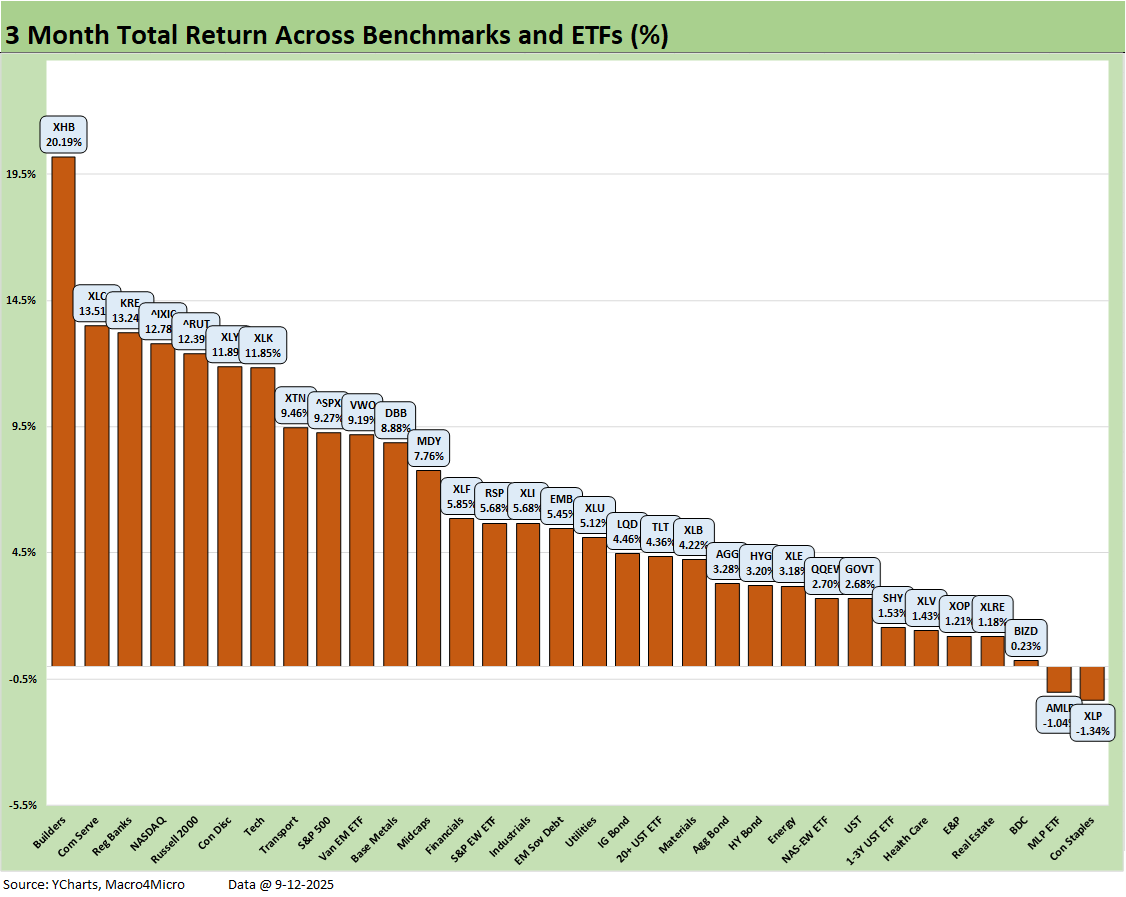
The post-April period has been very solid as the crow flies, and we see that in the trailing 3-month horizon above with Homebuilders (XHB) pulling away. The score of 30-2 is clear enough with only Consumer Staples (XLP) and Midstream Energy (AMLP) in the red. We see strong numbers and double-digit returns for 7 of the 8 benchmarks and ETFs in the top quartile. That includes 4 Mag 7 heavy benchmarks and ETFs. It is notable that both the tech heavy NASDAQ and the Russell 2000 small caps were both in the top quartile. The S&P 500 was just across the line at the top of the second quartile.
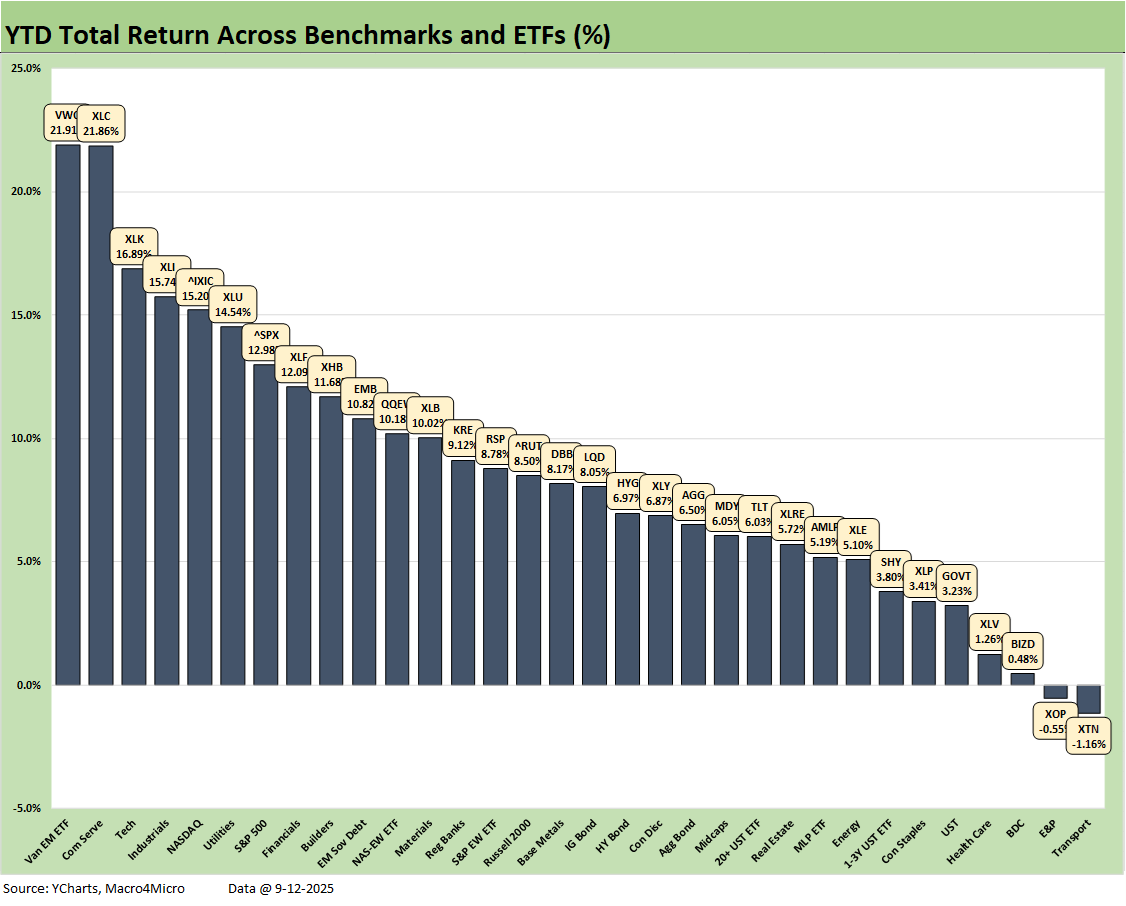
It is no mystery that the equity markets broadly – and notably for large caps – are setting the pace for a strong year as highlighted by the 30-2 score in the return numbers above. All the bond ETFs are also in positive range. The winners YTD include EM Equities (VWO) barely edging out Communications Services (XLC) for #1. Seeing Industrials (XLI), Utilities (XLU), and Financials (XLF) in the top tier makes for a constructive story overall.
We are seeing some weakness in the industrial sector and tariffs do not help, but the financial system is well positioned relative to past cyclical swoons with solid consumer credit quality. After the Regional Bank mini-crisis of March 2023, the market cannot be complacent on bank system risk, and the attacks and attempts to control the FOMC are high on the risk list also. How would top-down Fed control from the White House treat regional banks? (especially in California or New York?)
Sadly, the Fed attacks get back to questions of “intent” and whether the Fed attacks are part of the authoritarian story line. That is, control guns, money, and voting rules.
For “Guns,” that means military purges, dictating targets to the FBI and justice system, and taking equity stakes in defense. For “Money,” that means control the Fed and the power to regulate and target banks who don’t toe the line. For voting, that means stacking the deck on even who gets to vote. Maximizing legal voter turnout is not the priority. Maximizing legality is a priority as it should be but not while devising ways to undermine registration and turnout in congested areas or targeting demographics that are not supportive of those making the rules (college campuses, etc.).
The credit-intensive bond ETFs outperformed the other bond funds YTD as the UST curve story has moved around while generally favoring intermediate exposure YTD. We see EM Sovereign debt (EMB) well up in the second quartile with IG (LQD) and HY (HYG) next in line leading off the third quartile. Credit spreads have been friendly and are modestly tighter YTD in both IG and HY (see separate publications we publish each week on credit markets). The overall HY spread backdrop remains within the June 2007 credit bubble range but with at least a much lower risk credit profile in the HY index now than in the June 2007 and the late 1990s TMT excess.
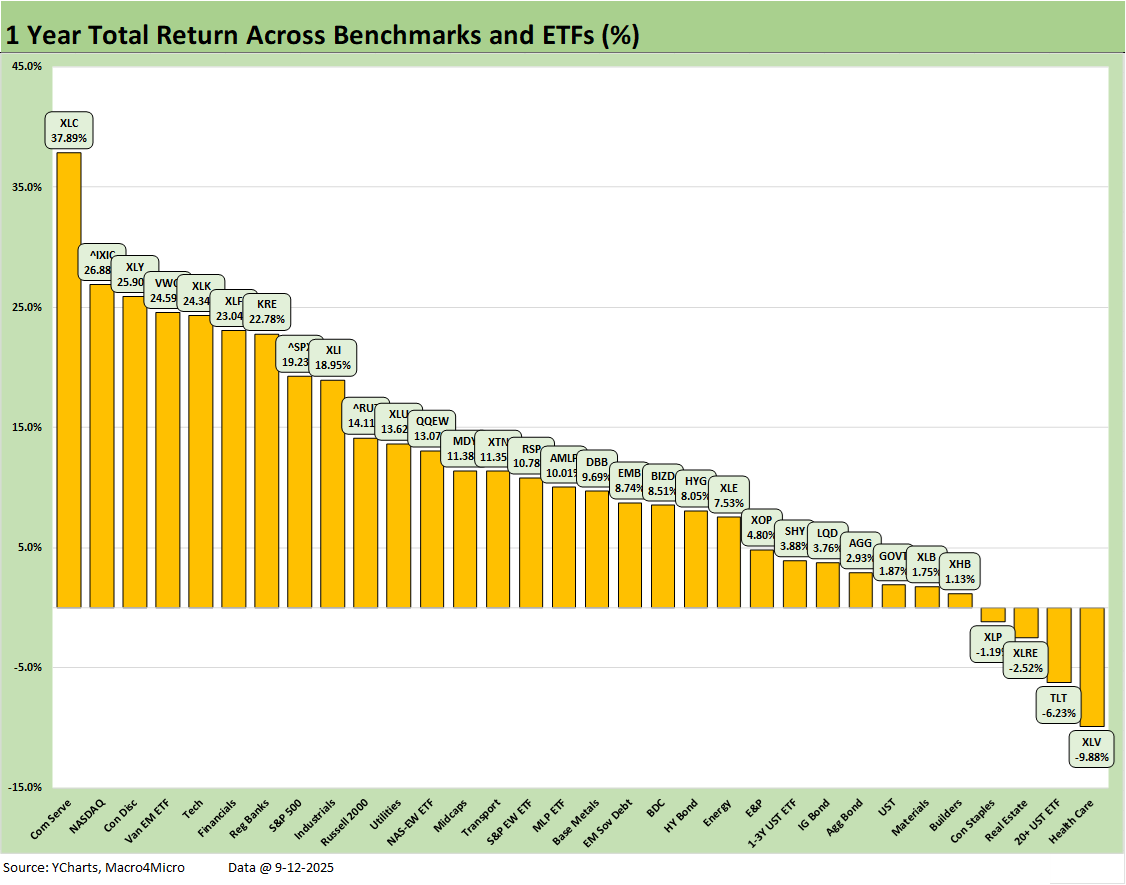
The 1-year returns stood at 28-4 again this week with the Health Care ETF (XLV) once again on the bottom at -9.9% and the long duration UST ETF (TLT) still in the red zone at -6.2%, which was a modest improvement from last week with the long bond rally. We see slight negative returns for Consumer Staples (XLP) and Real Estate (XLRE).
Communications Services (XLC) holds down #1 and keeps pulling away from the pack, with NASDAQ at #2, Consumer Discretionary (XLY) at #3, the Tech ETF (XLK) at #5 just behind EM Equities (VWO) at #4. VWO moved ahead of XLK this week for the LTM period. The top quartile is more tech heavy (including the S&P 500), but we see Regional Banks (KRE), and Financials (XLF) in the top quartile.
The S&P 500 at a run rate stands at 19.2% over 1-year (12.98% YTD 2025), so the S&P 500 will need to finish 2025 in impressive fashion to move from 13% to 25% for the year. It will take a near-doubling of the YTD S&P 500 returns (8 ½ months) to match the 2024 and 2023 S&P 500 returns. The year 2024 was Part Two of the best 2-year run in the S&P 500 since the late 1990s, so that sets a high bar (see Footnotes & Flashbacks: Asset Returns for 2024 1-2-25). The S&P 500 return of +25% for 2024 (26% 2023) will be very hard to match in 2025-2026.
That market reality – combined with the recent weak job performance – undermines Trump’s theme music of “the country was dead 8 months ago.” We would also highlight those S&P 500 numbers in 2023-2024 were generated at higher interest rates prevailing under Biden in 2023-2024.
Recession risk often overstated…
Recession debates continue to unfold in the markets, but we don’t see that happening this fall. The period since early 2020 COVID recession has not seen the US economy come close to a recession. That COVID recession in early 2020 came after the longest recovery in US history.
In looking back at past downturns, the trigger points for the recessions included the extreme (such as the late 1980s LBO leverage excess, much higher short-term rates in 1989, residual stress of oil price crash in energy regions, thrift crisis upheavals, etc.). The TMT bubble and credit crisis do not need much detail.
Among a range of factors heading into the fall of 2025, the current backdrop shows a weaker set of economic trends and damaging trade policies infecting consumer habits and hitting corporate expense lines. That is most definitely flowing into headcount planning and hiring/firing. We are still waiting for a GOP leader in any body (Cabinet, Senate, or House) to use the term “tariff cost mitigation strategies.” That would be an admission that the buyer pays customs, and that makes Trump cranky. Even with that, we don’t see a recession in the fall.
As we have covered in earlier commentaries, it takes a lot to drive a recession (see Macro Menu: There is More Than “Recession” to Consider 8-5-25). They always come though. Only two Presidents during the last 50 years have served out their terms without a recession period – Clinton and Biden. The wild economic, capital markets, and banking system issues that drove the recessions were stories unto themselves. So were the geopolitical and systemic events that contributed to those recessions. The triggers were extraordinary. Trump could get there with a return of IEEPA and more severe clashes with trade partners.
See also:
Mini Market Lookback: Ugly Week in America, Mild in Markets 9-13-25
CPI August 2025: Slow Burn or Fleeting Adjustment? 9-11-25
PPI Aug 2025: For my next trick… 9-10-25
Credit Markets: Spread Risk Lurks, but the World Waits 9-8-25
The Curve: The Road to Easing has been Long. 9-8-25
Footnotes and Flashbacks: Asset Returns 9-6-25
Mini Market Lookback: Job Trends Worst Since COVID 9-6-25
Payrolls Aug 2025: Into the Weeds 9-5-25
Employment August 2025: Payroll Flight 9-5-25
JOLTS July 2025: Job Market Softening, Not Retrenching 9-3-25
Hertz Update: Viable Balance Sheet a Long Way Off 9-3-25
The Curve: Risk Tradeoff - Tariffs vs. UST Supply 9-1-25
Mini Market Lookback: Tariffs Back on Front Burner 8-30-25
PCE July 2025: Prices, Income and Outlays 8-29-25
2Q25 GDP: Second Estimate, Updated Distortion Lines 8-28-25
Avis Update: Peak Travel Season is Here 8-27-25
Durable Goods July 2025: Signs of Underlying Stability 8-26-25
Toll Brothers Update: The Million Dollar Club Rolls On 8-26-25
New Home Sales July 2025: Next Leg of the Fed Relay? 8-25-25
The Curve: Powell’s Relief Pitch 8-24-25
Mini Market Lookback: The Popeye Powell Effect 8-23-25
Existing Home Sales July 2025: Rays of Hope Brighter on Rates? 8-21-25
Home Starts July 2025: Favorable Growth YoY Driven by South 8-19-25
Herc Holdings Update: Playing Catchup 8-17-25
Mini Market Lookback: Rising Inflation, Steady Low Growth? 8-16-25
Industrial Production July 2025: Capacity Utilization 8-15-25
Retail Sales Jul25: Cautious Optimism in the Aisles 8-15-25
PPI: A Snapshot of the Moving Parts 8-14-25
CPI July 2025: Slow Erosion of Purchasing Power 8-12-25
Iron Mountain Update: Records ‘R’ Us 8-11-25
Mini Market Lookback: Ghosts of Economics Past 8-9-25
Macro Menu: There is More Than “Recession” to Consider 8-5-25
Mini Market Lookback: Welcome To the New World of Data 8-2-25