
Mini Market Lookback: Job Trends Worst Since COVID
The week saw more confirmation of job weakness and fallout from tariffs while Team Trump points at the Fed.


About those “depression-type numbers” you cited just before the election…
The Fed dual mandate priorities just shifted again with the first negative payroll month since COVID. Weak employment trends will lead the macro theme for now even if the market awaits CPI and PPI numbers this coming week. The first negative month (post-revision June) combined with August at +22K for the worst rolling 4 months since 2020 (see Employment August 2025: Payroll Flight 9-5-25, Payrolls Aug 2025: Into the Weeds 9-5-25).
For those who look back to gut-check rhetorical nonsense, we remember the October 2024 nonfarm payroll report posting a level that Trump dubbed “depression-type numbers.” The job additions were initially 12K just ahead of the election (payroll release dated 11-1-25, 4 days before Election Day). Note that Harris did not accuse the BLS of rigging those numbers. (As a reminder, the Oct 2024 numbers were massively distorted by the Boeing strike.) When Trump or his sycophants cites BLS bias, they cannot explain that one!
The 12K back in Oct 2024 was revised the next month to 36K. Later it was even further revised to 44K (see Payroll Oct 2024: Noise vs. Notes 11-2-24, Payroll Nov 2024: So Much for the Depression 12-6-24).
The negative numbers for June 2025 (-13K) and the August 2025 run rate of +22K are not even a clear recession yet (let alone a depression), but they offer food for thought in what is real and what is not in the rhetoric deluge. We suspect no one will fact check Trump on the Oct 2024 vs. August 2025 rhetorical consistency, but the payroll release showed weakness in numerous priority sectors.
If SCOTUS affirms the Appeals Court on the illegality of Trump’s IEEPA tariffs, the jobs weakness could give the FOMC more room to be more aggressive in the fall on stimulus. The market will also have to handicap the risk of trade partners finding their courage if Trump loses his ability to react with extreme tariffs at his whim waving the IEEPA emergency flag. Weakness in the economy combined with materially lower tariffs could partly (not wholly) ease the stagflation fears.
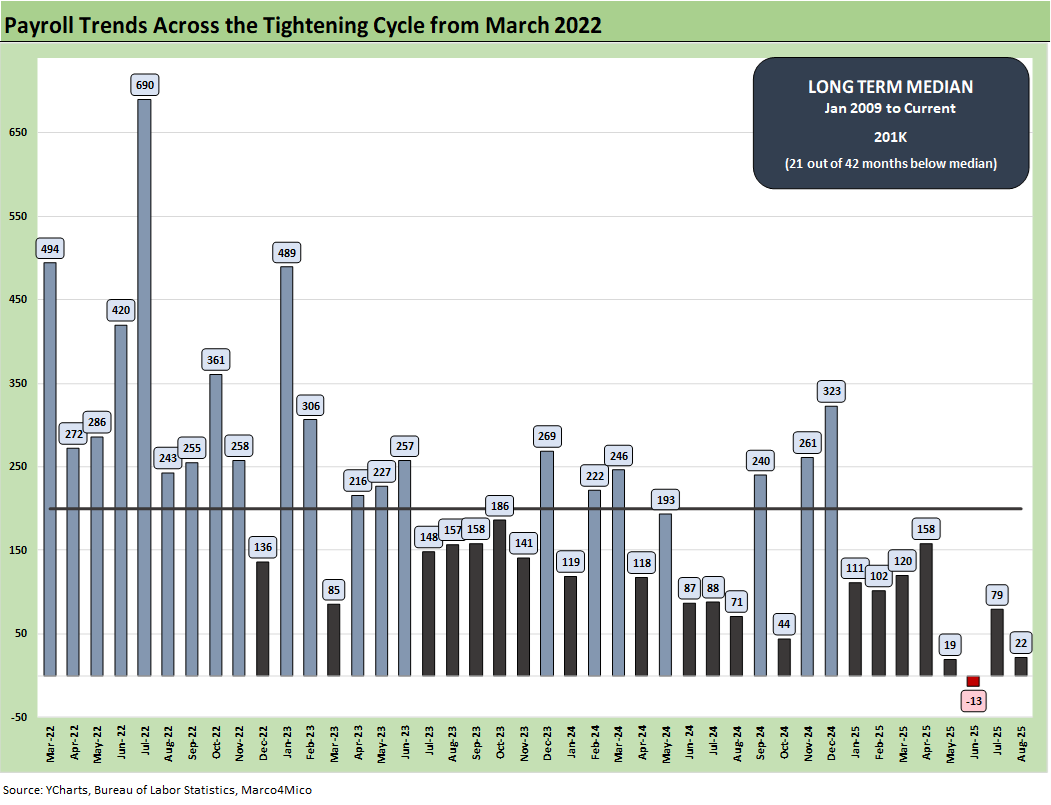
In the interest of adding some balance to the often-proclaimed “greatest 8 months in Presidential history” we would highlight that Trump now has the 3 worst payroll months since the tightening cycle began. In other words, the peak inflation month in June 2022 added many more jobs than the last 4 months. We look at various time horizons in Employment August 2025: Payroll Flight (9-5-25).
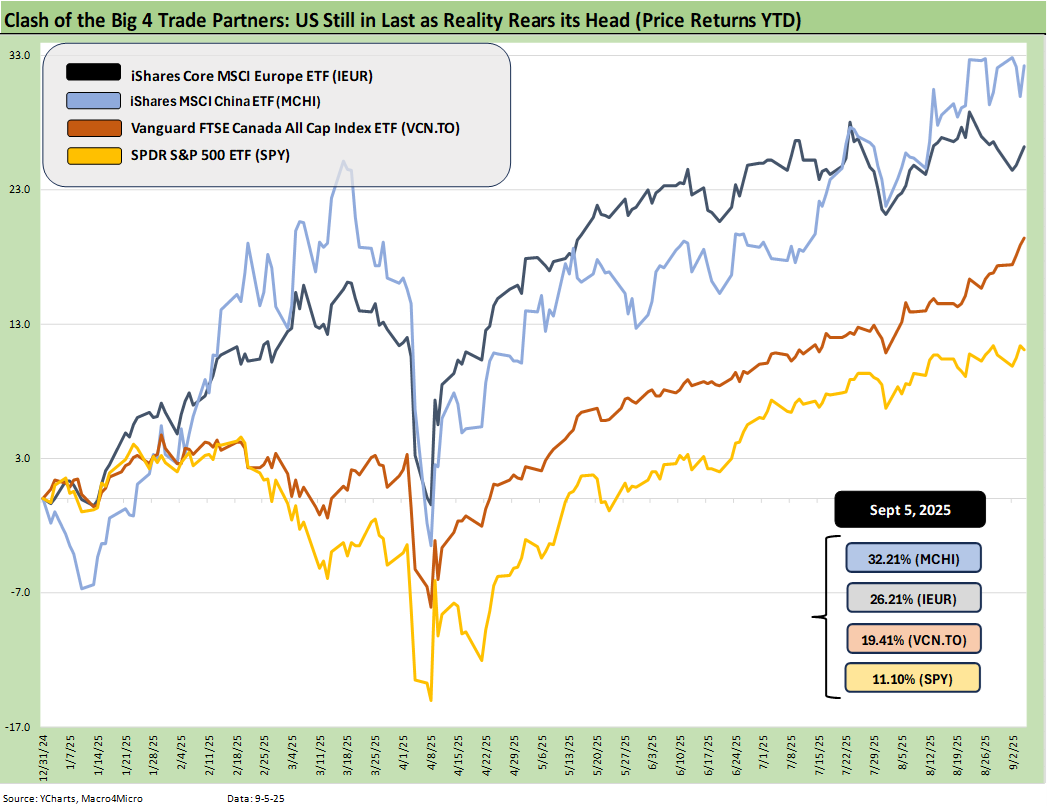
The above updates the YTD returns for some bellwether index ETFs of the Big 4 developed market trading partners – the US, Europe, China, and Canada. The goal is to plot some ETFs that tell a story for US investors thinking about global diversification. The ETFs are just a useful sample that uses relevant broad market indexes for each region as snapshots.
We’re looking to capture the balance of risks across the broad mix of macro trends (economy, currency) and the sea level industry and company fundamentals rolled up into a US traded ETF. For the US, we use the S&P 500 ETF (SPY). In other words, we went easy on the US given the mixed performance of small caps and midcaps across 2025.
The result is clear enough in this diversified mix of assets. The US remains in last place.
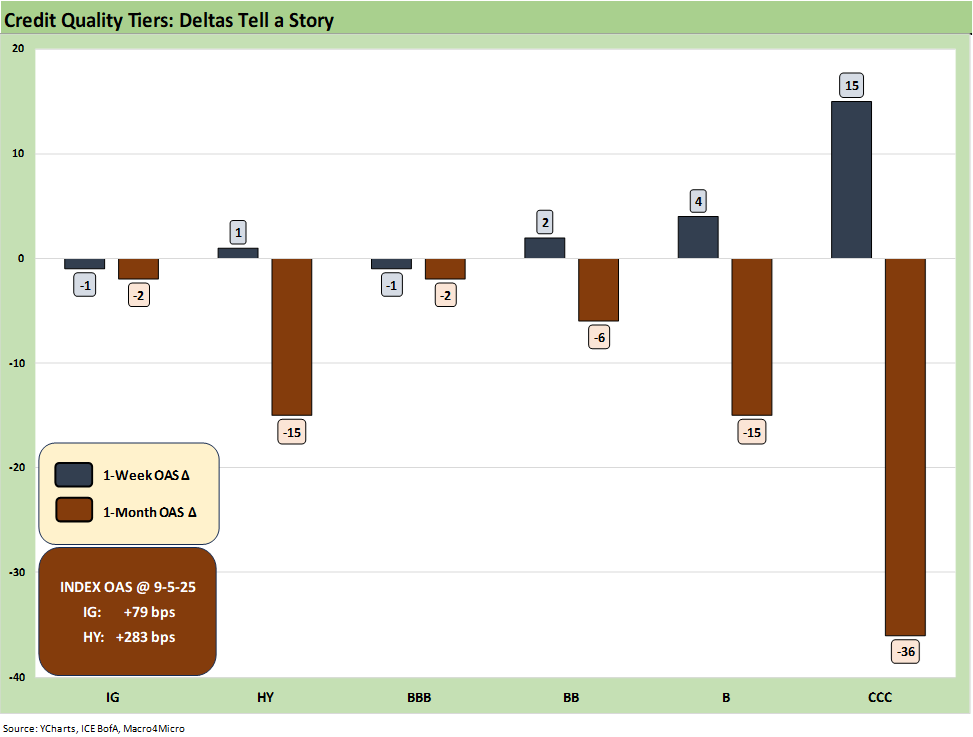
The above chart updates the credit spread deltas for 1-week and 1-month. We have rolled through a favorable month with the latest week overall seeing very little action in aggregate for the HY index.
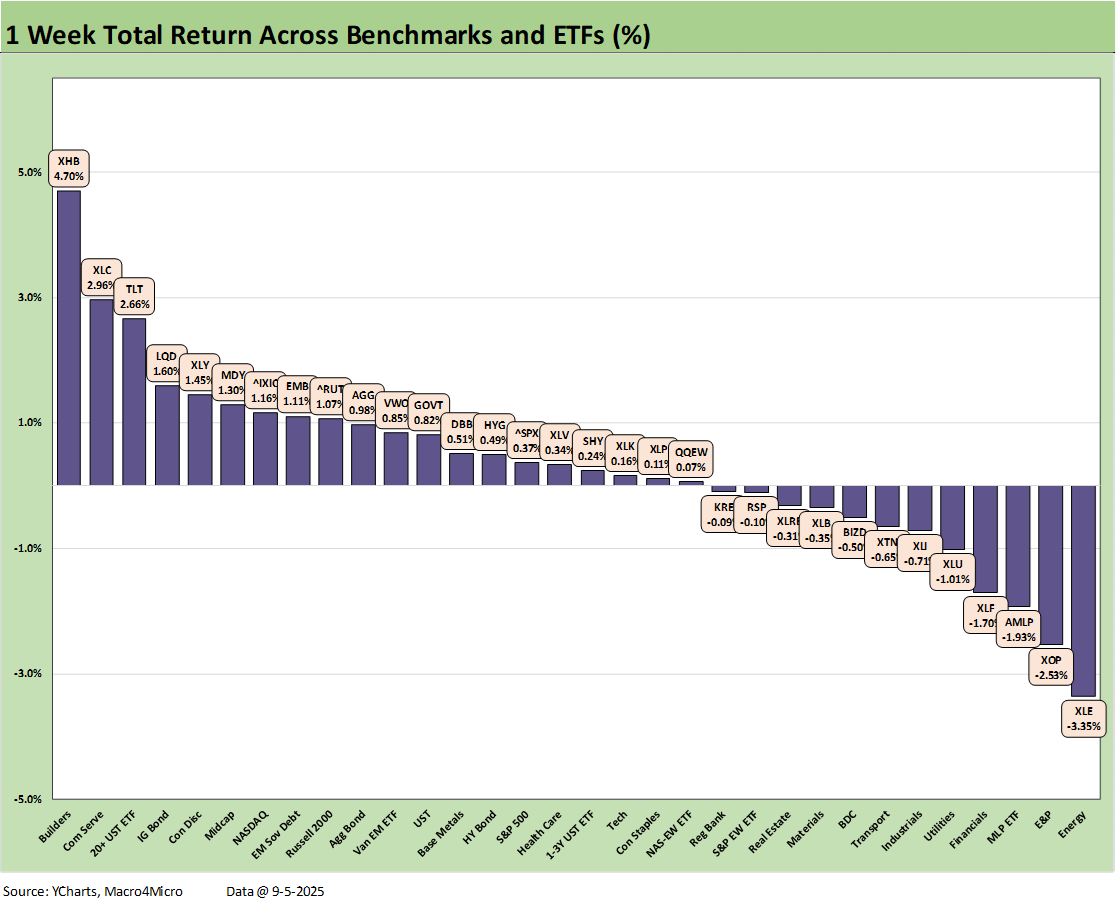
The above chart shows the 1-week return for the 32 benchmarks and ETFs that we track as the week posted a score of 20-12 in the positive vs. negative tally. We see a very good week for a diverse range of asset lines. Bonds were all positive on the curve rally with the top quartile including the long duration UST ETF (TLT) along with IG Corporates (LQD), and EM Sovereign bonds (EMB). Some key interest rate sensitive lines did quite well with the Homebuilder ETF (XHB) well out in front at #1 as mortgage rates rallied hard to end the week.
NASDAQ and Midcaps (MDY) both made the top quartile with the small cap Russell 2000 (RUT) just across the line at the top of the second quartile and the S&P 500 near the lower end of the third quartile. The S&P 500 was more mixed by sector with 6 of the 11 sectors negative and 5 in positive range.
We see energy-related names taking a beating the past week with the broad Energy ETF (XLE), E&P (XOP) and Midstream (AMLP) bringing up the rear in the bottom 3 slots. It was notable that Financials (XLF) and Regional Banks (KRE) were in the red with weaker cyclical trends potentially posing threats to asset quality and provisioning needs. The week saw some troubling color from ISM and the Beige Book that could dampen spirits.
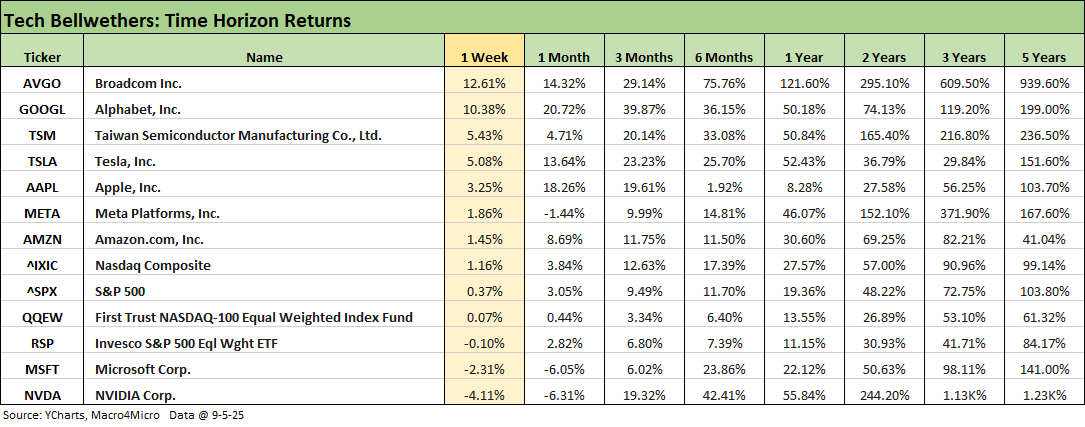
The above chart details the tech bellwether performances with Broadcom (earnings) and Alphabet (favorable antitrust legal decision on chrome divestiture). We see 5 of the Mag 7 (6 of 8 if we go with a “Mag 8” including Broadcom) ahead of the S&P 500. NVDA and MSFT were in the red and brought up the rear.
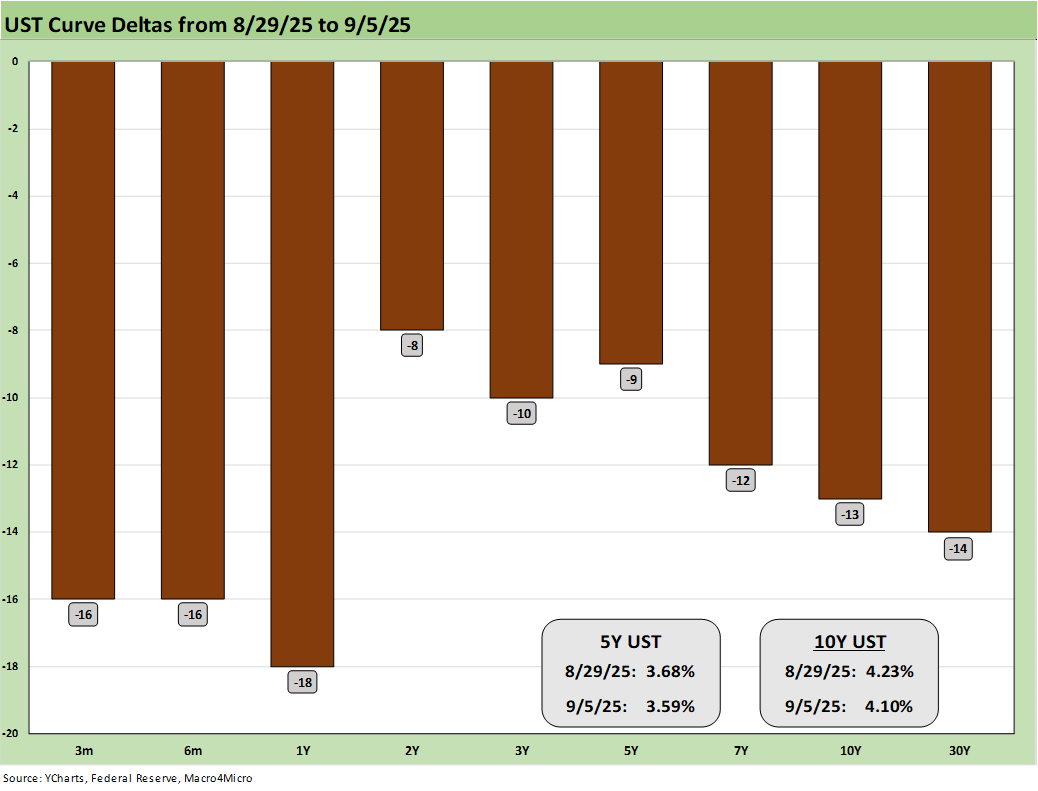
The above chart details a bullish week for bonds from short to long with Friday dominating the action on a lousy jobs report. Jobs were arguably worse than Fed and market expectations, and the setbacks could get more debates going around the FOMC delivering more than two cuts in the home stretch and especially if SCOTUS holds up the IEEPA ruling and some of the concerns around tariff-related price pressures could be mitigated.
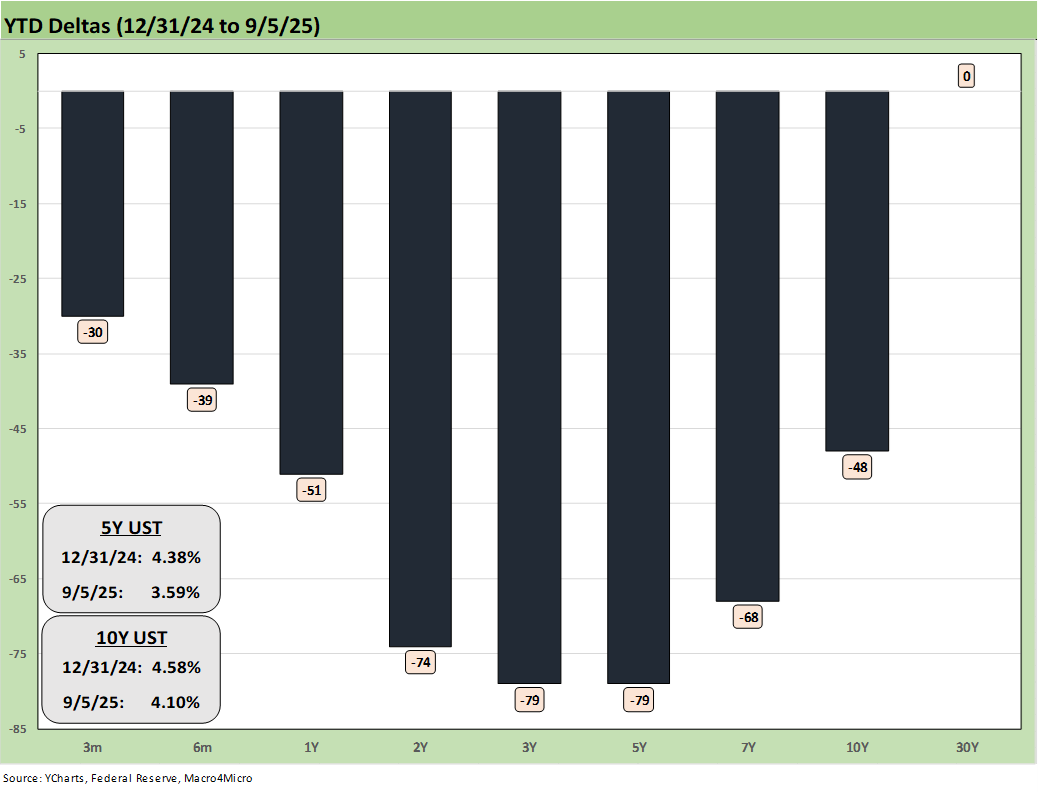
The above chart updates the running YTD variation of a bull steepener that has supported bond fund returns. Intermediate exposure with mid-range credit risk have delivered the best risk-adjusted returns and balance of income (coupon) and price performance.
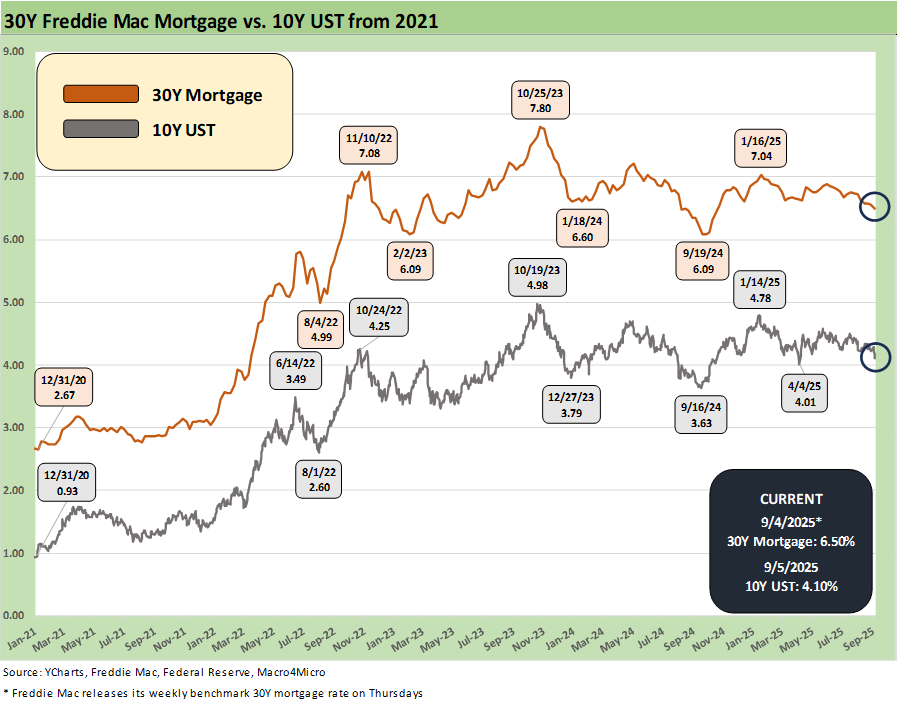
The above chart comes with a big asterisk of the Freddie Mac 30Y benchmark getting posted each Thursday around noon, but the big action in mortgages was Friday after the jobs number. Friday saw the Mortgage News Daily survey rate weighing in at 6.29% vs. the Thursday reset of Freddie at 6.5%. That Friday move was a big-time rally with this coming week bringing CPI and PPI before the FOMC meeting the following week.
As we look at the chart above to the Sept 2024 easing timeline, we see that mortgages moved into the 6.0% handle range with the 10Y UST at a 3.6% handle. That soon gave way to a bear steepening that carried across 2024 and intermittent bouts of the same into 2025. The trade-off of tariff costs and pricing effects and how the Fed responds will be a major debate from now until Trump takes over the Fed. Yes, that is what is happening.
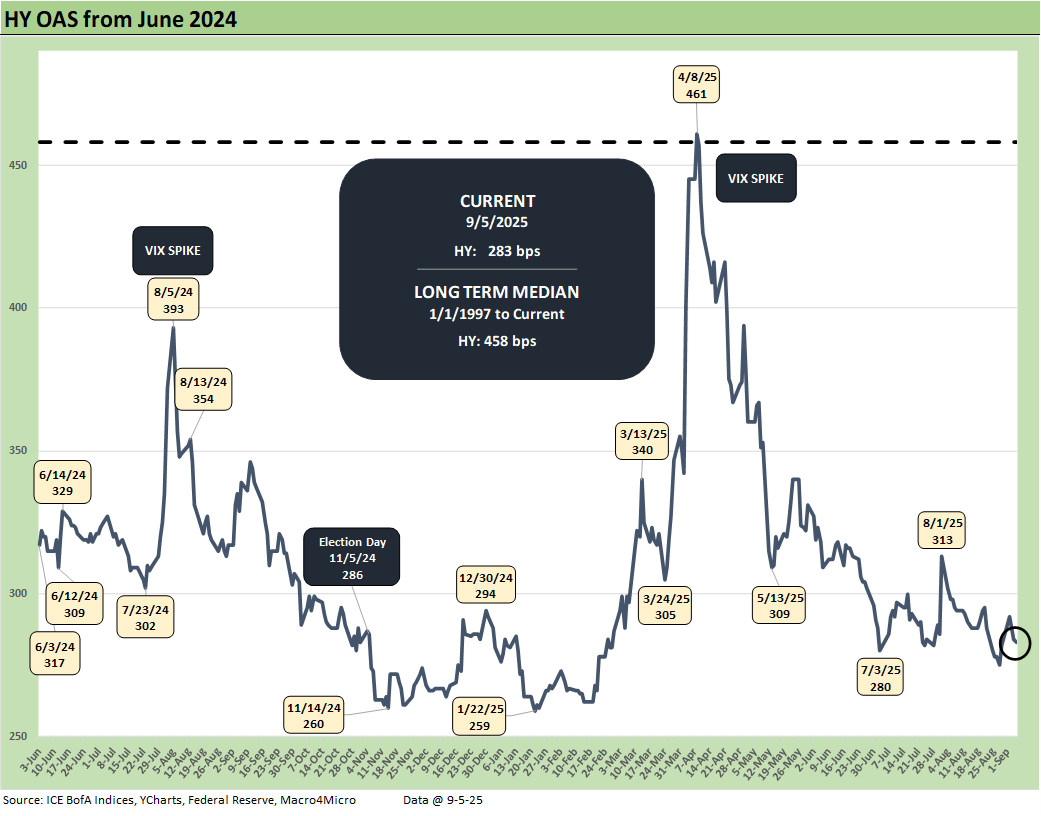
The above chart plots the HY OAS from June 2024, and we see a minimal +1 bps move wider on the week to +283 bps. That HY index OAS is still in the bubble zone of June 2007.
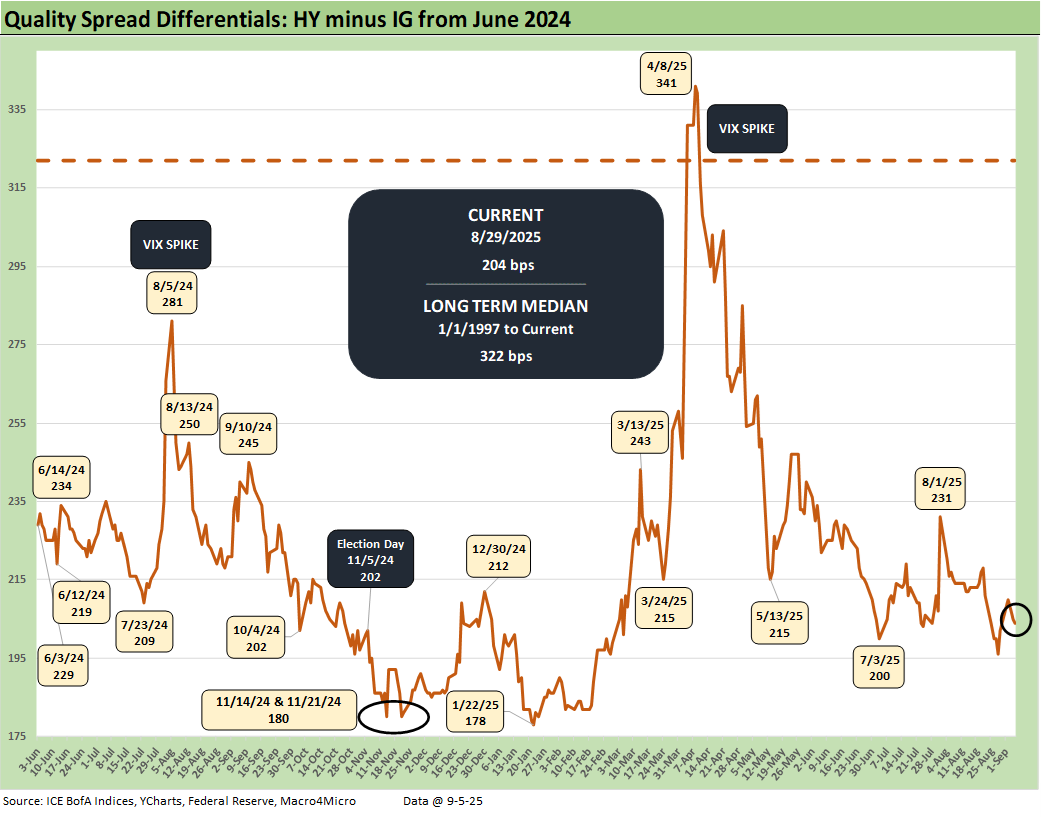
The above chart updates the quality spread differentials for HY vs. IG with “HY OAS minus IG OAS” +2 bps wider on the week to +204 bps with HY +1 bps wider and IG -1 bps tighter.
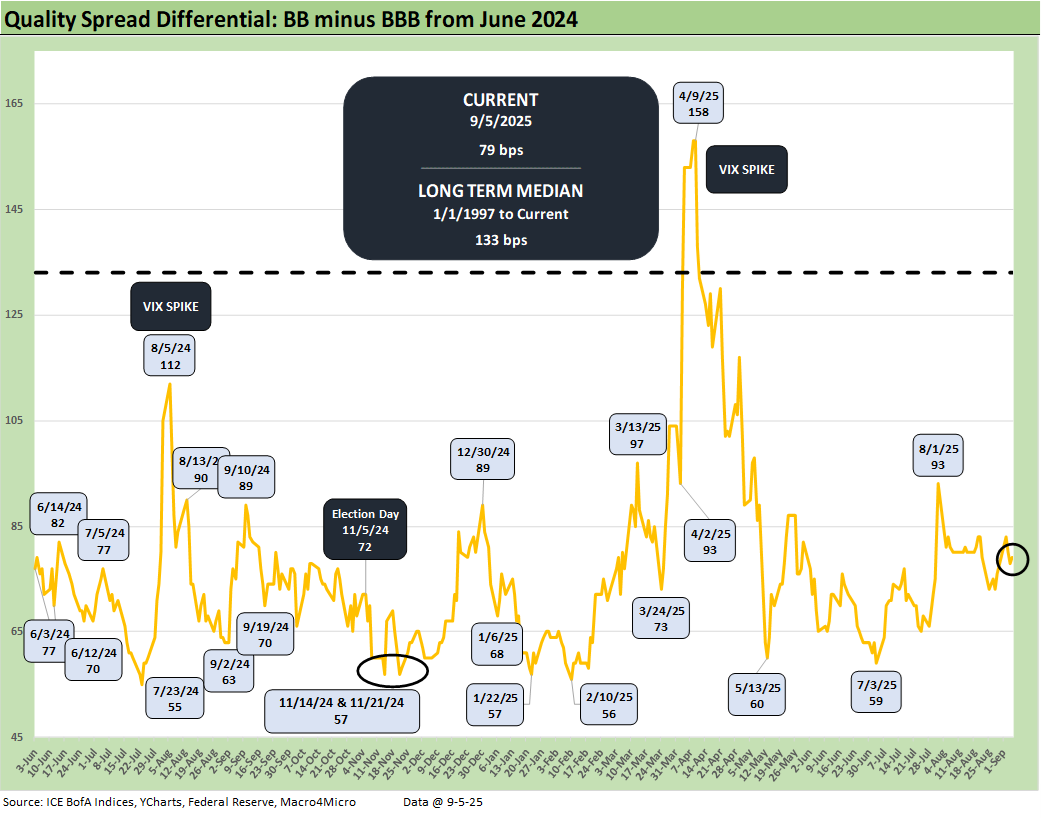
The above chart shows the “BB OAS minus BBB OAS” quality spread differential widen by 3 bps to +79 bps over the week with the BB tier +2 bps wider and the BBB tier -1 tighter. That is wide to the early July level around +59 bps.
See also:
Payrolls Aug 2025: Into the Weeds 9-5-25
Employment August 2025: Payroll Flight 9-5-25
JOLTS July 2025: Job Market Softening, Not Retrenching 9-3-25
Hertz Update: Viable Balance Sheet a Long Way Off 9-3-25
Credit Markets: Will the Heat Matter? 9-1-25
The Curve: Risk Tradeoff - Tariffs vs. UST Supply 9-1-25
Footnotes & Flashbacks: Asset Returns 8-31-25
Mini Market Lookback: Tariffs Back on Front Burner 8-30-25
PCE July 2025: Prices, Income and Outlays 8-29-25
2Q25 GDP: Second Estimate, Updated Distortion Lines 8-28-25
Avis Update: Peak Travel Season is Here 8-27-25
Durable Goods July 2025: Signs of Underlying Stability 8-26-25
Toll Brothers Update: The Million Dollar Club Rolls On 8-26-25
New Home Sales July 2025: Next Leg of the Fed Relay? 8-25-25
The Curve: Powell’s Relief Pitch 8-24-25
Mini Market Lookback: The Popeye Powell Effect 8-23-25
Existing Home Sales July 2025: Rays of Hope Brighter on Rates? 8-21-25
Home Starts July 2025: Favorable Growth YoY Driven by South 8-19-25
Herc Holdings Update: Playing Catchup 8-17-25
Mini Market Lookback: Rising Inflation, Steady Low Growth? 8-16-25
Industrial Production July 2025: Capacity Utilization 8-15-25
Retail Sales Jul25: Cautious Optimism in the Aisles 8-15-25
PPI: A Snapshot of the Moving Parts 8-14-25
CPI July 2025: Slow Erosion of Purchasing Power 8-12-25
Iron Mountain Update: Records ‘R’ Us 8-11-25
Mini Market Lookback: Ghosts of Economics Past 8-9-25
Macro Menu: There is More Than “Recession” to Consider 8-5-25
Mini Market Lookback: Welcome To the New World of Data 8-2-25
Happiness is Doing Your Own Report Card 8-1-25