
Footnotes & Flashbacks: Asset Returns 3-2-25
We get a week of superior returns from bonds for too many bad reasons as the UST inverts again from the short end.


Peas and carrots and flowers…you and me against the world buddy.
Asset returns for the week were mixed across our group of 32 benchmarks and ETFs, but the broad market indexes were mostly in the red with tech ETFs and benchmarks under pressure on the week with midcaps and small caps also in fade mode.
Bond ETFs turned in good numbers on duration with the long duration UST 20+Y ETF (TLT) turning up at #1 for the week and #2 for the 1-month period and still in the top quartile YTD.
The Tech bellwethers are feeling some performance pressure with the MAG 7 diverging, but 1-week and 1-month were ugly and 3-months returns showing very little.
Tesla was in last place in that group for 1-week, 1-month and 3-months while also underperforming the S&P 500 and NASDAQ. Tesla is still head of the class for 6 months on the post-election power play but underperforming the S&P 500 over 2 years and 3 years.

The rolling 1-month returns for the high-level debt and equity benchmarks we watch show debt all ringing up positive for the month but equities struggling with all but one (Russell 3000 Value) negative for the 1-month and all negative for 3-months. It as been hard to find good news in 1-month and 3-months in equity benchmarks.
The rolling return visual
In the next section, we get into the details of the 32 ETFs and benchmarks for a mix of the trailing periods. Below we offer a condensed 4-chart view for an easy visual on how the mix of positive vs. negative returns shape up. This is a useful exercise we do each week looking for signals across industry groups and asset classes.

The mix of positive vs. negative above is favorable for the 1-week and 1-month mix and modestly negative over 3-months. The broad benchmarks have struggled in the mix. We include a YTD mix further below (not shown above) that has the most favorable positive-negative mix of the shorter time horizon. The strong 1-year numbers at 30-2 are still riding the wave of back-to-back great years in 2023-2024 for broad market benchmarks and in tech.
The Magnificent 7 heavy ETFs…
Some of the benchmarks and industry ETFs we include have issuer concentration elements that leave them wagged by a few names. When looking across some of the bellwether industry and subsector ETFs in the rankings, it is good to keep in mind which narrow ETFs (vs. broad market benchmarks) get wagged more by the “Magnificent 7” including Consumer Discretionary (XLY) with Amazon and Tesla, Tech (XLK) with Microsoft, Apple, and NVIDIA, and Communications Services (XLC) with Alphabet and Meta.
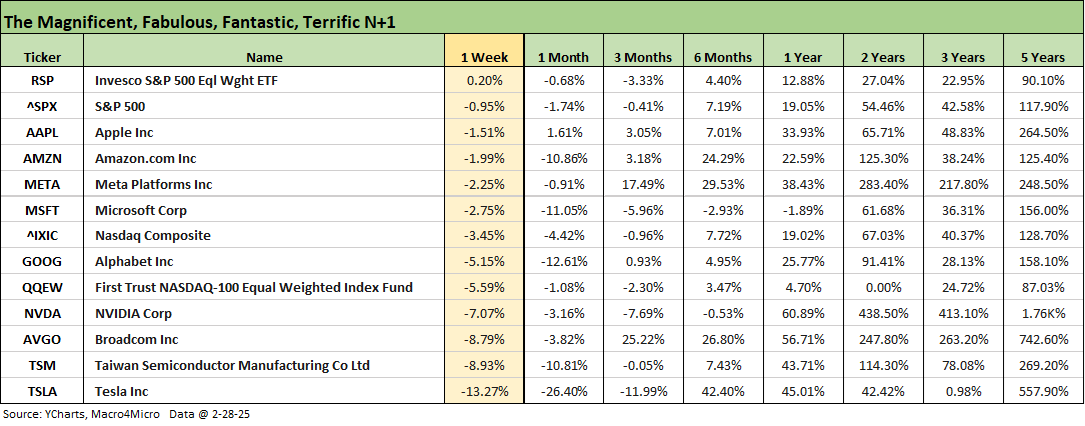
We already drilled into the tech bellwether checklist in the Mini Market Lookback: Collision Courses ‘R’ Us (3-2-25), and the simple reality is that it was a bad week for tech bellwethers and the same for the rolling month. The table is arranged in descending order of 1-week returns with Tesla on the bottom at -13.3% with 3 of the Mag 7 worse than -5.0% for the week. We see 4 of the Mag 7 in double-digit negative range for 1-month (TSLA, GOOG, MSFT, AMZN). That is not saying much with no Mag 7 bellwether positive for the week and only Apple positive for 1-month at a lowly +1.6%. TSLA has been pounded for 1-week, 1-month, and 3-months but is still holding the post-election lead.
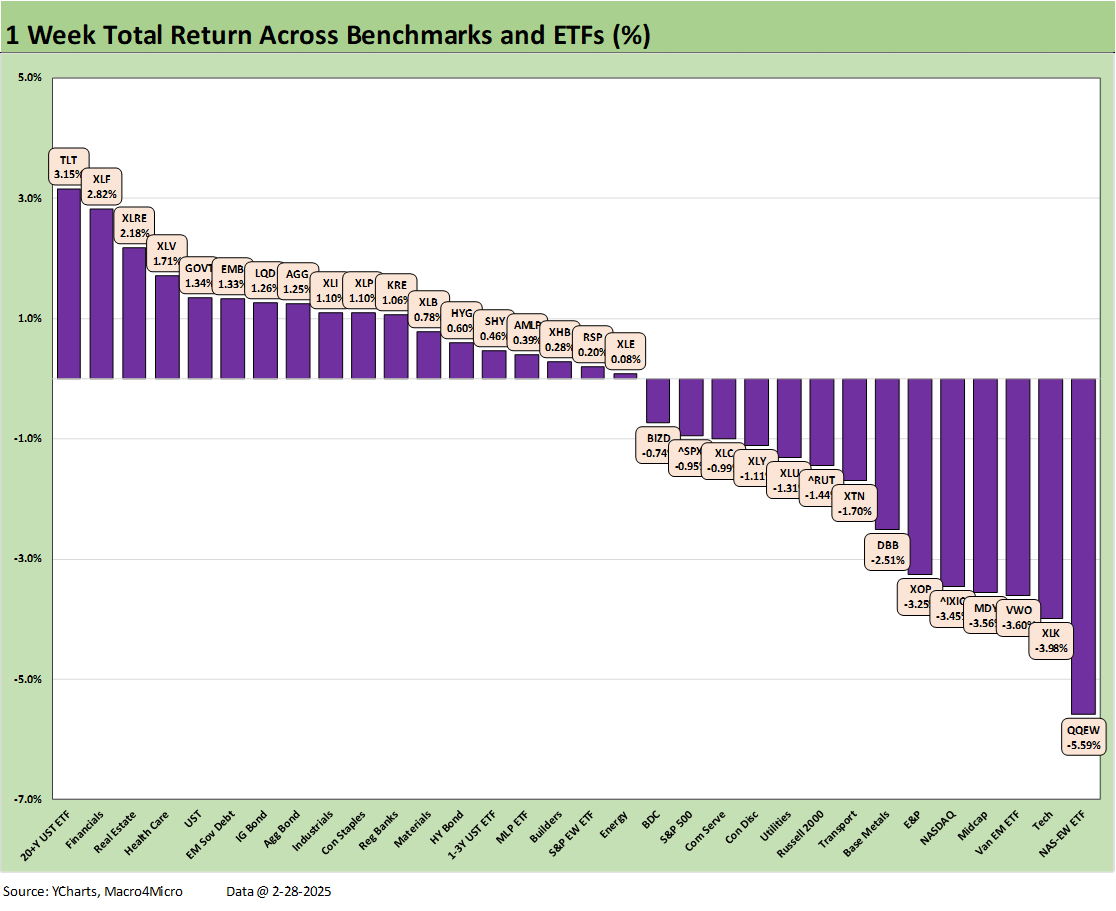
The 1-week shows the long duration UST 20+Y ETF (TLT) at #1, and that makes a statement on the worries in the market (see Mini Market Lookback: Collision Courses ‘R’ Us 3-2-25, Footnotes & Flashbacks: State of Yields 3-2-25). Financials (XLF), Real Estate (XLRE), and Health Care (XLV) round out the upper half of the top quartile with the bottom half of the top quartile all bond ETFs in a sign of soft equity numbers. The bottom performers were tech-centric with the Equal Weight NASDAQ 100 ETF (QQEW) in last place with the Tech ETF (XLK) in second to last and the NASDAQ only a few notches higher.

The 1-month period delivered a 19-13 score for the month with the winners showing no tech plays with defensive Consumer Staples (XLP) at #1 and the long duration UST ETF (TLT) in at #2 with Real Estate at #3 riding the UST rally just ahead of the Utility ETF (XLU). That was followed by the income-heavy Midstream Energy ETF (AMLP). Overall, that mix does not reflect a bullish growth or cyclical risk stance. The top tier is rounded out by GOVT and LQD.
The bottom quartile includes Homebuilders (XHB) on the bottom at -8.3% with Transports (XTN) just ahead of them at -8.2%. It is hard to see how tariffs will help either the Homebuilding chain or Transports. From a broader range context, Small Caps (RUT) and Midcaps (MDY) are both in the bottom tier. Techs had a bad month with the Tech ETF (XLK) and NASDAQ in the bottom quartile while the Mag 7 heavy Consumer Discretionary ETF (XLY) with heavy TSLA and AMZN exposure also struggled mightily.
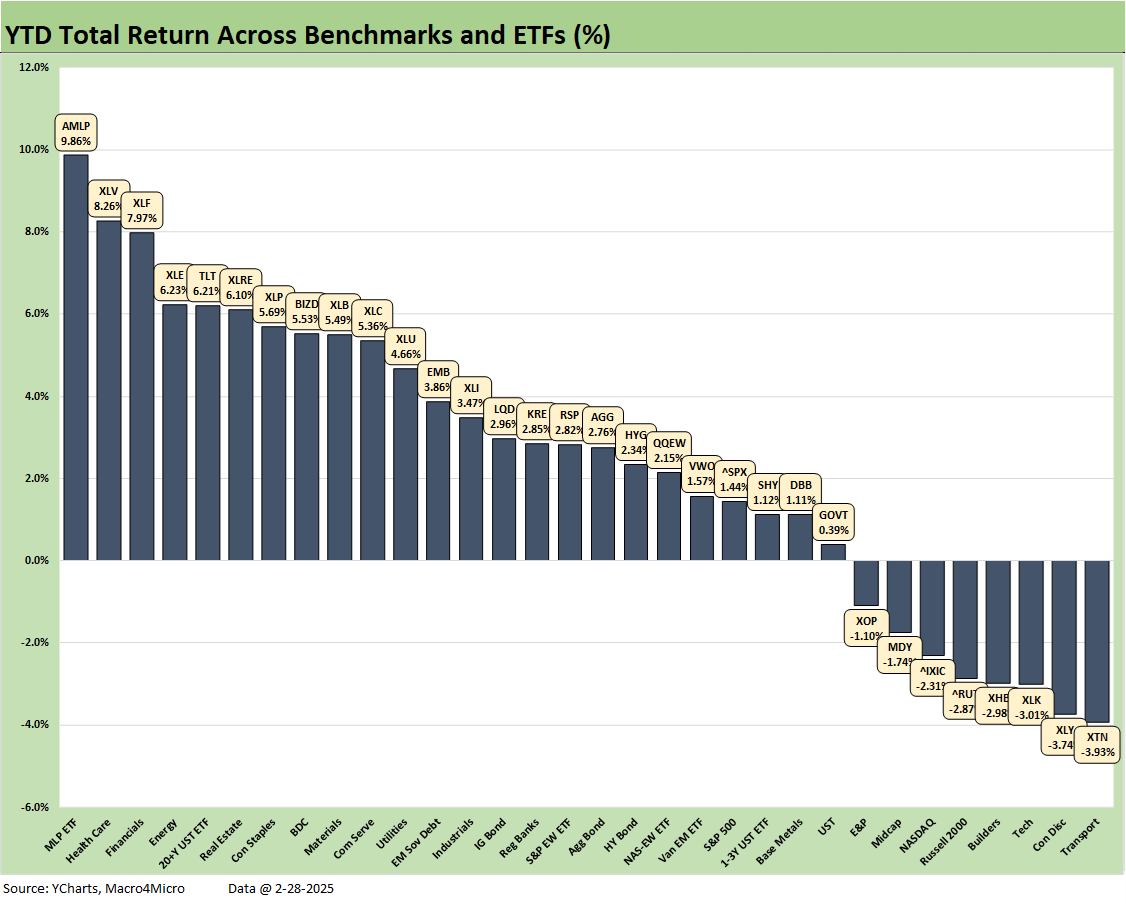
YTD weighs in with a score of 24-8 with high yielding Midstream Energy (AMLP) at #1 and the other end of the top quartile showing the highest dividend payout ETF with the BDC ETF (BIZD). Duration was a winner with the long duration UST ETF (TLT) in the top 5 joined by Financials (XLF), Healthcare (XLV), and the broad Energy ETF (XLE) as that diverged from E&P (XOP), which was stuck in the bottom quartile.
The healthier balance by line item count is undermined by 3 of the 4 major benchmarks in the mix – the NASDAQ, Small Caps (RUT), and Midcaps (MDY) – sitting in negative range in the bottom quartile. Only the S&P 500 was slightly positive at +1.4% in the third quartile.
For bonds, we see all 7 bond ETFs in positive range with TLT in the top quartile, EMB and LQD in the second quartile, and the third quartile with AGG, HYG, and SHY.

The 14-18 score for the 3-months returns shows the homebuilder ETF in last place at -17.1% with Transports at -11.3% and the US-centric small caps (RUT) at -10.5%. That mix of underperformers is not sending many bullish cyclical signals at all as we roll into the last month of 1Q25.
We also see E&P (XOP), Midcaps, Regional Banks (KRE), Materials (XLB), and Industrials (XLI) sending low votes of confidence on the cycle. The overhang of the tariff threats and softening consumer sentiment signals cannot be helping that mix.
The income-heavy BDC ETF (BIZD) and Midstream Energy (AMLP) hold down the #1 and #2 slots with 3 bond ETFs also in the top quartile with EM Sovereign (EMB), HY ETF (HYG) and the short duration UST 1Y-3Y ETF (SHY). Rounding out the top quartile is Communications Services (XLC) as the one tech-heavy name in the top tier. We also see Financials (XLF) posting upper tier rankings again.
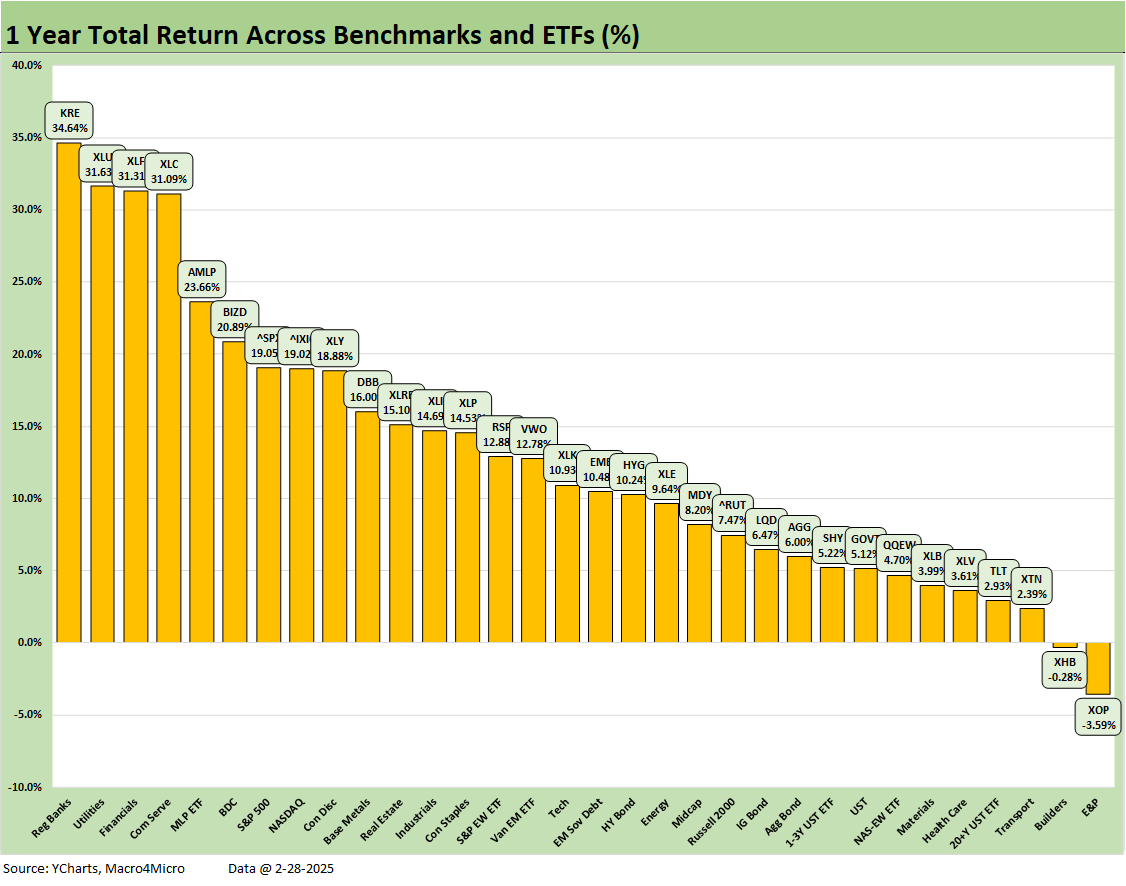
The 1-year asset return lineup is still overwhelmingly positive at 30-2 with Homebuilders (XHB) falling into the red zone after an amazing run through Sept 2024 where it led the pack at various points in the fall at +60% and even low 70% handles until high valuations, a material rise in mortgage rates and more guarded guidance weighed in. The materials tariffs will also weigh on supplier chains while the new attacks on lumber and heavy demands on rebuilding will further fuel supply-demand imbalance for materials while deportation will hurt subcontractor labor pools.
See also:
Footnotes & Flashbacks: State of Yields 3-2-25
Mini Market Lookback: Collision Courses ‘R’ Us 3-2-25
PCE Jan 2025: Prices in Check, Income and Outlays Diverge 2-28-25
Durable Goods Jan25: Waiting Game 2-27-25
GDP 4Q24 Second Estimate: PCE Inflation the Main Event 2-27-25
New Homes Sales Jan 2024: Homebuilders Feeling Cyclical Signals? 2-26-25
Auto Tariffs: Japan, South Korea, and Germany Exposure 2-25-25
Footnotes & Flashbacks: Credit Markets 2-24-25
Footnotes & Flashbacks: State of Yields 2-23-25
Footnotes & Flashbacks: Asset Returns 2-23-25
Mini Market Lookback: Tariffs + Geopolitics + Human Nature = Risk 2-22-25
Existing Home Sales Jan 2025: Prices High, Volumes Soft, Inventory Up 2-21-25
AutoNation: Retail Resilient, Captive Finance Growth 2-21-25
Toll Brothers 1Q25: Performing with a Net 2-20-25
Housing Starts Jan 2025: Getting Eerie Out There 2-19-25
Herc Rentals: Swinging a Big Bat 2-18-25
UST Yields: Sept 2024 UST in Historical Context 2-17-25
Tariff links:
Auto Tariffs: Japan, South Korea, and Germany Exposure 2-25-25
Mini Market Lookback: Tariffs + Geopolitics + Human Nature = Risk 2-22-25
Reciprocal Tariffs: Weird Science 2-14-25
US-EU Trade: The Final Import/Export Mix 2024 2-11-25
Aluminum and Steel Tariffs: The Target is Canada 2-10-25
US-Mexico Trade: Import/Export Mix for 2024 2-10-25
Trade Exposure: US-Canada Import/Export Mix 2024 2-7-25
US Trade with the World: Import and Export Mix 2-6-25
The Trade Picture: Facts to Respect, Topics to Ponder 2-6-25
Tariffs: Questions to Ponder, Part 1 2-2-25
US-Canada: Tariffs Now More than a Negotiating Tactic 1-9-25
Trade: Oct 2024 Flows, Tariff Countdown 12-5-24
Mexico: Tariffs as the Economic Alamo 11-26-24
Tariff: Target Updates – Canada 11-26-24
Tariffs: The EU Meets the New World…Again…Maybe 10-29-24
Trump, Trade, and Tariffs: Northern Exposure, Canada Risk 10-25-24
Trump at Economic Club of Chicago: Thoughts on Autos 10-17-24
Facts Matter: China Syndrome on Trade 9-10-24