
Footnotes & Flashbacks: State of Yields 3-2-25
The UST rally gave a boost to duration but also raised cyclical alarms despite constructive macro/micro metrics and revenue guidance.

The market has seen a sharp flattening and now a return to a 3M to 5Y inversion to -29 bps vs. +24 bps in mid-Jan. Consumer anxiety, flight to quality, and tariff worries are the main factors.
The mid-Sept lows give hope to both the UST bulls and bears given the volatility shown. The UST inversion faces the reality of constructive running fundamentals at the same time massive tariffs on a scale and range that dwarfs 2018-2019 are staring the market in the face with a very unpredictable finger on the trigger (see Mini Market Lookback: Tariffs + Geopolitics + Human Nature = Risk 2-22-25, Auto Tariffs: Japan, South Korea, and Germany Exposure 2-25-25).
The recent geopolitical drama is somewhat of the usual fare but is set against the largest land war in Europe since WWII and could have a material impact on tariff retaliation and could set in motion some dramatic changes for Energy, Defense and Aerospace (see Mini Market Lookback: Collision Courses ‘R’ Us 3-2-25).
We have always been an H.L. Mencken fan as a colorful historical figure at a volatile time in American history and hailed from the great city of Baltimore. Another of his great quotes was, “A cynic is a man who, when he smells flowers, looks around for a coffin.” The second quote can be applied to markets and cycles. The first quote could be about trade and tariffs, mass deportation, and a full-on embrace of Russia with its clear rejection of what 20th century America stood for in the world.
H.L. Mencken was at his peak in the roaring 1920s during a period of market excess. He loved cracking on religious extremists (he was at the Scopes Monkey Trial in 1925) and was writing up a storm at a time of Christian fundamentalist extremism, Prohibition, and when xenophobia was peaking (1924 Immigration Act). The Ku Klux Klan was at its peak. In other words, his time was not without its similarities to today in the division and spirit of the times.
H.L. Mencken was a fan of Al Smith (Trump took great pleasure in attending the Al Smith Dinner in NYC ahead of the election while Kamala dropped the ball on that one. Too bad…it was a layup opportunity). Al Smith was a huge supporter of immigrants and was abused and hated by Christian fundamentalists and Catholic-haters generally (recommended book: Empire Statesman).
H. L. Mencken wrote of Al Smith:
"Somewhere on the sidewalks of New York ... he picked up the doctrine that it is better to be honest than to lie. It is not a popular doctrine in America. It is dangerous baggage to politics ... but it has merit nevertheless: It makes a man comfortable inside."
Extremism and lies are back in vogue…
We are rolling into a period of extremes right now in economic policy and politics. With massive tariffs on essentially all major import products and against nations that include all our largest trade partners, the idea is that this is the cornerstone of America First economic thinking and the passport to prosperity. Those who believe that are in for a rude awakening. Denial of reality and “fact rejection by repetition” and crowd pressure is not new. We saw that with the 2020 election denial.
Buying and selling goods is different than political peer pressure and the occasional violent threats. We saw that from Jim Crow to Jan 6 and pardons. What you can’t hide from is double-entry accounting (without fraud anyway) and that is where tariffs will be hitting the fan – and the expense and price line – as soon as this coming week.
Once these tariffs kick in, we are hoping that this time Trump saves some of the receipts to support his view that the “seller pays” and that he will again collect “billions and billions” from the selling nations. Maybe Navarro can handle that for him (see Trump at Economic Club of Chicago: Thoughts on Autos 10-17-24).
UST action: bullish for duration but raising flags on inversion and downshift…
Below we run through the UST action and where we stand now with a return to inversion from 3M to 5Y and 3M to 10Y.

The above chart revisits our weekly recap of UST migration from the Carter Inversion of 1978 across the Volcker inflation years and then on to the oil patch crisis after 1986 as the corporate credit cycle peak of early 1989 was cresting.
That early 1989 UST curve posted above came just ahead of the bridge loan meltdowns and commercial real estate crisis just ahead of the first of two major Greenspan mega-easings (see UST Moves: 1988-1989 Credit Cycle Swoon 10-20-23, UST Moves: The 1990-1991 Risk Factor Pig Pile 10-24-23). The second time came in 2001 after the TMT crisis (see Greenspan’s Last Hurrah: His Wild Finish Before the Crisis 10-30-22).
We look at the UST curve today, and the main takeaway is that the current UST curve is extremely low by pre-crisis, pre-ZIRP standards. That is despite the rise of the UST curve off the Sept 2024 lows as captured in the next chart.

The above charts show the wild ride from the peak date for the 10Y UST (10-19-23) into the monster rally and duration home run in Nov-Dec 2023 (see Footnotes & Flashbacks: State of Yields 1-1-24). That 2-month run in the UST through the end of 2023 was a reminder that a lot can happen in a hurry.
The next stage of the UST curve in 2024 shift into a bear steepener was a reminder of how hard it has been to call the UST curve in this market. The market entered 2024 with a consensus for 5-6 cuts and a flattener with a major duration win. The market did get 4 cuts in 2024 (in 3 actions) later in the year but with higher rates on the long end and a steepener by year end. That came after the plunge in rates in Sept 2024 captured above (see Footnotes & Flashbacks: State of Yields 1-3-25) and the ensuing sharp rise after that.

The above chart updates the migration across the tightening cycle since the end of 2021 and now into the easing cycle. That upward shift across 2022 and 2023 still saw the 10Y UST converge by year end 2023 despite the +100 bps differential in fed funds between yearend 2022 and 2023.

We already looked at the UST curve issues in the Mini Market Lookback: Collision Courses ‘R’ Us (3-2-25). The anxiety has picked up around the consumer sector lately on some of the macro releases (sentiment, confidence), some bellwether companies (Walmart), and some industry color (homebuilding). The next round of payroll numbers this coming week will offer some critical data points as will used and new vehicle data as we get into the flow of the peak spring selling season.
The contentious nature of Trump’s tariff policies raise the stakes around what will be some serious trash talking if the policies do not work out as Trump and his very pugnacious team have promoted in line with the demands of their boss. The challenge for them is that 2+2 still equals 4 (the buyer pays, not the seller). According to Warren Buffet (an investor with a modest modicum of fundamental knowledge), tariffs are a “tax on goods” and the “tooth fairy doesn’t pay’em”). That said, the “selling country pays’em” in MAGA Land.
The market will be looking for receipts.

The above chart updates the YTD UST delta. We see a bull flattener to this point. Solving for X – the supply of UST – still awaits a final budget and forecast for borrowing needs that will include a very large assumed tariff revenue line.

The above UST delta chart updates the running bear steepener since the 9-16-24 lows. Those numbers are well off the recent highs out the curve.

The UST deltas from the end of 2023 show the higher rates beyond 5Y and the lower rates inside the 2Y UST with the FOMC easing. For some frames of reference on asset returns, the long duration UST ETF (TLT) has generated a return of -1.8% since the start of 2024 while the short duration UST ETF (SHY) generated +5.2%. The HY ETF (HYG) generated +10.9%.

The above chart updates the running bull steepener since the peak UST date on 10-19-23. From one angle, the UST deltas can give a sense of “what can go wrong” on the long end if it reverses. The long duration UST 20+Y (TLT) generated +17.8% since then, the short duration UST ETF 1-3Y (SHY )+7.7%, and the HY ETF (HYG) +20.9%.
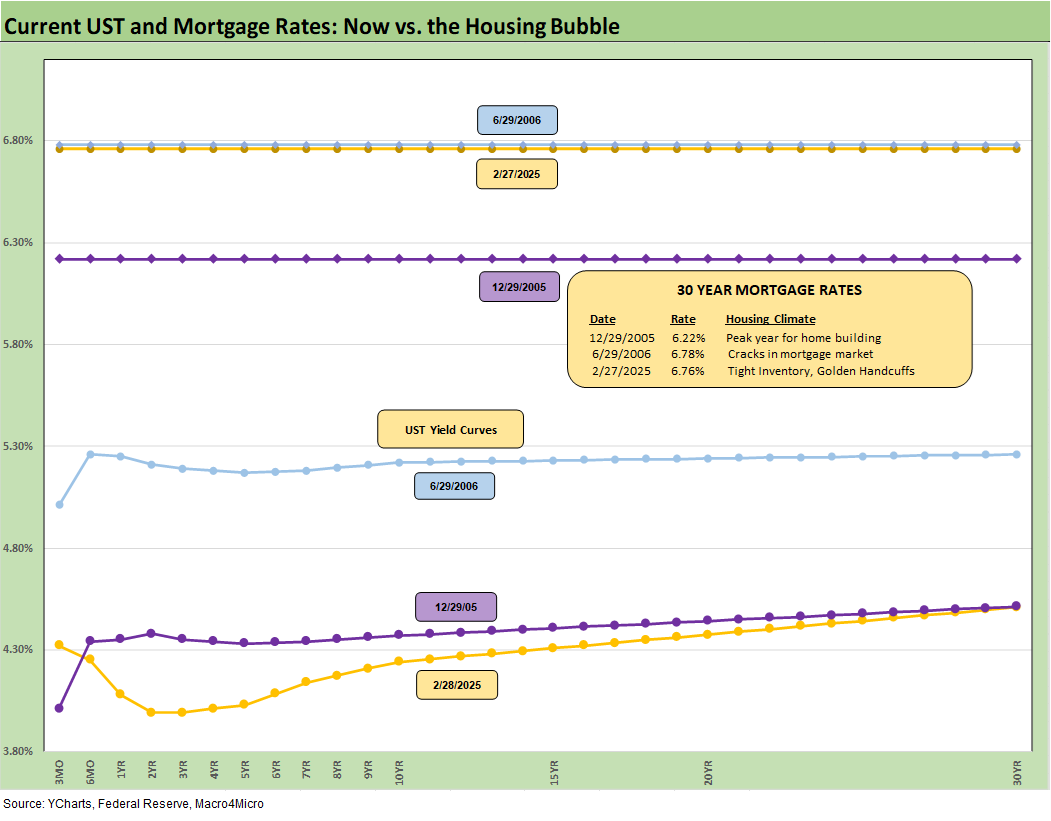
The above chart updates the UST curve and Freddie Mac bellwether 30Y UST for this past Friday and for two useful historical periods including the peak homebuilder year end of 2005 and mid-2006 when RMBS quality pressure was getting headlines as the housing bubble was peaking.
We are seeing mortgage rates slowly coming down again, but the mortgage spreads have been a headwind vs. earlier periods. The materially lower UST curve and 10Y UST still leave current mortgage rates very close to mid-2006 despite the materially lower UST curve now. We also post UST curves for each period in the chart. The Dec 2005 Freddie Mac 30Y rate at 6.2% is below current mortgage despite a higher 10Y UST in Dec 2005 vs. the past Friday close.

The above time series updates the 3M to 5Y UST slope since 1984. We see a long-term median of +109 bps vs. the current inversion of -29 bps. The median since the start of 2021 was -29 bps, or right on top of current levels.

We shorten up the timeline above from Jan 2021 to this past week for a better visual on the 3M to 5Y UST slope. We see the slope peak at +221 bps and then plunge to an inversion of -197 bps in May 2023. We saw an upward slope peak of +24 bps in mid-Jan 2025 that quickly reversed. The 3M to 10Y is also again inverted.

We wrap the state of yields publication this week with the running UST migration and related UST deltas from March 1, 2022, which is the month when ZIRP ended (effective March 17, 2022). We include the year end 2020 UST curve and 10-19-23 peak UST curve as frames of reference.
See also:
Mini Market Lookback: Collision Courses ‘R’ Us 3-2-25
PCE Jan 2025: Prices in Check, Income and Outlays Diverge 2-28-25
Durable Goods Jan25: Waiting Game 2-27-25
GDP 4Q24 Second Estimate: PCE Inflation the Main Event 2-27-25
New Homes Sales Jan 2024: Homebuilders Feeling Cyclical Signals? 2-26-25
Auto Tariffs: Japan, South Korea, and Germany Exposure 2-25-25
Footnotes & Flashbacks: Credit Markets 2-24-25
Footnotes & Flashbacks: State of Yields 2-23-25
Footnotes & Flashbacks: Asset Returns 2-23-25
Mini Market Lookback: Tariffs + Geopolitics + Human Nature = Risk 2-22-25
Existing Home Sales Jan 2025: Prices High, Volumes Soft, Inventory Up 2-21-25
AutoNation: Retail Resilient, Captive Finance Growth 2-21-25
Toll Brothers 1Q25: Performing with a Net 2-20-25
Housing Starts Jan 2025: Getting Eerie Out There 2-19-25
Herc Rentals: Swinging a Big Bat 2-18-25
UST Yields: Sept 2024 UST in Historical Context 2-17-25
Tariff links:
Auto Tariffs: Japan, South Korea, and Germany Exposure 2-25-25
Mini Market Lookback: Tariffs + Geopolitics + Human Nature = Risk 2-22-25
Reciprocal Tariffs: Weird Science 2-14-25
US-EU Trade: The Final Import/Export Mix 2024 2-11-25
Aluminum and Steel Tariffs: The Target is Canada 2-10-25
US-Mexico Trade: Import/Export Mix for 2024 2-10-25
Trade Exposure: US-Canada Import/Export Mix 2024 2-7-25
US Trade with the World: Import and Export Mix 2-6-25
The Trade Picture: Facts to Respect, Topics to Ponder 2-6-25
Tariffs: Questions to Ponder, Part 1 2-2-25
US-Canada: Tariffs Now More than a Negotiating Tactic 1-9-25
Trade: Oct 2024 Flows, Tariff Countdown 12-5-24
Mexico: Tariffs as the Economic Alamo 11-26-24
Tariff: Target Updates – Canada 11-26-24
Tariffs: The EU Meets the New World…Again…Maybe 10-29-24
Trump, Trade, and Tariffs: Northern Exposure, Canada Risk 10-25-24
Trump at Economic Club of Chicago: Thoughts on Autos 10-17-24
Facts Matter: China Syndrome on Trade 9-10-24