
Footnotes & Flashbacks: Credit Markets 3-3-25
IG spreads moved more in relative terms while HY is still in the June 2007 zone. Bring on the tariffs. Risk check dead ahead?


No more invasions then? We’re good? Winston says I shouldn’t trust you, but he’s a glass half empty kinda guy.
The “flood the zone” strategy certainly has been applied with vigor by Team Trump lately with waves of new tariffs and new product targets, DOGE disruption, razor thin budget approvals, a confused deportation backdrop, waves of executive orders and press bans (TASS in, AP out), and now more attacks on allies. Some geopolitical pots are boiling over that could further color trade tensions and retaliation and flow into such major sectors of US strength as Energy and Defense & Aerospace.
Markets could get nervous sooner rather than later depending on what Trump decides this week on Mexico and Canada (see Mini Market Lookback: Collision Courses ‘R’ Us 3-2-25, Mini Market Lookback: Tariffs + Geopolitics + Human Nature = Risk 2-22-25).
Handicapping how consumers and corporate fixed investment will react is the next round of questions with the UST rallying the past week and inverting on the front end with the increasingly mixed indicators (see Footnotes & Flashbacks: State of Yields 3-2-25, Auto Tariffs: Japan, South Korea, and Germany Exposure 2-25-25).
Equities are hanging tough on the basis of constructive running demand and favorable top line and earnings guidance. The credit markets hanging in also offer support for the equity side. Historically, credit leads equities with signals for major turns in the market.
Now comes the test of nerves with tariffs and the trade-off with consumer expectations and fixed investment planning in the face of unprecedented unit cost adjustments for so many industries. To quote Buffett on tariffs… “the tooth fairy doesn’t pay’em!” and that tariffs are “an act of war, to some degree.”

The above chart updates the running YTD total returns and excess returns across the IG and HY markets as well as the credit tiers. The profile of the IG returns and the tiers in a market with compressed spreads and 4.4% handle par weighted coupon in IG (vs. 4.3% on a 3M UST) is that returns in IG are a UST curve story for now. IG is coming off a very good week for duration. We covered those details in our Asset Return footnotes publication.
For US HY, we still see the benefits of higher coupons (6.4% par weighted) and some very limited spread compression YTD (-5 bps YTD). The reality of the June 2007-level spreads is that the game is still somewhat about disaster avoidance in the event of a sharp turn in risk. The main threat ahead is tariff fallout, but the full effects will only come at a lag.

IG spreads posted what in recent history was a material widening at +7 bps to +88 bps, but double-digit IG OAS levels remain inside or around most cyclical lows and only modestly above the +77 bps lows on 4Q24.
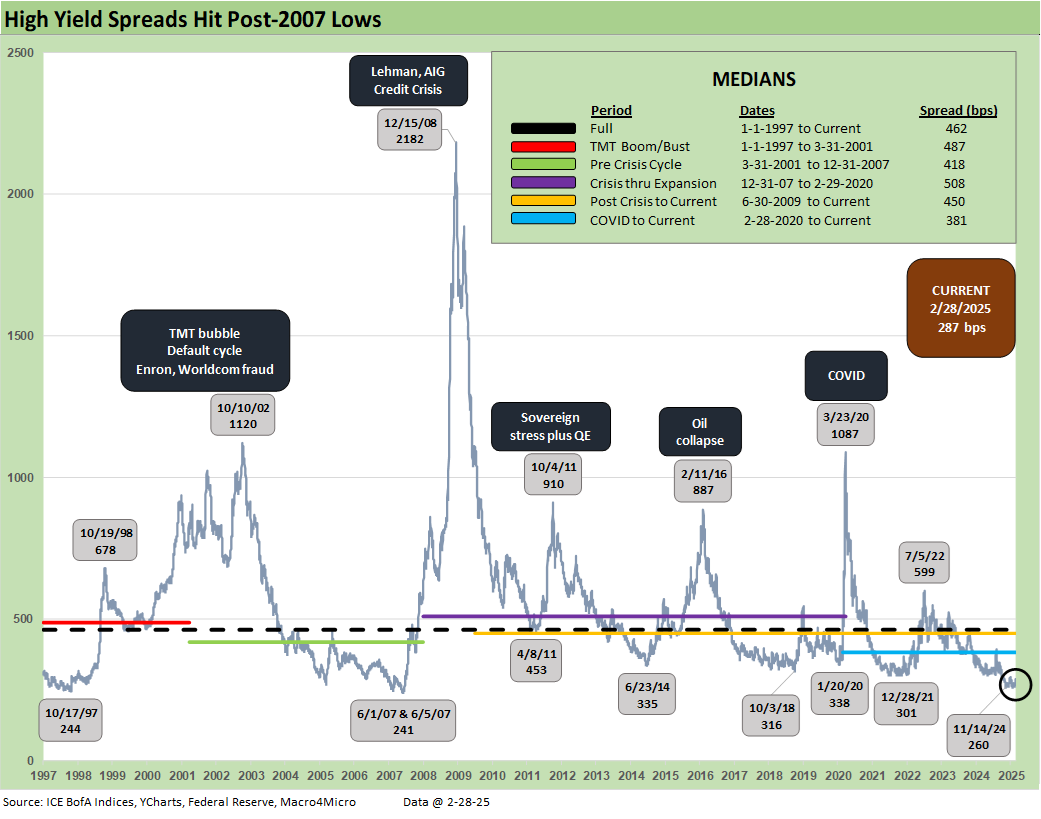
HY had another widening week at +9 bps to +287 bps. That HY OAS level is still comfortably inside the +300 bps level seldom crossed. It is also inside the June 2007 month-end levels. HY is +19 bps wider on the month and moderately above the +260 bps lows of Nov 2024.
As a reminder, HY OAS lows of +244 bps in Oct 1997 (IG had hit +53 bps) and closed the year at +296 bps in Dec 1997. For June 2007, the HY OAS low was +241 bps on June 1, 2007 (and June 5) and then closed June 2007 at +298 bps. The +300 bps handles of Dec 2021, Jan 2020, Oct 2018, and June 2014 offer other reminders of how tight this market remains.

As we covered in Mini Market Lookback: Collision Courses ‘R’ Us (3-2-25), quality spreads across the HY-IG differential barely moved and went only +2 bps on the week.
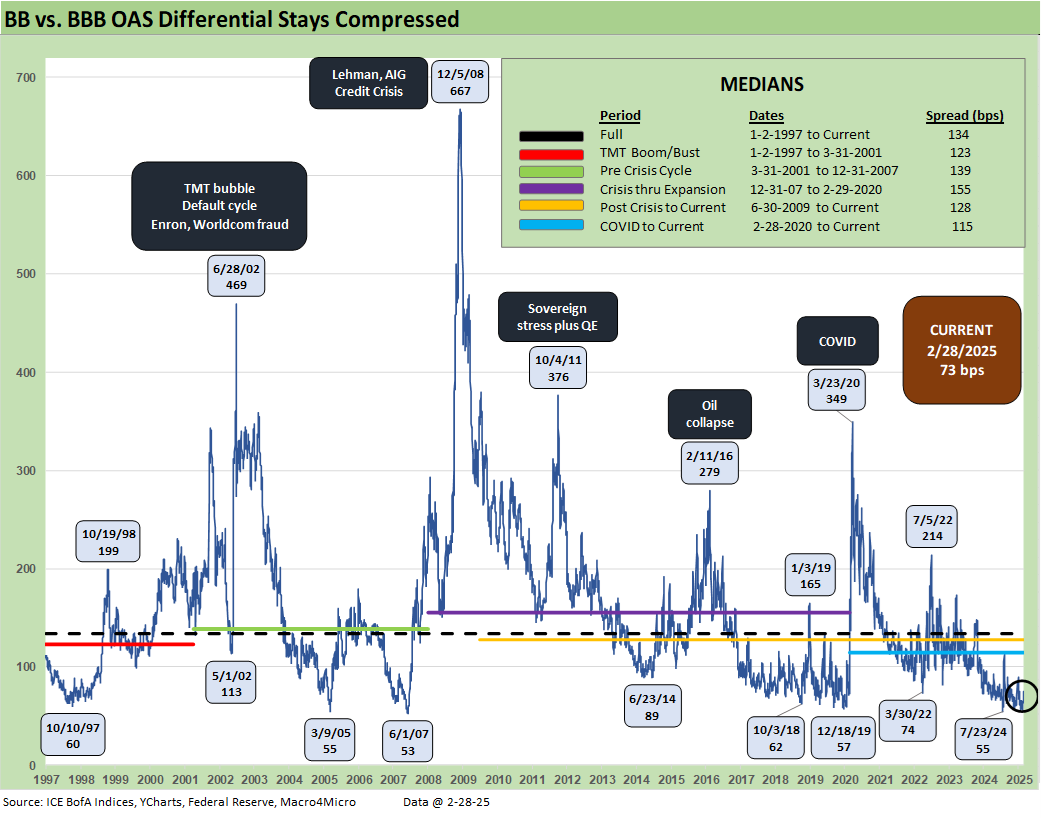
The BB OAS minus BBB OAS quality spread differential also barely moved with only +1 bps wider to +73 bps with BBBs +8 bps wider and BBs +9 bps wider.

The BB tier OAS widened modestly by +9 bps to +182 bps this past week which takes BB tier OAS to +25 bps higher than the Nov 2024 lows.

Sub-300 bps B tier spreads is an unusual milestone across the decades as noted in the chart. The current +288 bps is +34 bps higher than the Nov 2024 lows but still well inside the B tier OAS levels seen across each credit cycle low back to the June 2007 low tick in the sub-240 bps range to start June. We highlight that June 2007 ended that month with the B tier at +296 bps or above current levels. The B tier lows of 1997 stood at +292 bps back in the TMT years.

The above chart updates the comparative histories of the B tier and CCC tier and highlights major points of divergence between the two. The current +760 bps (vs. +955 bps long-term median) on the CCC tier reflects a +26 bps widening on the week including the month end index rebalancing. The CCC tier is always subject to the constituent migration patterns including dropouts (defaults) and exchanges (coercive or otherwise) that can move the needle (see The B vs. CCC Battle: Tough Neighborhood, Rough Players 7-7-24).

The above chart shortens the timeline from the period just before the March 2022 tightening cycle for better visuals on more recent B vs. CCC OAS action.

The quality spread differential of “CCC OAS minus B OAS” of +472 bps is inside the +482 bps long-term median. The differential has narrowed impressively since the peak of +741 bps during the cyclical anxiety period of the tightening cycle in fall 2022. Some of that tightening is tied to exits and some to distressed exchanges but also to a broader risk asset rally that is mirrored in equities and other credit markets.
The current +472 bps quality spread differential looks like many of the timeline medians broken out in the box with the notable exception of the TMT bubble and collapse of that market into early 2001.

The above chart zeroes in on the 2022-2025 timeline for the CCC-B tier quality spread differential. The constituent shifts across some notable exchanges and dropouts and a major credit rally are evident in multiple material swings along the way. Executing on distressed exchanges has generated its share of headlines (e.g. Carvana) but much less than would have been seen if inflation had held in longer and even more tightening was needed.
A look at yields…

The HY index and IG index yield histories swung around with the credit cycles but were notably distorted across the ZIRP and QE years after late 2008. The current yield curve backdrop is very distinct now, but HY and IG still are best framed against the pre-ZIRP years.
We regularly make the case that the 9.3% pre-crisis (pre-ZIRP) median for HY and 6.1% in IG make for the most relevant frames of reference. That is backed up by framing median spreads vs. current spreads and index yield benchmarks.
Current yields for HY of 7.16% and 5.09% for IG reflect the low UST levels relative to past cycles as well as historically tight spreads. Median spreads would put all-in yield in HY closer to pre-crisis medians.
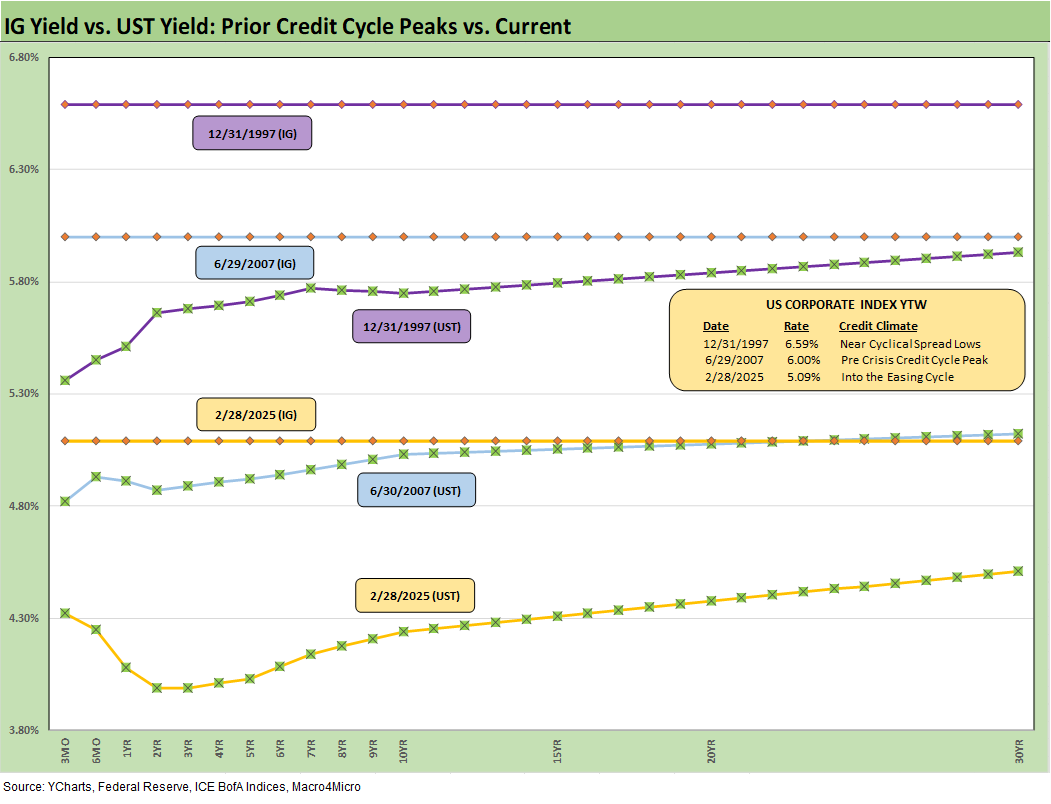
The above chart frames IG index yields and the related UST curve for the Friday close. We include two useful comps from prior credit cycle peaks in June 2007 and Dec 1997 for some credit cycle peak context. Those periods in 1997 and 2007 reflect market backdrops when credit markets were hot, risk appetites high, and spreads were down near multiyear lows. For IG yields, the relative yield story is heavily dictated by the UST curve differentials with spreads tight in all three markets.

The above chart does the same drill as the prior chart but for HY index yields. The low UST curve vs. history and extremely tight spreads put the current HY index yield below the earlier peak credit cycles. The volatility of 1998 and the experience of late 2007 on the way into the 2008 crisis period offers a reminder that risk repricing can come on with a vengeance.
The summer of 2007 was the start of major problems in the credit market, but the equity markets kept on rallying. Later in the turmoil and well after the fact, the start of the recession was tagged as Dec 2007 (see Business Cycles: The Recession Dating Game 10-10-22).
See also:
Footnotes & Flashbacks: Asset Returns 3-2-25
Footnotes & Flashbacks: State of Yields 3-2-25
Mini Market Lookback: Collision Courses ‘R’ Us 3-2-25
PCE Jan 2025: Prices in Check, Income and Outlays Diverge 2-28-25
Durable Goods Jan25: Waiting Game 2-27-25
GDP 4Q24 Second Estimate: PCE Inflation the Main Event 2-27-25
New Homes Sales Jan 2024: Homebuilders Feeling Cyclical Signals? 2-26-25
Auto Tariffs: Japan, South Korea, and Germany Exposure 2-25-25
Mini Market Lookback: Tariffs + Geopolitics + Human Nature = Risk 2-22-25
Existing Home Sales Jan 2025: Prices High, Volumes Soft, Inventory Up 2-21-25
AutoNation: Retail Resilient, Captive Finance Growth 2-21-25
Toll Brothers 1Q25: Performing with a Net 2-20-25
Housing Starts Jan 2025: Getting Eerie Out There 2-19-25
Herc Rentals: Swinging a Big Bat 2-18-25
UST Yields: Sept 2024 UST in Historical Context 2-17-25
Tariff links:
Auto Tariffs: Japan, South Korea, and Germany Exposure 2-25-25
Mini Market Lookback: Tariffs + Geopolitics + Human Nature = Risk 2-22-25
Reciprocal Tariffs: Weird Science 2-14-25
US-EU Trade: The Final Import/Export Mix 2024 2-11-25
Aluminum and Steel Tariffs: The Target is Canada 2-10-25
US-Mexico Trade: Import/Export Mix for 2024 2-10-25
Trade Exposure: US-Canada Import/Export Mix 2024 2-7-25
US Trade with the World: Import and Export Mix 2-6-25
The Trade Picture: Facts to Respect, Topics to Ponder 2-6-25
Tariffs: Questions to Ponder, Part 1 2-2-25
US-Canada: Tariffs Now More than a Negotiating Tactic 1-9-25
Trade: Oct 2024 Flows, Tariff Countdown 12-5-24
Mexico: Tariffs as the Economic Alamo 11-26-24
Tariff: Target Updates – Canada 11-26-24
Tariffs: The EU Meets the New World…Again…Maybe 10-29-24
Trump, Trade, and Tariffs: Northern Exposure, Canada Risk 10-25-24
Trump at Economic Club of Chicago: Thoughts on Autos 10-17-24
Facts Matter: China Syndrome on Trade 9-10-24
Select Histories:
Annual and Monthly Asset Return Quilt 2024 Final Score 1-02-25
Spread Walk 2024 Final Score 1-2-25
HY and IG Returns since 1997: Four Bubbles and Too Many Funerals 12-31-24
HY OAS Lows Memory Lane: 2024, 2007, and 1997 10-8-24
The B vs. CCC Battle: Tough Neighborhood, Rough Players 7-7-24
HY Spreads: Celebrating Tumultuous Times at a Credit Peak 6-13-24
Credit Markets Across the Decades 4-8-24
Credit Cycles: Historical Lightning Round 4-8-24
Histories: Asset Return Journey from 2016 to 2023 1-21-24
HY Multicycle Spreads, Excess Returns, Total Returns 12-15-23
HY Credit Spreads: Migration, Medians, and Misdirection 11-6-23
Credit Spreads: Proportions Matter in Risk Compensation 8-14-23
Fed Funds vs. Credit Spreads and Yields Across the Cycles 6-19-23
Wild Transition Year: The Chaos of 2007 11-1-22
Greenspan’s Last Hurrah: His Wild Finish Before the Crisis 10-30-22