
Payrolls Sep25: Into the Weeds
We dig into the delayed September occupation lines. Healthcare and Leisure continue the heavy lifting, but mix remains a challenge.


At least the lights are back on…
September nonfarm payrolls rose 119K, with private payrolls up 97K and government up 22K. Though an improvement over the last few months and above the 75K average this year, the -33K net downward revisions still darken the overall picture with Oct-Nov posting major layoff headlines.
The concentrated mix of payroll deltas continued as Healthcare and Social Assistance added 57K jobs in September and Leisure and Hospitality added 47K. Together they account for 104K of the 119K September gain, even though healthcare is only about 15 percent of jobs and leisure about 11 percent. That should raise flags with manufacturing and other cyclicals remaining soft.
Goods-producing employment reversed trend to grow 10K in September as strong Construction offset other losses. Manufacturing lost another 6K jobs in September, moving down to -54K on the year. Some of that Construction gain reflects AI and data center capex mania, but it is a narrow channel compared to the broader manufacturing chain.
Today’s print still reads like a late-cycle labor market with sustained activity in lower multiplier effect categories. The September report that is arriving after a roughly seven week government shutdown, so the read-through for Fed decisions still needs a more recent picture as the private sector anecdotes have not been encouraging.
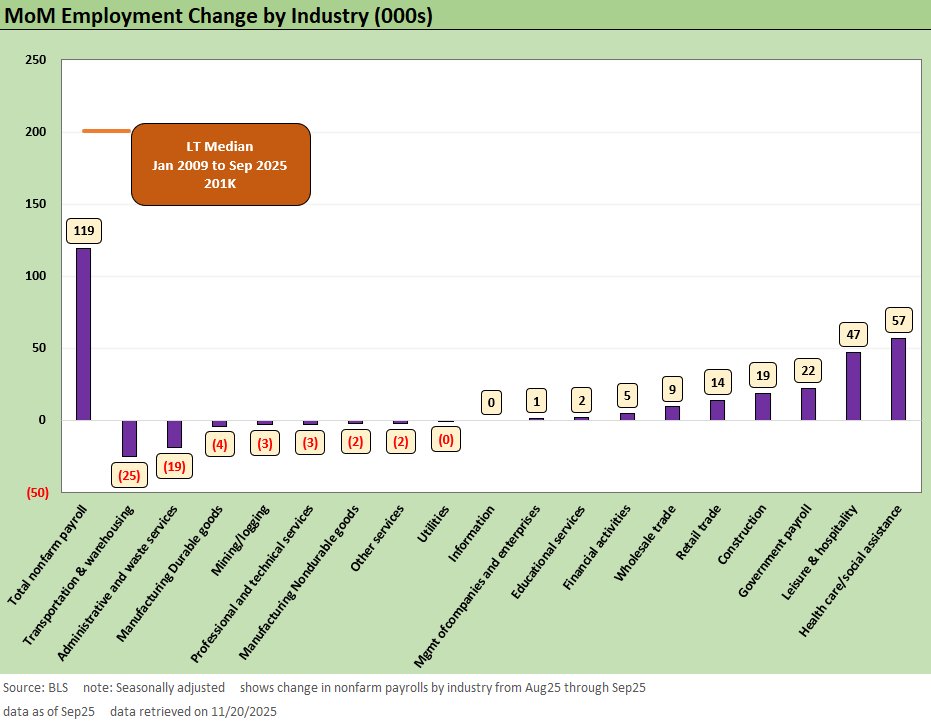
The above chart covers the monthly deltas by key industry groupings from Table B-1 of the Payrolls report as the headline September gain of roughly 119K nonfarm jobs is better than expected even if an overall mediocre print in the context of 2022 to 2025. A single bounce this month needs to be supported by the quickly incoming next round of data, or the labor market signal will continue to be read as weak.
The revisions support caution with a net downward revision of about 33K to earlier months, with cuts concentrated in Transportation and Financial Activities that in turn frames the post-Liberation Day labor market in more of a drift than growth mode.
As with the past few months, the composition and breadth of gains looks fragile and increasingly later cycle. Healthcare and Social Assistance added about 57K jobs in September, and leisure and hospitality added about 47K, totaling 94K. Adding Government payrolls (+22K), this constitutes the entirety of the gains on the month. Roughly half of the major industries in the bar chart are up in the month and half are down with layoffs focused on lower friction sectors. For now, that is a worrying signal.
Given the report timing, the composition is more telling about what the Fed might read. The FOMC could see cyclical weakness despite the Sept pop in payrolls. That is anything but clear with FedWatch odds seeing the odds of a cut in the Dec meeting down dipping below 40% to 39.8% as we go to print.
Inflation has brought better than expected news this year, but the shutdown has brought further uncertainty to Fed calculus on the divergence of inflation and labor. Stagflation is still a lurking risk that will weigh on the FOMC.
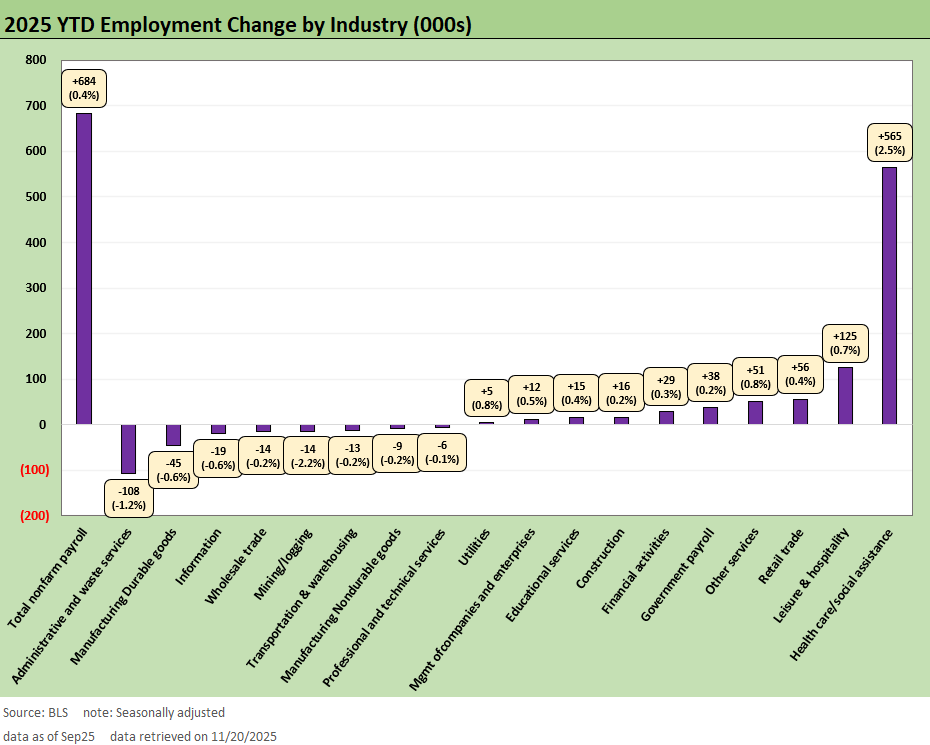
The 2025 YTD change by industry drives the concentration story home. Nonfarm payrolls are up about 684K so far this year. Healthcare and Social Assistance accounts for about 565K of that increase and leisure and hospitality for another 125K. Taken together, those two sectors grew by 690K jobs, which is slightly more than the total net gain across the economy. Put another way, Healthcare contributed about 83 percent of the YTD net increase in payrolls and Leisure adds another 18 percent or so. That is, the combination is greater than the YTD net job adds in the overall economy.
To frame that in overall composition, Healthcare and Leisure are the two largest industries above besides Government. Healthcare accounts for just under 15 percent of total employment, while Leisure and Hospitality is roughly 11 percent of the job base. Together they make up a bit more than a quarter of payroll employment, but drove more than 100 percent of net job growth this year. That gap between share of jobs and share of gains is a clear sign that the labor market is not firing on all cylinder. It is being held up by sectors that are big enough to move the employment needle, but not big enough to offset weakness in goods and other services. The concern is compounded given the lower multiplier effects seen across these two labor intensive service industries.
The headwinds drags are also important in terms of footprint. Goods producing industries are down about 52K jobs year to date. Manufacturing is down 54K on the year, with Construction adding 16K jobs. Construction is in the goods bucket, but that sector does not fully offset manufacturing losses. Tariff policy clearly has failed to get the intended domestic manufacturing capacity back into growth mode.
Into the Weeds…
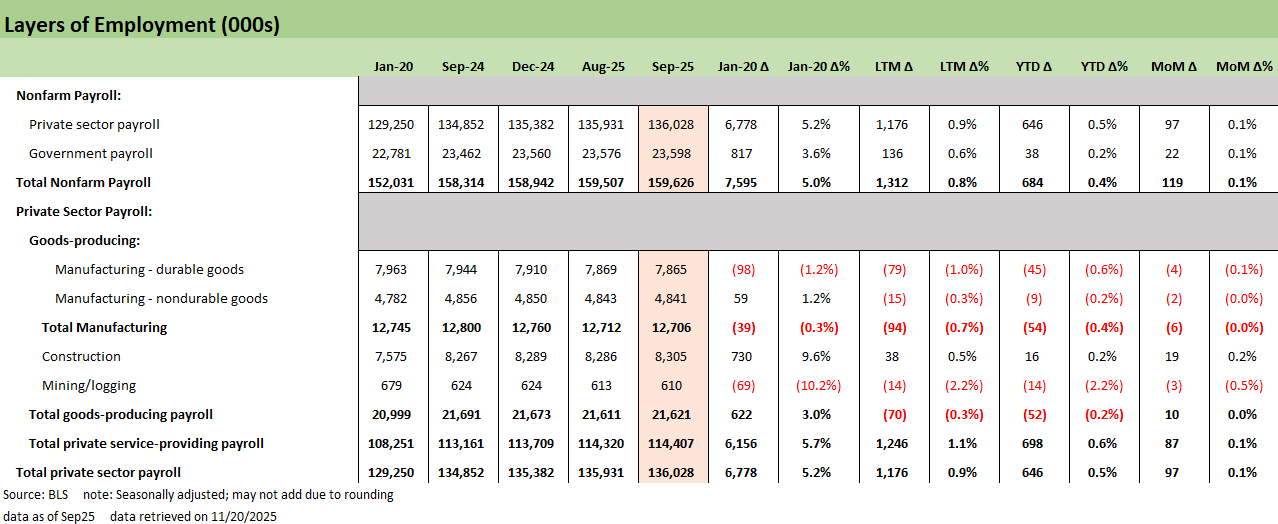
The next series of charts break out granular detail of various occupation lines and industry groupings from this morning’s release with some key histories shown. We start with the broadest level that compares the Public and Private split and the Goods-Producing and Service-Providing sectors.
In effect, all of the net private sector job growth in 2025 is coming from services. Goods producing employment remains slightly negative year to date, and government contributes a small tailwind with 22K added in September and about 38K added year to date. For now, the demographically driven Healthcare demand is supporting labor growth. The bleak cyclical picture painted the past few months does not improve much in the print.
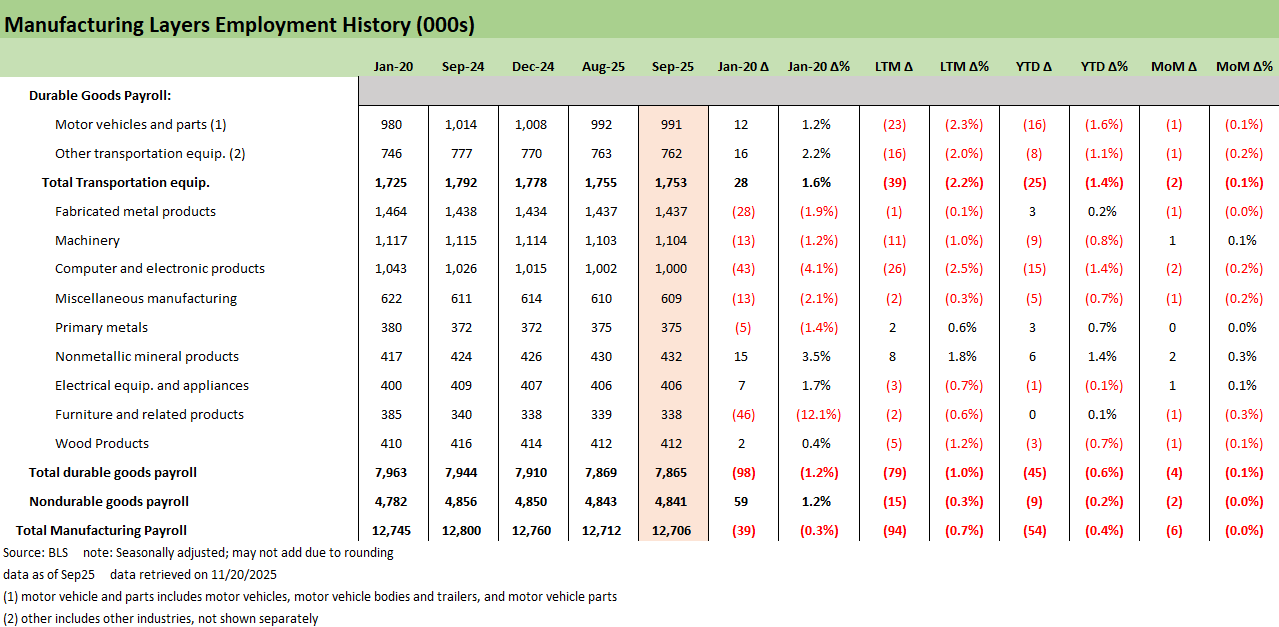
Manufacturing remains a slow bleed rather than a sharp shock with payrolls contracting by 6K in September and down 54K year to date. Within that, Durable Manufacturing is the main driver, down another 4K on the month and 45K on the year. The pressure remains concentrated in Transportation Equipment and Computer and Electronic products, with very few offsets elsewhere.
This continues to expose the dichotomy between record AI capex investments that have dominated discussions and the core manufacturing base. Data center and AI related infrastructure spending has meant Big Tech signaling several hundred billion dollars a year in planned AI investment, but that demand shows up in a narrow set of categories (data center structures, specialized electrical work, semiconductors, and networking equipment, etc.). It does not show up in most of the manufacturing lines that drive payroll counts and brings questions about how those investments impact the broader economy. The data suggests that most manufacturers are still in a slow grind or decline rather than an upswing, even if a handful of AI exposed segments are poised to do much better.
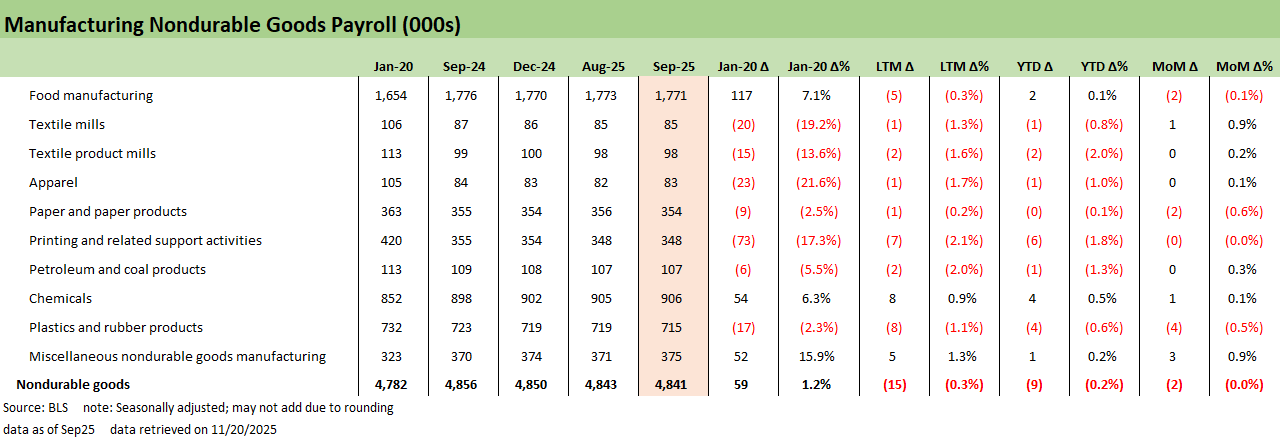
The Nondurables manufacturing lines are shown above with mix of ups and downs this month. We still view these as examples of declining domestic production needs and where no amount of tariff regimes could reignite significant domestic investment.
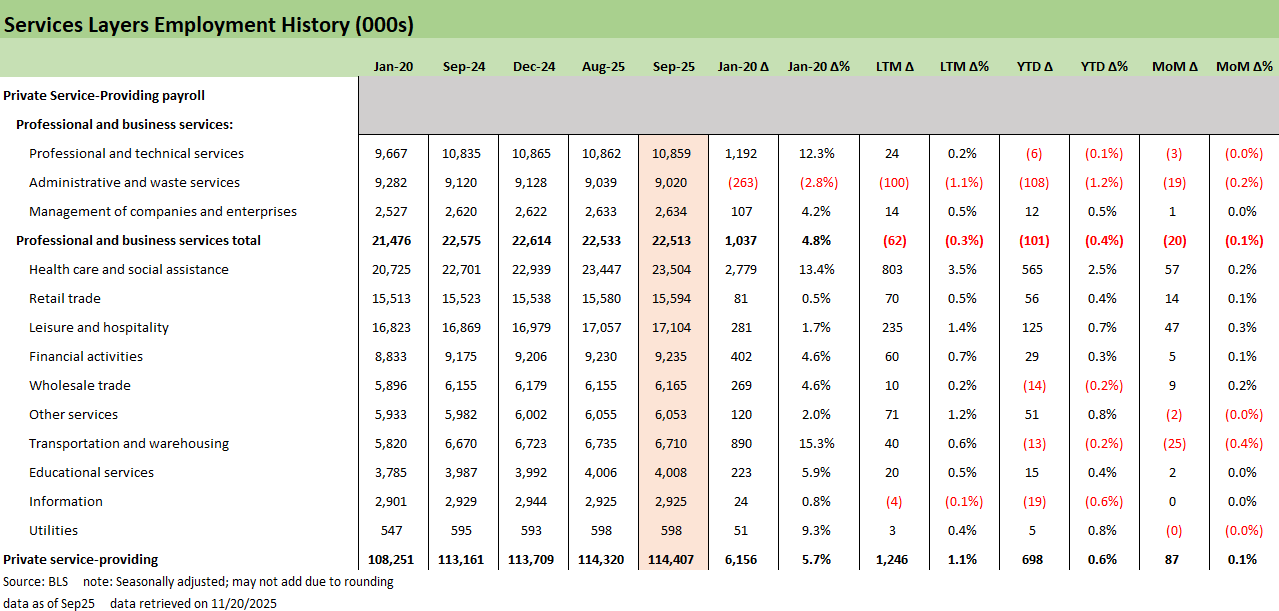
The Services numbers are shown above, showing another vantage point for the dominance of Healthcare on the year. A main sticking point of the shutdown as the fight over enhanced ACA premium tax credits leaves that strength in question going into 2026. The reopening of the Government did not resolve the ACA subsidies clash. For now, the labor tables reflect a pre-cliff environment in which ACA exchange subsidies are still in place and public coverage remains relatively broad. If the enhanced subsidies were allowed to lapse, premiums for some exchange enrollees would jump and payer mixes in exchange heavy markets would likely worsen. That would not unwind the structural demand for healthcare workers, but it could make hospitals and ambulatory providers more cautious about their hiring and capital plans in 2026 than this year’s job growth alone would suggest.
A good print for Leisure and Travel ahead of the holiday seasons could be positive for discretionary spending and consumer signals but that is contrary to a lot of industry headlines as we approach the season. These have still been in recovery mode from COVID depending on the subsector. Another possible angle here is the K-shaped economy that sees much more of the concentration of wealthier segment spending showing higher demand for Leisure and Hospitality products.
Professional and business services tell more of a late cycle story. As a whole, the sector is a drag year to date, with core white collar hiring stalling and temp and outsourced roles actively cut as firms manage headcount more defensively. That pattern could quickly lead to broader slowdowns in hiring and capex and anecdotes on slowing hiring have picked up across the shutdown.
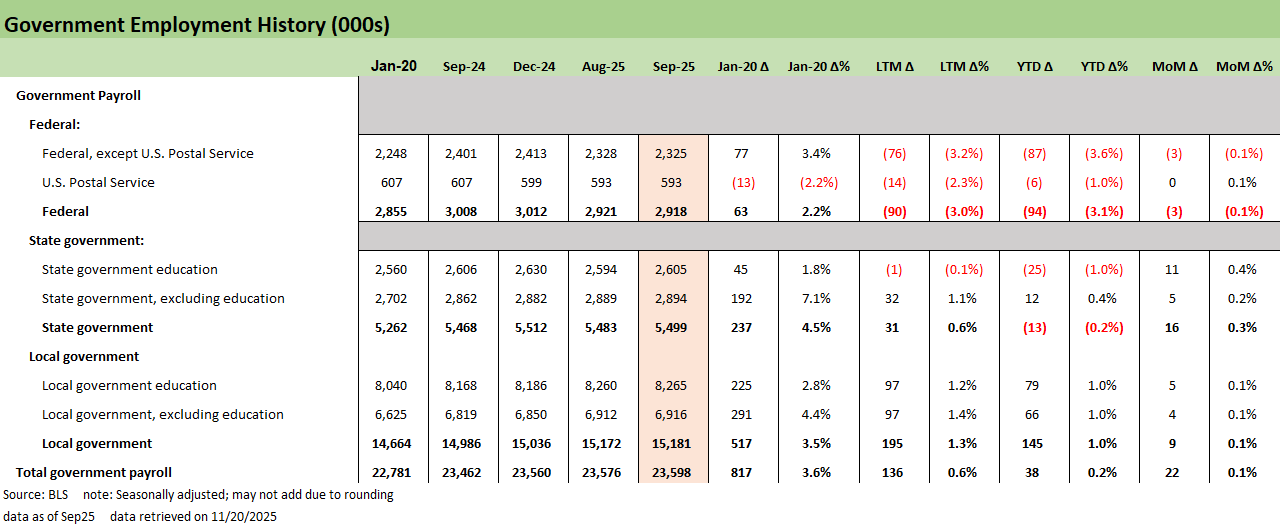
Government employment added about 22K jobs in September and is up roughly 38K year to date, with most of the growth coming from state and especially local government. Government is not driving the cycle with material weakness at the Federal level, but it has helped stabilize growth this year. That may change next month as we’ll see shutdown related distortions.
See also:
Employment Sept 2025: In Data We Trust 11-20-25
The Curve: Slopes Can Get Complicated 11-16-25
Market Commentary: Asset Returns 11-16-25
Mini Market Lookback: Tariff Policy Shift Tells an Obvious Story 11-15-25
Retail Gasoline Prices: Biblical Power to Control Global Commodities 11-13-25
Credit Markets: Budget Armistice or GOP Victory Day? 11-12-25
Simplifying the Affordability Question 11-11-25
The Curve: Back to the Future 11-9-25
Market Commetary: Asset Returns 11-9-25
Mini Market Lookback: All that Glitters… 11-8-25
Credit Markets: Little Shop of Worries 11-3-25
Mini Market Lookback: Not Quite Magnificent Week 11-1-25
Synchrony: Credit Card Bellwether 10-30-25
Credit Markets: Call Me After Trouble Arrives 10-27-25
Market Commentary: Asset Returns 10-26-25
Existing Home Sales Sept 2025: Staying in a Tight Range 10-26-25
Mini Market Lookback: Absence of Bad News Reigns 10-25-25
CPI September 2025: Headline Up, Core Down 10-24-25
General Motors Update: Same Ride, Smooth Enough 10-23-25
Credit Markets: The Conan the Barbarian Rule 10-20-25
Mini Market Lookback: Healthy Banks, Mixed Economy, Poor Governance 10-18-25
Mini Market Lookback: Event Risk Revisited 10-11-25
Credit Profile: General Motors and GM Financial 10-9-25
Mini Market Lookback: Chess? Checkers? Set the game table on fire? 10-4-25
JOLTS Aug 2025: Tough math when “total unemployed > job openings” 9-30-25
Mini Market Lookback: Market Compartmentalization, Political Chaos 9-27-25
PCE August 2025: Very Slow Fuse 9-26-25
Durable Goods Aug 2025: Core Demand Stays Steady 9-25-25
2Q25 GDP Final Estimate: Big Upward Revision 9-25-25
New Homes Sales Aug 2025: Surprise Bounce, Revisions Ahead? 9-25-25
Mini Market Lookback: Easy Street 9-20-25
Home Starts August 2025: Bad News for Starts 9-17-25
Industrial Production Aug 2025: Capacity Utilization 9-16-25
Retail Sales Aug 2025: Resilience with Fraying Edges 9-16-25
Mini Market Lookback: Ugly Week in America, Mild in Markets 9-13-25
CPI August 2025: Slow Burn or Fleeting Adjustment? 9-11-25
PPI Aug 2025: For my next trick… 9-10-25
Mini Market Lookback: Job Trends Worst Since COVID 9-6-25
 |
|