
Market Commentary: Asset Returns 11-16-25
Asset returns went through another tough week with debt hit by the UST curve and equities overwhelmingly in the red zone.


“Maybe I should ease up on tariffs and admit ‘the buyer pays’ customs.”
We already looked at the weekly returns of the benchmarks and ETFs and the 1-week UST deltas, and there was little good news during the week with the exception of modestly tighter HY spreads. On a positive note, there appears to be a recognition by Team Trump that tariffs were hurting prices (see Mini Market Lookback: Tariff Policy Shift Tells an Obvious Story 11-15-25). Reality is always a good thing.
The tacit admission that “the buyer pays” and that tariffs impact prices was hardly admitted with any outside voices from Team Trump, but facts are facts and we will soon get even more confirmation when CPI data returns.
The battering of the GOP in the recent election prompted an Executive Order from the White House to roll in numerous exemptions to support food prices via tariff relief (e.g., coffee, beef, bananas, fertilizer). Those actions of course excluded any input from the legislative branch as Trump holds tight to all decision-making power on tariffs and the market awaits the SCOTUS IEEPA decision.
There is no hiding from higher YoY inflation in September 2025 vs. Dec 2024 (Biden’s last full month) in Food, Energy, and numerous categories. That is already on the scoreboard (see Simplifying the Affordability Question 11-11-25, Retail Gasoline Prices: Biblical Power to Control Global Commodities 11-13-25).
The UST curve and reading the green on the FOMC needs a lot more economic data over a very short time period ahead of the next FOMC meeting. We will get some belated, lagging numbers in coming weeks into early December. The FedWatch odds for an FOMC cut have plunged by almost 50 points in a month to 44% and dropped by over 22 points in a week.
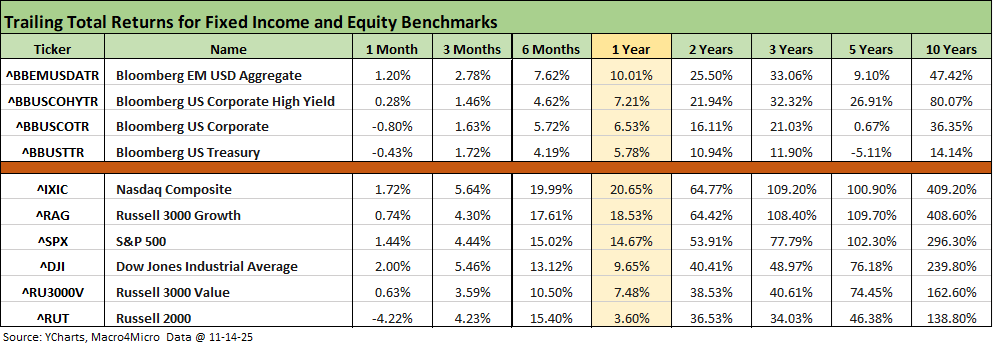
The above table updates the high-level fixed income and equity benchmarks we monitor each week. We line up the returns under the debt and equities buckets in descending order of 1-year total returns. In equities, we see large caps broadly and growth stocks putting up strong numbers over 1-year while the small cap Russell 2000 has been more a case of ebb and flow as evident in the 1-year vs. 6-month and 1-month returns.
The trailing 1-month return numbers have been in “fade mode” after spending recent months with the table above only showing the trailing 5-year period for the UST benchmark in the red. We see an adverse move for 1-month into more negative returns with the US IG at -0.8% and UST at -0.43%. In equities, the small cap Russell 2000 return moved into the red at -4.2% after a very strong run that still shows the trailing 6-month period at +15.4%.
The tone around the economic cycle and the fate of FOMC easing has gotten a bit noisier with plunging odds of a December FOMC cut to 44%. That has undermined fixed income returns and fed more than a little confusion around what direction the economic cycle is heading during a stretch of time when economic data releases were silent. The visibility around the numbers will slowly improve with the BLS and BEA soon open again for business.
The rolling return visual
In the next section, we get into the details of the 32 ETFs and benchmarks for a mix of trailing periods. Below we offer a condensed 4-chart view for an easy visual on how the mix of positive vs. negative returns shape up. This is a useful exercise we do each week looking for signals across industry groups and asset classes.
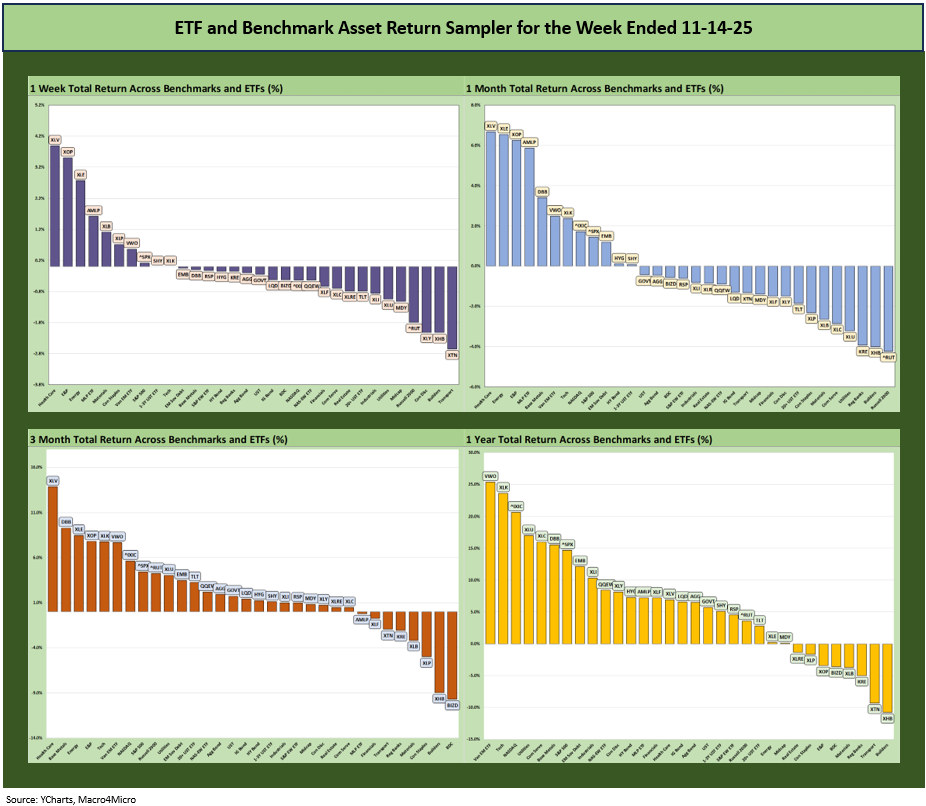
Across what has been a very strong year for positive asset returns across so many asset classes and subsectors as detailed in the LTM returns (above) and YTD numbers (detailed further below), we are seeing a shift into more negative buckets as the year winds down. The weakness can be tied to cyclical questions looming larger, the health of the consumer under a cloud, tariffs working their way into the working capital cycle, and more tariffs unfolding as US buyers/importers evaluate tariff cost mitigation strategies that can hit employment with outright cuts or can scale back hiring plans.
The Magnificent 7 heavy ETFs…
Some of the benchmarks and industry ETFs we include have issuer concentration elements that leave them wagged by a few names. When looking across some of the bellwether industry and subsector ETFs in the rankings, it is good to keep in mind which narrow ETFs (vs. broad market benchmarks) get wagged more by the “Magnificent 7” including Consumer Discretionary (XLY) with Amazon and Tesla, Tech (XLK) with Microsoft, Apple, and NVIDIA, and Communications Services (XLC) with Alphabet and Meta.
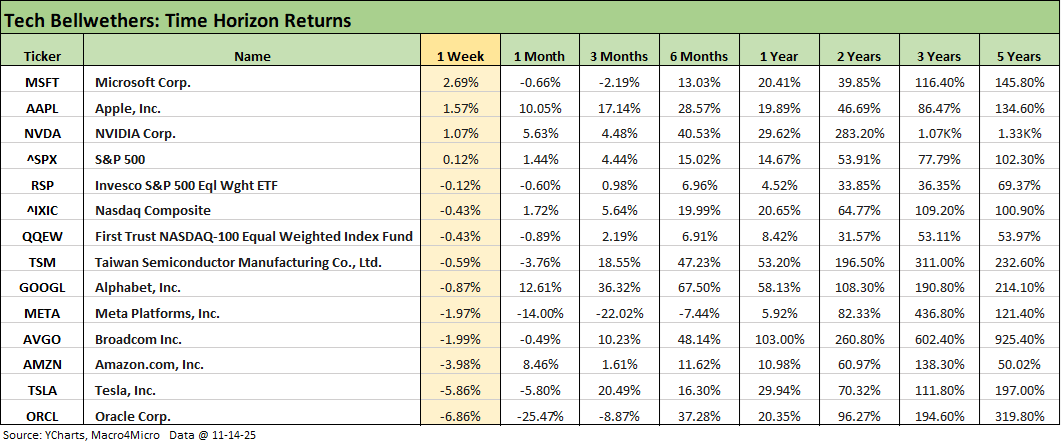
We already looked at the tech bellwether weekly performance in our Mini Market Lookback: Tariff Policy Shift Tells an Obvious Story (11-15-25). It was another week of soft numbers as the market wrestles with excess in valuation and now the growing sense that a lot of debt (“on or off” balance sheet) will be necessary to make the AI boom get to operational levels that will justify the extreme valuations for the full AI chain and related infrastructure needs (notably power and data centers).
We see only 3 of the Mag 7 in positive range for the week and just ahead of the S&P 500. The NASDAQ and the Equal Weight NASDAQ 100 were both negative while the Mag 7 +3 (the “3” includes Taiwan Semi, Broadcom, and Oracle) posted 7 of 10 in the red. Oracle has now taken a beating back to 3 months after a monster rally that still leaves the trailing 6-month return at +37.3%. The only tech company line above for the trailing 6-month period where a bellwether posted single digit or weak returns was Meta (-7.4%). All are positive for the trailing 1-year. Only Meta among the single name tech bellwethers is in single digit returns looking back 1 year although the Equal Weight NASDAQ 100 (QQEW) is also in single digits.
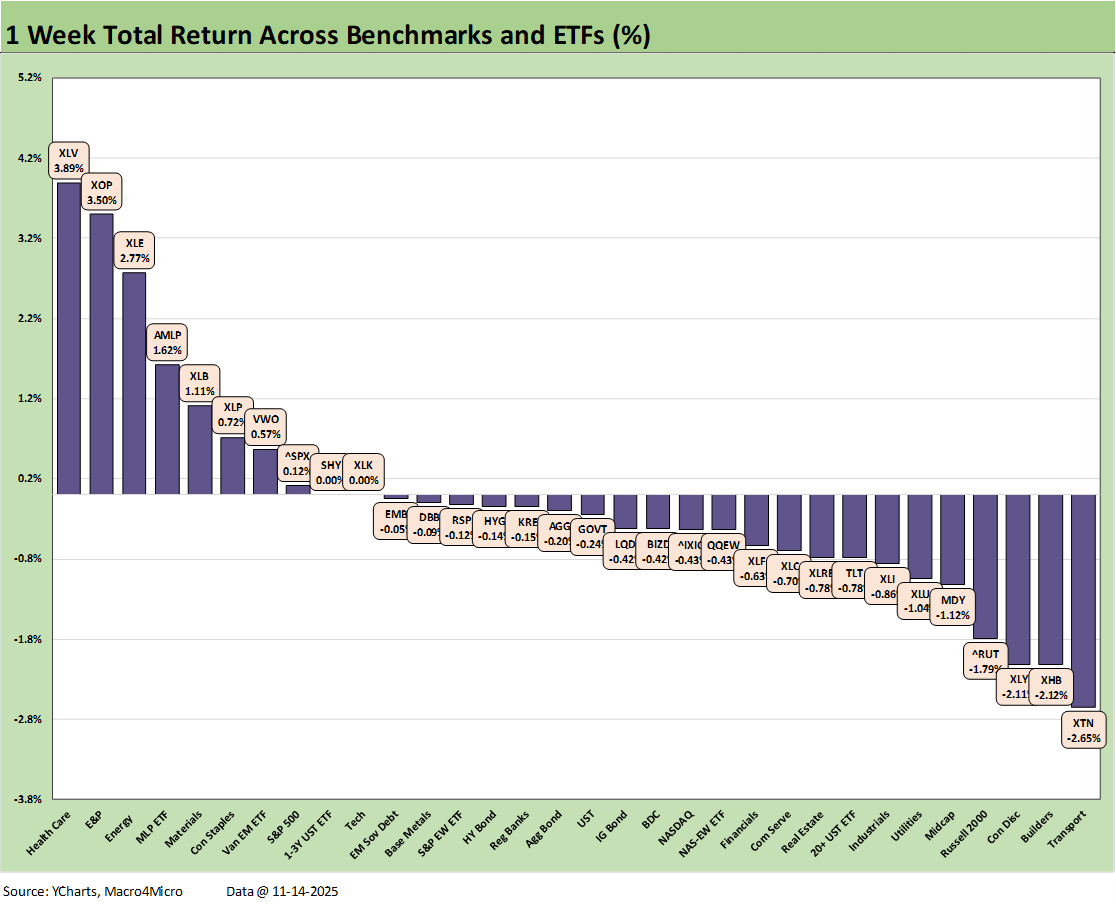
We already looked at the weekly performance in our Mini Market Lookback: Tariff Policy Shift Tells an Obvious Story (11-15-25). Only 8 lines posted positive returns with the health care rally evident in the XLV ETF at #1 and joined in the leader ranks by three energy ETFs (XOP, XLE, AMLP). The small cap Russell 2000 and Midcaps in the bottom quartile were notable laggards with the large cap S&P 500 barely squeezing into the top quartile on slightly positive returns. Bond ETFs were all negative except the short UST ETF (SHY), which weighed in flat at 0%.
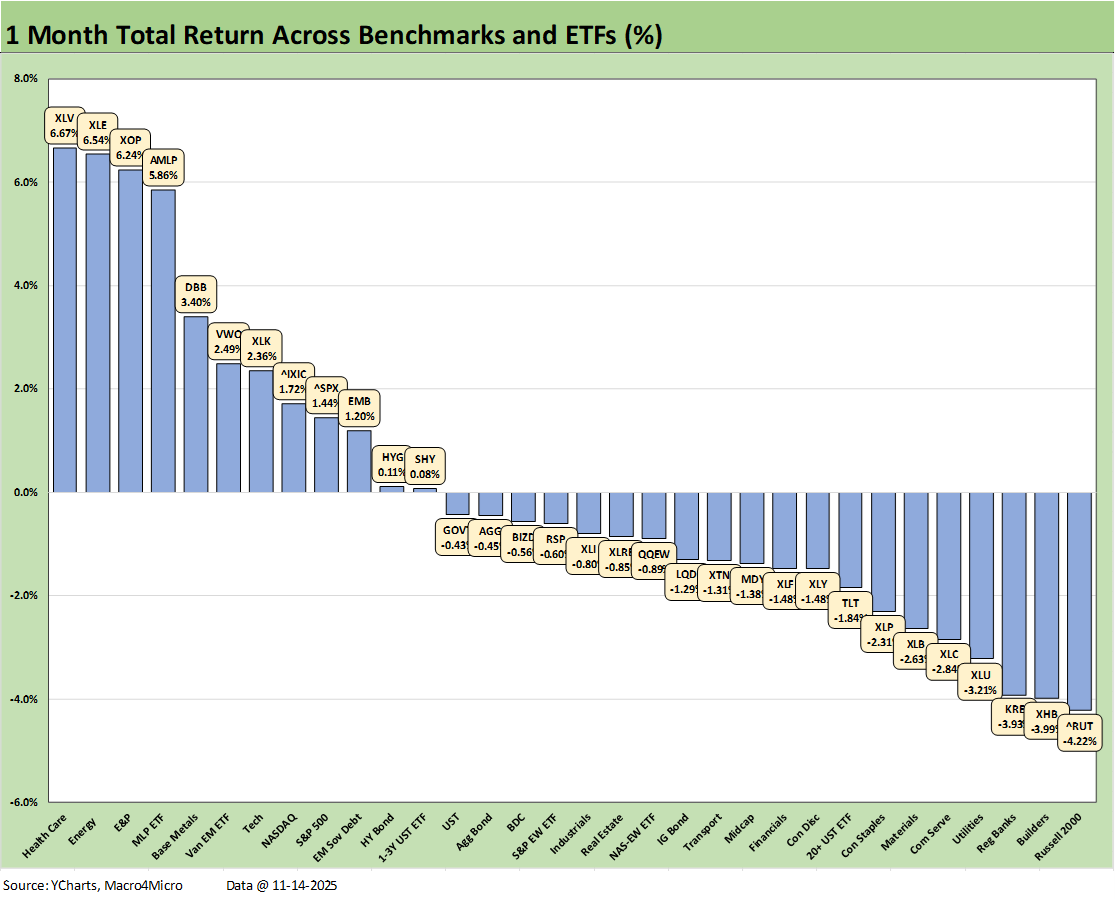
The 1-month time horizon weighed in at 12 positive and 20 negative. Tech-centric ETFs were lighter for the month with only the Tech ETF (XLK) at the lower end of the top quartile at #7 with NASDAQ at #8. Only XLK generated a positive return among the Mag 7 heavy ETFs although NASDAQ and S&P 500 are both heavily swayed by the major tech names and came in positive. Communications Services (XLC) was in the bottom quartile while Consumer Discretionary (with TSLA and AMZN) was at the bottom of the third quartile and negative.
The bottom of the group shows the small cap Russell 2000 in dead last with some interest rate sensitive names such as Homebuilders (XHB), Regional Banks (KRE) and Utilities (XLU) in the bottom ranks. The regional banks have also been tagged with some concerns around the small business and middle market credit cycle as well as questions on where funding costs will go subject to the FOMC and UST shapeshifting. The broader Financials (XLF) were also negative and down in the lower end of the third quartile.
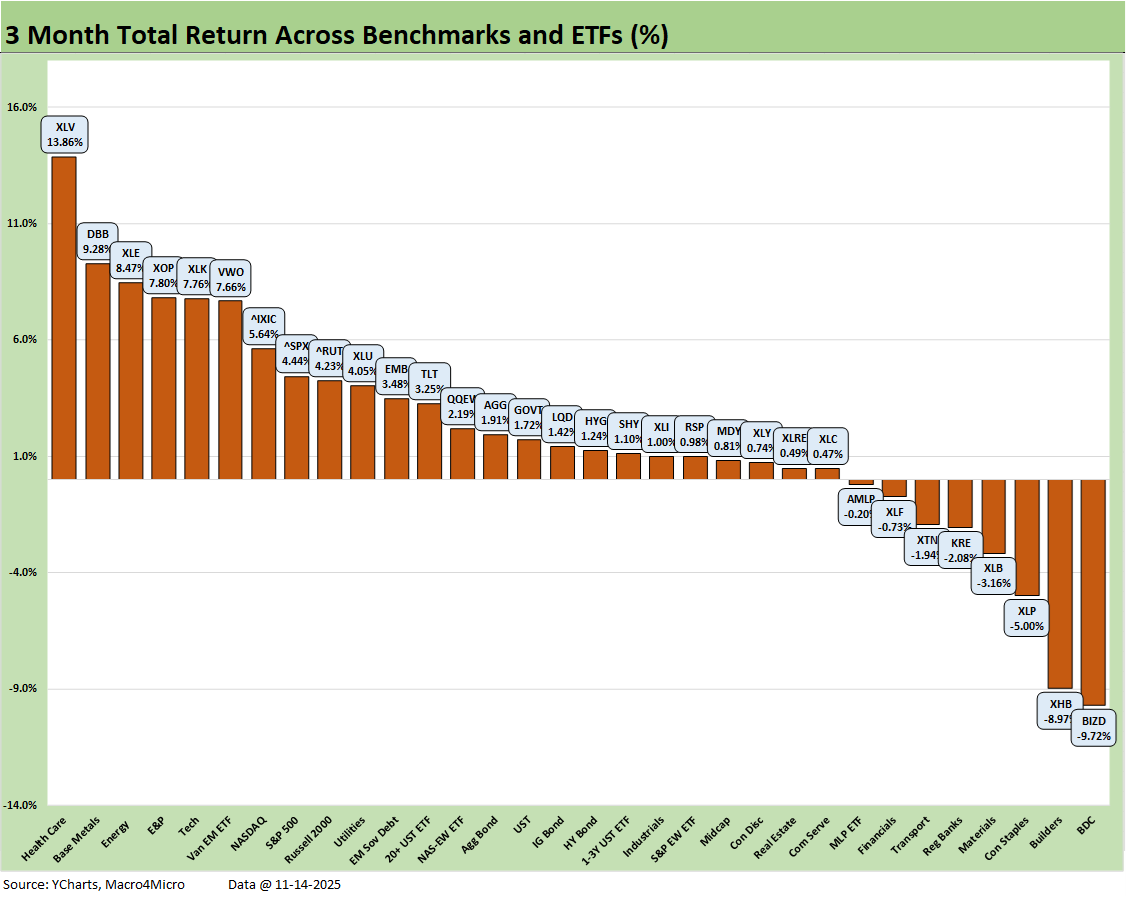
The 3-month score was 24-8 and has marked somewhat of a transition quarter with the mix of the shutdown, stubborn inflation anxiety, and bad signals around the consumer. Partly mitigating that worry were solid large cap earnings coming out of the 2Q25 reporting season and 3Q25. Small caps and small businesses are a different situation in terms of the tariff toll.
The reality is we need more macro data sets to test the cyclical color for various industries. We do not yet have the advance GDP numbers for 3Q25, and the gut check on PCE and more CPI numbers are crucial with so much misinformation loose on how tariffs even work. The sense of how working capital and corporate decision-making lag time come into play has been one more victim of a trend toward political themes taking priority over facts and concepts.
The return rankings for the 3-month horizon above highlight the concerns in private credit with BDCs (BIZD) on the bottom, the impact of stubborn mortgage rates on housing with the homebuilders (XHB), and adverse effects of a steeper curve on dividend stocks such as Consumer Staples (XLP). The fact that Financials (XLF) and Regional Banks (KRE) are in the bottom quartile is worrisome.
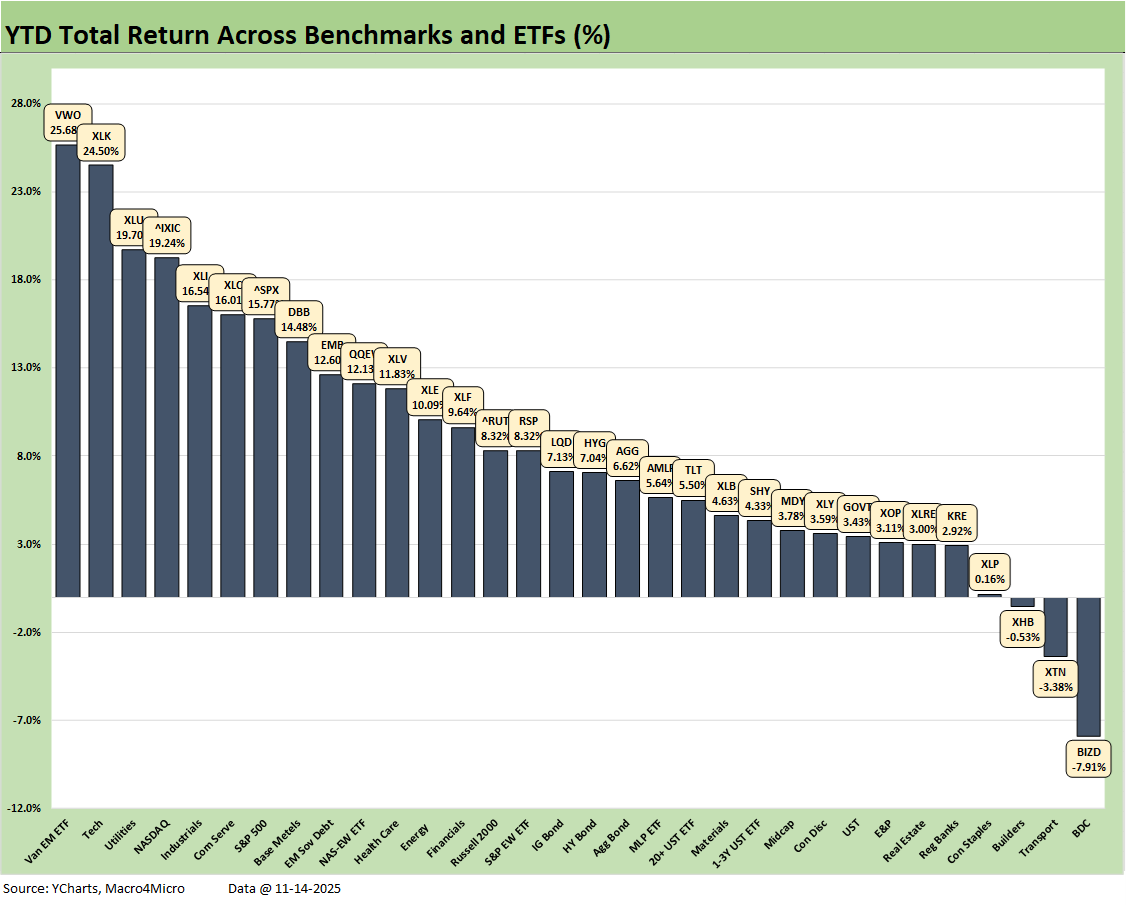
The YTD numbers remain reassuring about how 2025 will go down in the history books even if the returns limp home into year end. The score of 29-3 is certainly favorable. The bragging rights for the S&P 500 is looking glum for 2025 in the inevitable Trump vs. Biden comparison after back-to-back S&P 500 returns over 25% in 2024-2023 for the first time since the late 1990s. At +15.8% YTD 11-14-25, the equity markets will need a very strong finish to clear that bar set in 2023 and 2024.
The worst performers were set back by credit cycle fears (BIZD), interest rate pressures and UST anxiety (XHB, XLP), or tariff turmoil (XTN). The winners include tech bellwethers (XLK, NASDAQ, XLC, S&P 500) or were tied to constructive fundamentals (XLU, XLI, DBB) and in the case of VWO, the weaker dollar.
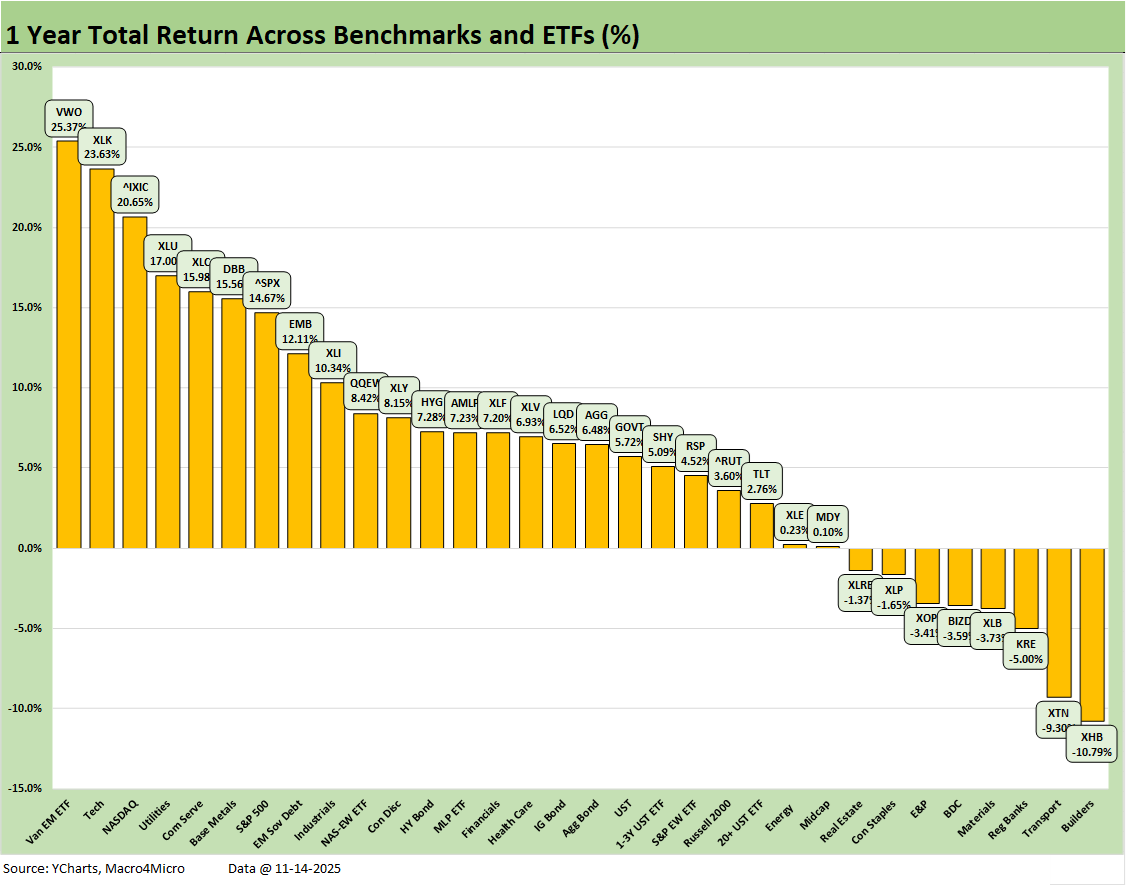
The trailing 1-year numbers post a score of 24-8 with the bottom quartile posting all negative returns. The Homebuilder ETF (XHB) was sitting in last place after taking a beating in the year after leading the LTM group rankings at the end of 3Q24. We also see Transports (XTN) in second to last on the back of a 2025 filled with tariff turmoil, disruption, and ongoing trade uncertainty. Regional Banks (KRE) have been volatile along the way and remain so on FOMC policy questions and credit cycle exposure with all the private credit headlines.
The other underperformers in the bottom quartile have more than their share of UST curve uncertainty with the dividend heavy Real Estate ETF (XLRE) and Consumer Staples (XLP). XLRE has the added element of exposure to the real estate valuation cycle often linked to interest rates and that ongoing macro debate. The current period is the first time since the early 1980s that we have a legitimate stagflation discussion underway.
The winners LTM are not all that surprising with 4 benchmarks/ETFs heavily wagged by tech (XLK, NASDAQ, XLC, S&P 500). Those are joined by Utilities (XLU), which is winning both on fundamentals and not just the usual dividend stories. EM Sovereign Debt (EMB) also made it into the top quartile as the only one of the 7 bond ETFs to make that tier. The HY ETF (HYG) is 4 slots behind EMB but in the second quartile.
Sitting on the bottom of the 7 bond ETFs is the long duration UST ETF (TLT) in the lower end of the third quartile. For those expecting an easing cycle to bring down the long end of the curve, that outcome is worth pondering and reminds us of what unfolded after the Sept 2024 and 4Q24 easing. There’s a lot more in the picture on how to handle steepening risk given record deficits and stubborn inflation.
See also:
Mini Market Lookback: Tariff Policy Shift Tells an Obvious Story 11-15-25
Retail Gasoline Prices: Biblical Power to Control Global Commodities 11-13-25
Credit Markets: Budget Armistice or GOP Victory Day? 11-12-25
Simplifying the Affordability Question 11-11-25
The Curve: Back to the Future 11-9-25
Market Commetary: Asset Returns 11-9-25
Mini Market Lookback: All that Glitters… 11-8-25
Credit Markets: Little Shop of Worries 11-3-25
Mini Market Lookback: Not Quite Magnificent Week 11-1-25
Synchrony: Credit Card Bellwether 10-30-25
Credit Markets: Call Me After Trouble Arrives 10-27-25
Market Commentary: Asset Returns 10-26-25
Existing Home Sales Sept 2025: Staying in a Tight Range 10-26-25
Mini Market Lookback: Absence of Bad News Reigns 10-25-25
CPI September 2025: Headline Up, Core Down 10-24-25
General Motors Update: Same Ride, Smooth Enough 10-23-25
Credit Markets: The Conan the Barbarian Rule 10-20-25
Mini Market Lookback: Healthy Banks, Mixed Economy, Poor Governance 10-18-25
Mini Market Lookback: Event Risk Revisited 10-11-25
Credit Profile: General Motors and GM Financial 10-9-25
Mini Market Lookback: Chess? Checkers? Set the game table on fire? 10-4-25
JOLTS Aug 2025: Tough math when “total unemployed > job openings” 9-30-25
Mini Market Lookback: Market Compartmentalization, Political Chaos 9-27-25
PCE August 2025: Very Slow Fuse 9-26-25
Durable Goods Aug 2025: Core Demand Stays Steady 9-25-25
2Q25 GDP Final Estimate: Big Upward Revision 9-25-25
New Homes Sales Aug 2025: Surprise Bounce, Revisions Ahead? 9-25-25
Mini Market Lookback: Easy Street 9-20-25
Home Starts August 2025: Bad News for Starts 9-17-25
Industrial Production Aug 2025: Capacity Utilization 9-16-25
Retail Sales Aug 2025: Resilience with Fraying Edges 9-16-25
Mini Market Lookback: Ugly Week in America, Mild in Markets 9-13-25
CPI August 2025: Slow Burn or Fleeting Adjustment? 9-11-25
PPI Aug 2025: For my next trick… 9-10-25
Mini Market Lookback: Job Trends Worst Since COVID 9-6-25