
2Q25 GDP Final Estimate: Big Upward Revision
A major upward revision in PCE drove the revision with a GDP contribution from lower imports of +5.0% still the big swing factor.


It’s all in how you look at it.
The move from 3.3% GDP growth in the second 2Q25 estimate to 3.8% in the final estimate saw a major upward revision in PCE Services consumption from +1.2% to +2.6%. Goods PCE ticked lower to +2.2% from +2.4%. The Gross Private Domestic Investment line in the final 2Q25 GDP numbers weighed in at a negative with -13.8% (no top line revision) driven by -7.5% for Structures and -5.1% in Residential.
For historical context, the final Personal Consumption Expenditure line for 2Q25 (reminder: 68% of GDP) was +2.5%. That 2.5% can be framed against the annual results of 2022 at +3.0%, 2023 at +2.6%, and 2024 at +2.9%.
If we look back across the eight quarters of 2023-2024, we see that the final PCE number of +2.5% in the 2Q25 GDP is muted. We see 6 of 8 quarters higher the prior two years ranging from 3.0% to 4.5%. 2024 posted +1.7% in 1Q24, +3.9% in 2Q24, +4.0% in 3Q24, and +3.9% in 4Q24. When we consider the PCE line of +0.6% in 1Q25 and +2.5% in 2Q25, it is safe to say the consumer has been faltering in 2025. We get a fresh PCE and Income and Outlays report tomorrow.
As we covered in the earlier GDP releases, the big distortions of scale were tied to +4.83% in net exports that include +5.0% added to GDP from lower imports. We would note that exports also declined slightly in the 2Q25 GDP line. The 2Q25 numbers include a negative GDP impact of -3.44% for a decline of private inventories. We are inclined to look at declining imports, declining inventories, and declining exports as “not a good thing.”
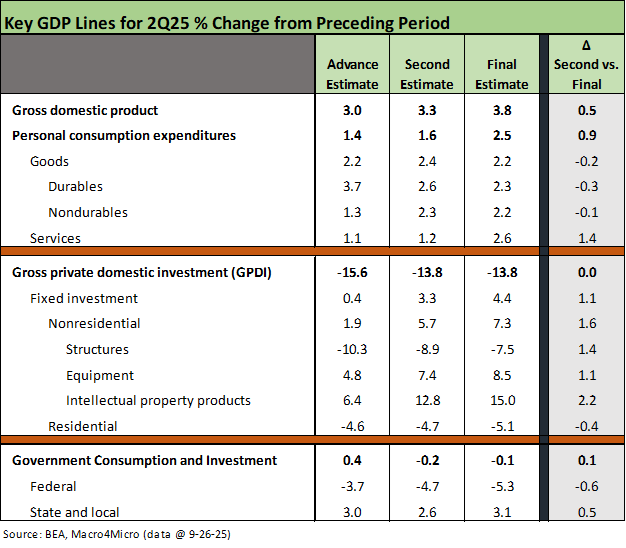
The above table breaks out some important GDP line item deltas to show the walk from the first estimate to the final 2Q25 GDP growth rate. We break out the latest delta in the right column. We see quite a few positive variances in the revisions (good for job security these days at the BLS and BEA!). The consumer showed some signs of life in 2Q25 vs. 1Q25, but remains below recent years. Goods and Durable Goods PCE getting revised down was a flag on consumer risk appetites, but PCE Services moved notably higher in the revisions.
The GPDI lines were broadly revised higher with the notable exception of Residential. That fixed investment line was the undoing of the Trump 1.0 macro story when investment weakened and exports were soft in 2019. That prompted the FOMC to ease multiple times in 2H19. That seldom shows up in dialogue around the Trump-Powell relationship.
Powell helped bail out a faltering economy in 2019 and then saved the capital markets – and notably the credit markets – from collapse and a radical liquidity crisis in March 2020. We would like to hear Bessent say anything about that very successful tag team of Powell with Mnuchin or just tip his hat for that Fed mission creep seen in 2020.
Government was soft in the latest 2Q25 print with Federal weak and State and Local solid. State and Local in the GDP accounts is around 68% bigger than Federal.

The above table updates the running GDP lines from 1Q21 across the Biden years and now into the first two quarters of Trump 2.0. When we keep hearing about how “dead” the US was before the 2025 calendar year, it is hard to look at the numbers and not highlight that 2023-2024 were the best back-to-back years for the S&P 500 since the late 1990s.
The consumer lines and PCE are the critical drivers of GDP just on the math, but the Gross Private Domestic Investment lines are very important to watch as a reality check when we hear about the investment bonanza ahead in new investment and reshoring. We hope that scenario comes to pass and that the market (that demand thing) makes project economics and related investment strategies ripe for the trillions and trillions that have been talked about. A lot of those headlines lack granularity and contractual details that would make for more believers that they are in fact “guaranteed.”
It is always good to be skeptical when the refrain from the White House is that Trump 1.0 was the “greatest economy in the history of the world.” That was repeated again at the United Nations this week. For an objective numbers check, we have broken those out in earlier periods:
Trump’s “Greatest Economy in History”: Not Even Close 3-5-25
Gut Checking Trump GDP Record 3-5-25
The consumer will hold the key to getting the PCE line back above 3.0% but the investment activity and “promises” still need to show up in Structures, Equipment, Intellectual Property, and Residential. Distinguishing the AI boom (power and data centers) from the rest of the fixed investment lines will take up more time of economists. That will make for a lot of granular detail work ahead.
GDP Commentary:
2Q25 GDP: Second Estimate, Updated Distortion Lines 8-28-25
2Q25 GDP: First Cut of Another Distorted Quarter 7-30-25
2Q25 GDP: Into the Investment Weeds 7-30-25
1Q25 GDP: Final Estimate, Consumer Fade 6-26-25
1Q25 GDP 2nd Estimate: Tariff and Courthouse Waiting Game 5-29-25
1Q25 GDP Advance Estimate: Roll Your Own Distortions 4-30-25
1Q25 GDP: Into the Investment Weeds 4-30-25
Trump’s “Greatest Economy in History”: Not Even Close 3-5-25
Gut Checking Trump GDP Record 3-5-25
Presidential GDP Dance Off: Clinton vs. Trump 7-27-24
Presidential GDP Dance Off: Reagan vs. Trump 7-27-24
2024:
4Q24 GDP: The Final Cut 3-27-25
4Q24 GDP: Inventory Liquidation Rules 1-30-25
GDP 3Q24: Final Number at +3.1% 12-19-24
2Q24 GDP: Final Estimate and Revision Deltas 9-26-24
State Unemployment: A Sum-of-the-Parts BS Detector 6-30-24
1Q24 GDP: Final Cut Moving Parts 6-27-24