
Credit Profile: General Motors and GM Financial
We look across the moving parts of GM in what is arguably the most complex auto industry backdrop in history.

The new version of GM has changed quite a bit…
We look across the range of operating and financial variables at GM including the GM Financial unit, key model volumes, and the pension/OPEB exposure. GM is still holding steady at a BBB2 composite rating.
The themes of a strong balance sheet, a liquidity hoard, very healthy cash flow, and an improving core performance in its increasingly US-centric operation and US-focused capex plan amount to good news in structural risks and operating prospects. GM Financial is a very strong performer while a much smaller GM International segment has a mixed history as China struggles.
The partial offset to the favorable financial health story is that GM is now seeing weaker profits and narrower margins from tariffs. The execution risk in repositioning capacity within North America is a fact of life as GM seeks to get it done efficiently. The intrinsic consumer cyclical risks are running alongside the need to adapt to new tariff structures that are constantly changing.
The shift in Washington policies on the ICE vs. EV trade-offs has been distinctly favorable for GM as the shelf life of its core products get extended. The emissions policies mitigate some of the other costs barraging GM in tariffs that flow into materials and supplier chains.
GM happens to hold down the #2 position in EVs, and GM has experienced very favorable EV growth in 2025 YoY ahead of the new post-tax incentive world. Those favorable EV volumes will fade from here. Diminished customer appetites for EVs can be addressed by GM through more action in shifting its structural cost plan relative to original expectations.
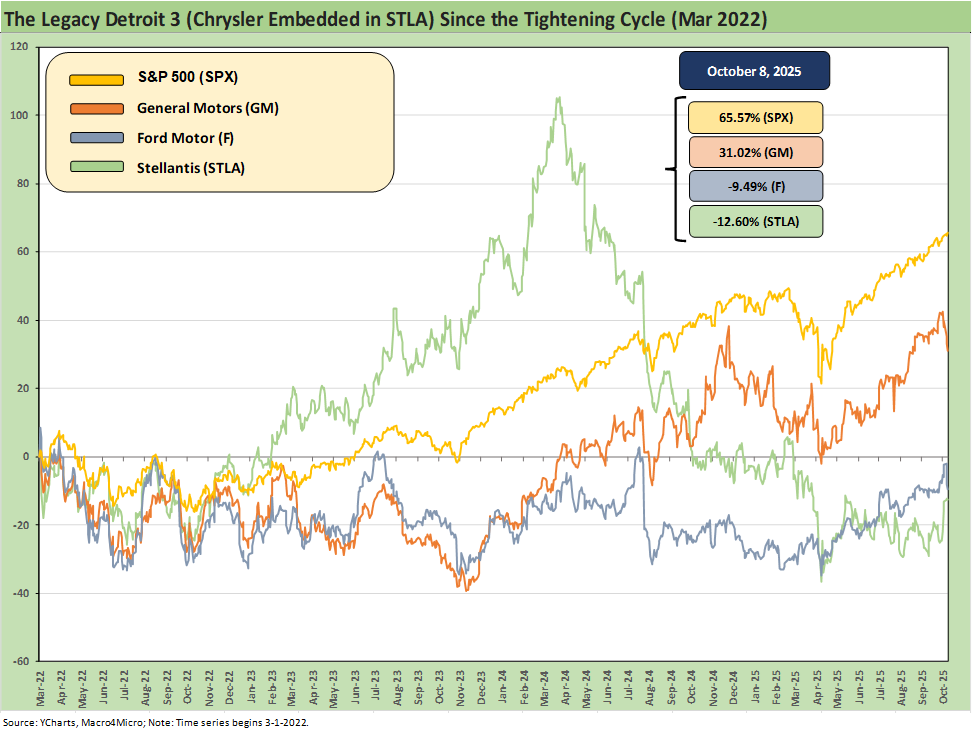
Below we get into the weeds of the GM story, but the above stock chart indicates that GM has managed to somewhat delink from the legacy Detroit 3 peers (with Chrysler rolled up into Stellantis). We are in process on Ford and Stellantis reviews as well, but there is not much mystery to the fact that GM has held up better in a period of rapid change in the auto sector.
The timeline above for stock returns starts with the March 2022 tightening cycles. GM has materially outperformed Ford and Stellantis but underperformed the tech-heavy S&P 500.
CREDIT TREND: Stable
ICE mix and GM performance trumps tariffs in GM credit story: The wave of tariffs and resulting supplier chain disruption threats to non-US assembly capacity in Mexico and Canada (notably Mexico for GM) tend to lead in the negative headlines, but the benefits of ICE leadership and GM’s light truck strengths allow the company to eat some tariffs while continuing to invest in the product plan and some core model success stories. That multiyear capex program includes material increases in US-based capacity, and that bodes well for healthier relations with Washington’s desire to dominate manufacturing investment plans. Trump and tariffs are a reality GM is dealing with. Lower earnings and margins are part of the adjustment stages.
GM is a GMNA story now: GM is distinctly profitable in GMNA with the hemorrhaging Cruise segment now folded into GMNA. GM Financial is a clearly profitable and positive contributor from a P&L and strategic standpoint. The smaller GM International segment is a modest contributor and much smaller factor in the overall GM financial and operating profile than in past cycles. Exiting the EU was a long-term positive.
Capex consistency and capacity shift underway: GM will be investing heavily in the US to expand production, and that does not bode well for Mexico operations and the USMCA auto ecosystem. GM clearly has the financial flexibility to fund such investment and can absorb any related restructuring charges from the actions. GM has already overhauled its global operations with its exit from the EU, so this is a process where GM has some history.
Tariffs assure lower earnings and margins: GM believes they can offset 30% of the tariff expenses and will continue to work with their OEM Tier 1 and 2 suppliers to adjust to the new reality. The term “work with suppliers” from major OEMs is always ominous for the supplier chain since it entails sharing costs but also can provide incentives for suppliers to invest more in the US and keep the White House powers happy. The pressure on GM profit margins is evident already and will remain a challenge, but GM’s very healthy cash flow dovetails with a strong balance sheet and no shortage of financial flexibility.
The macro picture in total volumes
Volumes drive unit costs: The constant risk factor for any major OEM is the intrinsic cyclicality of consumer durables broadly and autos specifically. The old rule of fixed costs and unit costs apply. Volume is in the denominator and high volumes can mask more than a few challenges. In GM’s case, the challenges are now lower than they would have been with Trump’s more ICE-friendly regulation playing to GM’s core strengths. Policy shifts improve GM’s ability to withstand the onslaught of tariffs. With the USMCA up for review by June 2026, that could matter even more later as GM scrambles to shift production capacity into the US with a capex program of almost $5 bn to get there over the next two years.
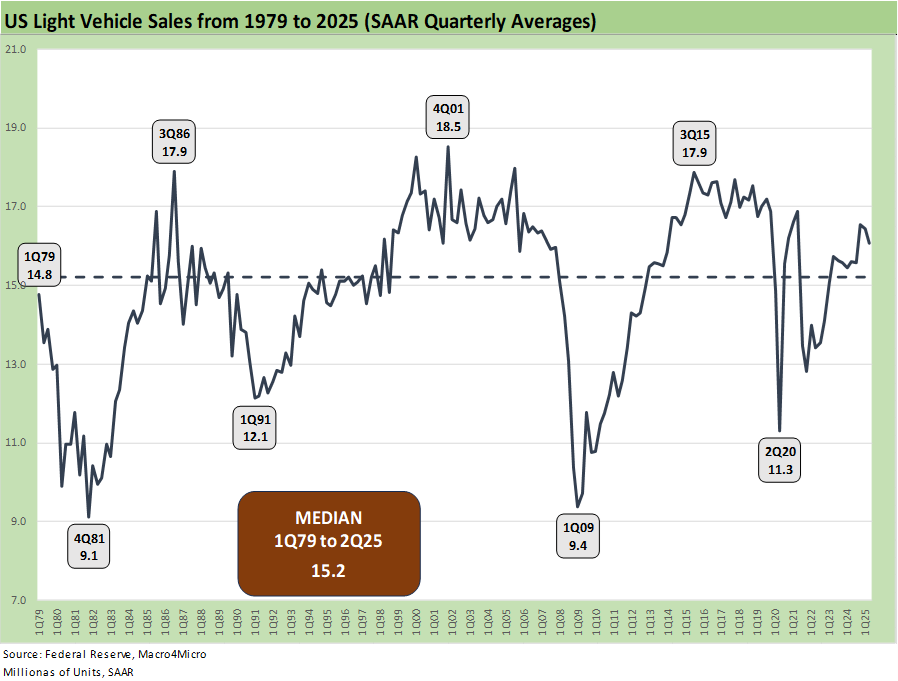
LV SAAR histories show lower highs and one hopes higher lows: Running north of 16 mn SAAR quarterly are very healthy volumes. Cyclical risks are a fact of life, but a crisis like the 2008 meltdown and 2020 COVID pandemic changed the usual rules. The chart above tracks the Light Vehicle (“LV”) sales volumes on a quarterly SAAR average through 2Q25 numbers. We chose the quarterly average SAAR above to smooth out the highs and lows seen in monthly data with “retail specials.” The time series updates the history since 1979 – a year of high inflation when the table was being set for a Chrysler bailout under Carter (with legislation and Congress involved). Then came a double-dip recession and protracted bout of stagflation in 1980-1982. The new oil price backdrop in 1979 (Iran Oil Crisis) and rapidly shifting consumer preferences on the way into a recession are histories for another time.
The current cycle is steady: We do not have the final 3Q25 LV data point yet from the Fed in the chart, but a strong summer sales season included a spike in EVs ahead of the end date for tax credits as of the end of September. As we go to print, Sept SAAR was cited around 16.4 mn. GM’s challenge is in addressing the tariff and de facto “relocation challenge” while adapting its EV mix to the new realities in a post-tax-credit world. GM also will be keeping a close eye on dealer needs to protect the connection to the consumer, and that has been the main motive behind “eating tariff costs.” In terms of the incentives to drive volume, GM has highlighted how their incentives relative to average transaction prices (“ATPs”) have been lower than the peer groups even while they are picking up market share.
Capex will remain high regardless of the cycle: The priority for GM has been articulated routinely as they seek to keep structural costs in check and consistent with their margins and mix. The “lower highs” and higher lows” in SAAR seen in the recent cycle make for a less volatile volume story and hopefully will signal decent underlying demand in 2026-2027. The expectation of lower auto financing rates is swept up in the easing and UST curve slope debate.
OPERATING PROFILE
The multi-decade downsizing…
GM has a long history of shrinking its footprint since the 40% market share days: We first started watching GM on the buyside in the early 1980s when it had a 40% handle market share in the US. That was numerous cycles, decades, and crises ago. The older guard will remember iconic names such as Pontiac and Oldsmobile among legacy brands that did not make it through the rounds of restructuring as GM saw its market share collapse over 50 years. Less iconic names such as Saturn did not last while Buick survived given its strong name recognition in China. GM is trying to rebuild that brand with a mix of China and South Korea produced models as well as a domestically produced model.
Light trucks rule the story: Chevy and GMC trucks are the cornerstone of GM financial health, revenues, cash flow and dealer support. We look at higher volume models further below in the charts and commentary. Cadillac was a legacy luxury brand that faded against the non-US luxury offerings from Germany and Japan (Lexus) but Cadillac had recently been executing on an EV strategy. Cadillac’s winners in the mix are unsurprisingly tied to luxury SUVs.
Footprint changes are not new but will now reverse: The industry evolved radically over the decades as transplants soared in manufacturing presence in the US (notably the Japan 3 and Korea 2) with luxury German nameplates among the transplants, who also reduce their political risk and currency mismatches as they built out extensive dealer and/or finance units in the US. The US OEMs had moved to low-cost global sourcing across the 1990s into the new millennium, but managing the supplier-to-OEM chain is now more complex than ever with the deluge of tariffs, the EV vs. ICE issues, and technology investment decisions (EVs, hybrids, AV plans etc.).
GM as market share leader: With a 17% handle (17.2%) market share in 2025 YTD (9-30), GM remains the #1 seller of light vehicles in total for the US across its 4 major brands: Chevrolet, GMC, Cadillac, and Buick. GM ranks ahead of Toyota at #2 and Ford at #3. The good news for GM securities holders is that GM is very healthy financially, is picking up market share in 2025 from 16.5% in FY 2024. GM leads in full size pickups and full size SUVs. GM is adding US capacity in both those segments. GM just posted record sales of crossovers in 3Q25 as well with a +16% sales gain. We look at the broader mix of models further below.
ICE vs. EV: GM boasts a very strong competitive position with its legacy ICE mix in light trucks (pickups, SUVs, crossovers), and ICE still dominates the market share mix at around 92% to 93% of US industry sales. That said, GM has moved into the #2 spot in EVs. With the revised regulatory climate under Trump, GM seeks to fashion the optimal cost structure and investment profile for an EV sector that is running well short of the original expectations under the Biden policies. The embrace of the term “natural demand” for EVs comes up a lot. It will now get put to the test.
Political risk as a variable now runs alongside supplier chain challenges: Tariffs as a policy cannot be directly controlled by the OEMs, but they have the added risk of unpredictability. Even this past week, there was a lot of commentary that tariff pressures and supplier chain risks will get some relief for those assembling here. There were no details. Supplier chain financial stress risk is not a new feature, but the underlying causes are different now.
FINANCIAL TRENDS
Exceptional asset protection and liquidity: The scale of GM’s asset base, the massive run rates on automotive EBIT even with the tariff cost pressure, the reality of automotive cash in excess of debt, the steady and reliable earnings and dividend flows from GM Financial with its strong asset quality are major positive factors. A detailed and manageable product cycle plan and notably over 2026-2027 makes a very strong case for credit quality and cash flow predictability. The 2028 variables will include major questions of who runs in the election and what their tariff views will be given the recent process of all tariff policies emanating from the White House (not Congress).
Model cycles and cyclical uncertainty are built into expectations: Model cycles ending or fading still make for a steady overall financial profile at GM. The well-established ICE product strengths of GM are undeniable and notably in light trucks. GM has sustained a lead in numerous product segments, and the competition has not been able to crack such anchors as large pickups and large SUVs. The “labor arb” factor in pricing vehicles is being worked out of the system. There are some segments where GM and Ford both have faded (luxury vehicles and cars generally). GM’s performance in EVs was impressive in its product dexterity and allows for some optimism around its efforts to tackle new technologies such as AVs. On the other hand, the Cruise segment was a flop and was folded into GMNA.
Legacy liabilities (Pensions and OPEB) are very manageable: We address the pension and OPEB legacy liabilities and funding process further below, but the new GM created separately from the Chapter 11 entity is a very different beast than the pre-2009 version. We see salaried defined pension plans frozen (no more accruals, shift to defined contribution) and the hourly worker defined benefit plan closed (no new members). The recurring funding needs are disclosed and manageable. The funding and cash flow demands will gradually wind down with the forces of nature and the actuarial tables (“death and taxes,” etc.).
OPERATING RESULTS
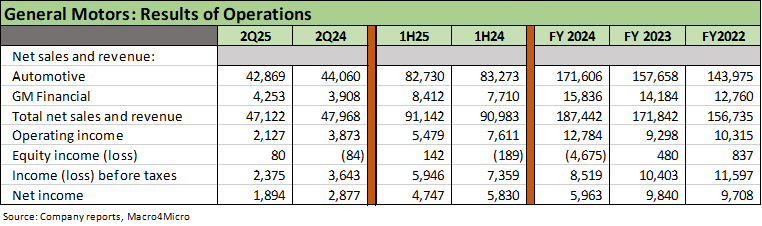
2025 profit trends are tailing off: The above table highlights the headline numbers with revenue and operating income declining in 2Q25 YoY and 1H25 YoY after a solid stretch from 2022 to 2024 despite higher interest rates, higher prices, and diminished affordability. Much is going right for GM with Average Transaction Prices (“ATPs”) of more than $51K in 1Q25 and 1H25 vs. $50K in FY 2024. GM outperformed the industry in growth. GM is #2 in EV sales across a range of product segments and price tiers with a game plan to stay in the EV battle with a right-sized and diverse mix.
Consolidated EBIT margin compression: We look at the segment history below, but the adjusted EBIT margin declined to 6.4% in 2Q25 from 9.3% in 2Q24 after 1Q25 posted a decline to 7.9% from 9.0%. The FY 2024 EBIT margin was +8.0%, which rose from 7.2% in FY 2023. The tariffs are having a logical negative effect in 2025 which will continue into 2026.
Guidance calls for lower margins on tariffs and volume: The new FY 2025 guidance range with 2Q25 numbers calls for adjusted EBIT is $10.0 to $12.5 bn ($11.25 bn mid). Free cash flow guidance is in the $7.5 bn to $10.0 bn range with $10.0 to $11.0 billion in capex plans including the battery JV. That is a healthy forecast considering the tariff headwinds, but the forecasted results are well down from the $13.7 bn to $15.7 billion estimate for 2025 that was presented with 4Q24 earnings. Tariffs have made a big and negative difference, but the Trump policies on ICE has supported GM’s core strengths.
Segment guidance is solid: With the latest FY 2025 guidance after 2Q25, GMNA pricing was expected to be slightly higher, GMI “ex-China” will be “similar to 2024,” and GM Financial EBT is guided to the $2.5 to $3.0 billion range.
Tariff costs are expected to be in the $4 bn to $5 bn range: The company expects to recover 30% of tariff costs with the remainder a mixed picture subject to other cost mitigation actions, supplier chain discussions, and uncertainty around the trade partner “deals” being finalized and related contingent risk scenarios that would come with those deals breaking down.
SEGMENT RESULTS
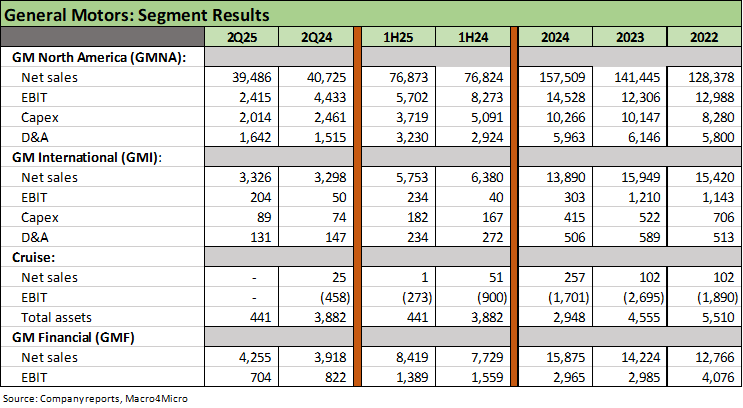
GMNA 2Q25 EBIT weaker, margins softer: There is no hiding from the tariff expense with higher tariff costs than in 1H25 assured in 2H25. GMNA EBIT margins at 6.1% in 2Q25 vs. 10.9% in 2Q24 tell a clear story on the trend. Painful tariffs are now a fact of life that encourage relocation of production and a focus on supplier chains. GM believes it can offset 30% of the total tariff cost in 2025. Average transaction prices at $51K included lower incentives as a % of ATP with 2Q25 2 points below the industry average. Picking up market share (to 17.4% in 2Q25) with volumes higher and pricing favorable was the 2Q25 takeaway.
Favorable GMNA volume trends: We see GM posting favorable variances in 2025 with volume higher across all brands with 2Q25 retail sales at +10% and 1H25 retail sales at +12%. GM was the leader in truck sales again with record crossover sales at +16% in 2Q25 and +23% in 1H25. EV sales share hit +15.8% in 2Q25 after +10.4% in 1Q25 – both substantially higher YoY. Chevy ranked #2 in EV sales and Cadillac #5 in total EV volumes. The recent 3Q25 sales volumes released last week were also quite solid. GM US deliveries were reported at +7.7% for 3Q25 and 3Q25 YTD at +10.3%. Chevrolet was +8.3% for 3Q25 and +9.0% for 3Q25 YTD volumes. GMC was +8.6% for 3Q25 and +10.3% YTD. Chevrolet and GMC are the two major brands, accounting for almost 88% of GM 3Q25 volumes. Cadillac rose by 25% in 3Q25 and 19.4% 3Q25 YTD. Overall, GM posted its best market share since 2017 in 3Q25 and the best YTD market share since 2015.
GM International Operations (“GMI”): International trends have changed dramatically over the past decade with the exit from EU and numerous regions. From here, GMI will be mostly about China sales and JV activity. GM has material market share in Brazil (10.0% in 1H25, down from 12.3% in 1H24). China share was flat YoY at 7.2% in 1H25 (7.1% 1H24). China has been a challenge for GM given competitive conditions and market struggles detailed in the 10-K. GM’s China JV generated $4.4 billion equity losses in 2024 which included restructuring charges of $2.1 billion for impairment of the equity interests and another $2.0 bn for implementation of the restructuring plan. Back when GM’s IPO was leading to a lot of outsized sum-of-the-parts valuation by the street, China was assigned values at a very high multiple that helped pad the target price. Those days are over – at least for the foreseeable future.
GMI looks very different than a decade ago: As discussed earlier, GM’s history as one of the European Big 6 is a distant memory as are the GM-owned Opel and Vauxhall brands that were sold to PSA and now roll up into Stellantis. GM also has downsized and discontinued much of its Southeast Asia based operations, wound down Holden in Aus/NZ operations, and exited India.
GM Financial (“GMF”): GM has built up a very solidly profitable and captive unit as the company looked to rebuild something like the “old GMAC.” The acquisition of AmeriCredit in 2010 set GM on the course of rebuilding the finance unit (see History and Highlights further below). GMF now has a much larger earning asset base with favorable asset quality metrics as detailed below. For some context on the rate of growth since restarting its captive finance rebuilding, GMF has grown from $9.2 billion in net receivables in 2011 to almost $92 bn at 2Q25 (excludes leasing assets).
Cruise folded into GMNA for 2025: For segment reporting, we include some of the old disclosure above that includes Cruise, which has now been folded into the GM North America segment (“GMNA”). GM changed its strategies around Cruise from an AV Robotaxi effort to an AV project for personal vehicles. The rationale was that robotaxi initiatives would be too capex intensive and undermine capital efficiency. The theory is the integration with the GM Super Cruise technology investments and ADAS could generate synergies with the AV effort (assisted driving tech meets autonomous). As evident in the segment results above, Cruise was a massive headwind for earnings, and the decision to exit is a net positive for earnings, cash flow, and capital efficiency.
CASH FLOW LINES
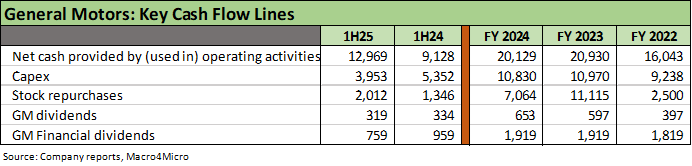
Meeting the capex demands: The key cash flow lines above highlight the cash flow strengths of GM as the company maintains a higher rate of capex to meet product initiatives and the plan to expand US capacity. The US capex plan includes a priority of bringing back light truck, SUV, and crossover capacity to the US and scaling back in Mexico and Canada. The 2026 review of the USMCA will keep those stakes high.
Capital allocation: The ability to return cash to shareholders has been reiterated, and the number above highlights that buyback numbers can swing dramatically subject to operating results and core business priorities. GM’s CFO indicated in a recent presentation that GM had bought back 30% of shares outstanding over the past 3 years.
GM Financial dividends: The chart above highlights the steady upstreaming of dividends from GM Financial of just under $2 bn each year since 2022. That is a healthy add-on to the free cash flow generation from the core auto manufacturing operations.
AUTOMOTIVE CASH AND DEBT
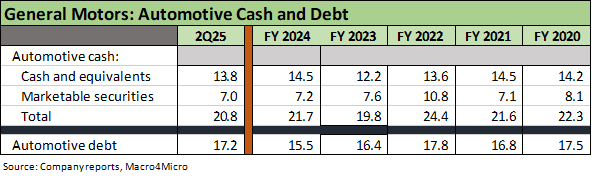
Cash flow and liquidity resilience is clear in recent history: The above table highlights the impressive base of cash flow and balance sheet liquidity with automotive cash in excess of automotive debt. The ability of GM to manage its liquidity is evident in the table above across a timeline that includes a pandemic, an inflation spike and tightening cycle, massive capex, and cumulative stock buybacks of almost $23 billion from 2022 to 1H25.
GM: Pension and OPEB
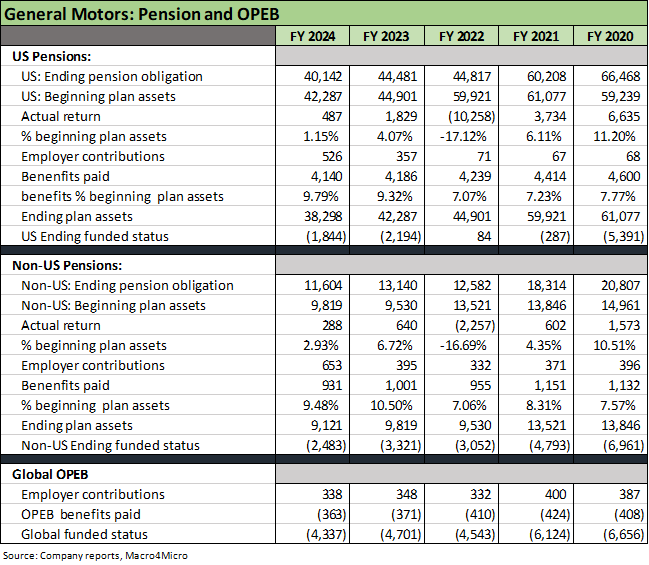
Pension and OPEB quite manageable in the context of funding needs: The above chart details the underfunded position of GM in defined benefit (“DB”) pension and other postemployment benefits (“OPEB”). Pensions and OPEB have always been contentious topics with the UAW and a financial headwind in “old GM” before the 2009 bankruptcy and creation of a separate “new GM.” The Section 363 sale to the new entity included the transfer of pensions and OPEB to the new GM. OPEB is overwhelmingly about health care.
The DB US hourly plan is the main event: The US DB plan obligation is 3.5x the remaining non-US projected benefit obligation, and US plan assets were around 4x the non-US plan asset level. ERISA rules are much more onerous, and there is always the chance the UAW will seek to open those plans again. The US DB hourly plan covers employees hired prior to October 2007 and for Canadians hired before Oct 2016. Salaried plans have shifted to defined contribution, and many salaried DB obligations were offloaded in pension risk transfer transactions (purchase of annuities). The salaried plan is “frozen” (no more accruals) while the hourly plan is “closed” (no new additions). Hourly workers will keep trying to restore DB benefits in future contract rounds, but GM will say “no” or pay a price in the market and in competitive costs. GM got past the latest round by increasing payments to retirees and eligible retirees and active plan members.
GM Non-US DB obligations include legacy Opel and Vauxhall: Part of the cost of the EU exit by GM included taking on most of the legacy pension obligations. The legacy liabilities will remain a drag on the adjusted balance sheet. We do not consider the overall pension exposure in the US or non-US side as major risks at this point. Those liabilities can be managed with steady contributions and decent asset returns, but the natural actuarial course of life expectancy will gradually run down the pension obligations.
OPEB is contract risk, pensions are debt risk: We have often written about pensions and OPEB over the years after years of covering the autos and airlines (always an adventure) and the color to assign is “grey” on the debt-like vs. contract-like nature of DB plans vs. OPEB. There has been no shortage of bankruptcies that offer up a lot of data points. A simplistic generalization in many of the bankruptcies across the cycles is that pension plans and health care plans get rolled into the post-emerged entity with salaried plans much more vulnerable to a freeze (pensions) or elimination (OPEB).
The wide array of legal issues needs to be looked at on a case-by-case basis with collective bargaining agreements having a bigger seat at the table. That is separate from the Section 1113 provisions in collective bargaining Section 1114 on retiree benefits. That is a broader topic for another day, but those are rarely triggered given the scale of damage they do to the estate and going concern potential. That is especially when the unionized hourly workers could react with crippling strikes.
Historically, recovery rate estimates often get manipulated by the “axed” who inflate the haircut on unsecured debt tied to pensions and OPEB. ERISA statutory clout is a major overriding factor. The battle around how to treat pensions and OPEB in recovery estimates is an old debate and the same with how to frame it in valuation metrics (see bullet below). When the US OEMs were in serious trouble, the claims risk handicapping was part of the exercise.
Pension plan “drain rates”: The above chart breaks out the usual metrics on obligations, assets and returns, but we also like to look at the benefit payout rate. We sometimes call it the portfolio drain rate (“benefit payments % plan assets”) since that bill is due each year to retirees. That cash drain rate must factor into asset allocation decisions (debt vs. equities, coupon income, etc.) and need to be prudently managed. The obligation math and actuarial science (arts?) of course matter, but “cash in, cash out” is more intuitive. An easier and more objective and assumption free question answers this question “What was my actual return last year vs. what I paid out in benefits?” Given the maturity of the pension plans and retiree base for a company such as GM, credit allocations have been very attractive with a higher coupon serving as a helpful offset.
Funding demands are the main topic whether mandatory or discretionary: For 2024, GM’s US DB plan paid out around 9.8% (benefit payment % beginning plan assets) after 9.3% in 2023. We see 7% handles across 2020-2022. That is a big cash payout each year. If we look back over the past 5 years for the US plans, we only see 1 year (2020) when returns exceed payout rates. That is where additional contributions can come in. For the US plan over the past 3 years, the contributions to the US plan were $526 million (2024), $357 mn (2023) and $71 mn (2022). The contribution for 2025 is expected to be “insignificant.” For non-US plans, the contributions were $653 mn (2024), $395 mn (2023) and $332 mn (2022). Non-US plan contributions are expected to be up to $125 million in 2025.
Pensions and OPEB in valuation: The use of EBITDA vs. EBITDAP or EBITDAPO in EV math and adjusted EV multiples get tossed around a lot but in the end most analysis reverts back to EV/EBITDA and P/E multiples. With so many wild rides across the cycles and major automotive sector stress and bankruptcies, most of the scenarios have been tested.
Adjusted EV multiples can occasionally make a material difference across industry peers such as when Delphi was emerging from Chapter 11 “pension free” and was going to be valued in the context of numerous suppliers with pension and OPEB exposure. Delphi was a unique story as it got swept up in the GM obligations and bailout working with the UAW and a very UAW friendly group of bailout architects.
Don’t let the GAAP accounting get you down: The assumption-driven accounting for legacy benefits and the related lingo and nuances of ERISA vs. GAAP can seem daunting. The assumed plan asset returns (essentially a contra-expense line in GAAP pension expense) gets into quality of earnings questions (do they inflate expected returns relative to the asset allocation mix?). The changes in how discount rates are applied for obligation math (ERISA or GAAP) are important in the “objective” measurement process, but ERISA always trumps GAAP. The GAAP math can be a distraction at times, and that was especially the case across the ZIRP years when ERISA-based measurement and legislative relief on discount rates was the main event (relief which they in fact routinely received).
A good working assumption is that minimum funding requirements can swing across the cycles with ERISA rules as the main focus that flows into statutory minimum funding requirements and cash flow demands. Discourse disclosure has improved over the years.
GM FINANCIAL: BALANCE SHEET HIGHLIGHTS
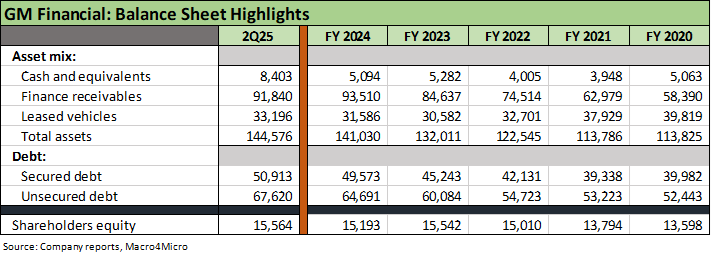
Slow and steady growth in the GMF asset base: As noted earlier, a 10-fold increase in net finance receivables since the acquisition of AmeriCredit (see History and Highlights below) and growth in the recurring customer base is the bulk of the GMF story. GMF brings both strategic value in the core GMNA operations and is very supportive of retail customers and dealers. We covered the segment earnings story earlier.
Impressive profitability, high quality and liquid assets: The dividend flow upstream to the parent leaves GM well positioned to deal with a range of potential cyclical outcomes. We look at the asset quality in the next table, and the liquid nature of the assets (securitization, liquidation) as demonstrated across an unusual cycle (i.e. a pandemic, inflation spike, tightening cycle, and affordability challenges).
Support Agreement- Leverage Ratio: GMF’s support agreements and leverage requirements are broken out on the 10-K. “Our earning assets leverage ratio, calculated in accordance with the terms of the support agreement with GM (the Support Agreement), was 9.24x and 8.32x at December 31, 2024 and 2023, and the applicable leverage ratio threshold was 12.00x. In determining our earning assets leverage ratio (net earning assets divided by adjusted equity) under the Support Agreement, net earning assets means our finance receivables, net, plus leased vehicles, net, and adjusted equity means our equity, net of goodwill and inclusive of outstanding junior subordinated debt, as each may be adjusted for derivative accounting.”
Support agreement with GM: GMF is a critical unit in the GM family given its importance to dealers and customers. The support agreement is strong one as detailed in the 10-K: “… If our earning assets leverage ratio at the end of any calendar quarter exceeds the applicable threshold set in the Support Agreement, we may require GM to provide funding sufficient to bring our earning assets leverage ratio within the applicable threshold. In determining our earning assets leverage ratio (net earning assets divided by adjusted equity) under the Support Agreement, net earning assets means our finance receivables, net, plus leased vehicles, net, and adjusted equity means our equity, net of goodwill and inclusive of outstanding junior subordinated debt, as each may be adjusted for derivative accounting.”
“Additionally, the Support Agreement provides that GM will own all of our outstanding voting shares as long as we have any unsecured debt securities outstanding. GM also agrees to certain provisions in the Support Agreement intended to ensure we maintain adequate access to liquidity. Pursuant to these provisions, GM provides us with a $1.0 billion junior subordinated unsecured intercompany revolving credit facility, and GM will use commercially reasonable efforts to ensure that we will continue to be designated as a subsidiary borrower under GM’s corporate revolving credit facilities.”
GM FINANCIAL ASSET QUALITY
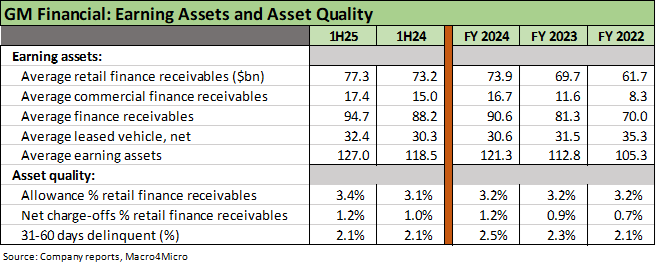
Growth in earning asset base: Steady growth in receivables across retail customers and dealers is a good sign. Monitoring reserve adequacy, delinquencies, and charge-offs is a standard process each quarter. Leasing exposure is material and watching residual value trends in the used vehicle market is a core part of framing asset risks and “repossession losses.” The next stage of dealer needs around used vehicles and EV residuals will get more focus in the quarters ahead as the tax credits have ended and the natural demand for EVs become a hot topic.
Allowance comfortably above net charge-off: The allowance cushion in the table remains at a multiple of charge-offs with plenty of cushion for setbacks in the event of an adverse turn in the cycle and employment weakness. The market is increasingly focused on a more sustained erosion of auto retail receivables credit quality with payrolls softening and pressure on a major subset of the consumer spectrum. Health care cost shocks and less friendly mortgage rates north of 6% won’t help the trends in consumer credit and monthly payment burdens.
Growth in “prime” receivables share by GMF over the cycle: The quality of customer credit has risen since 2020 with the prime FICO share (680 or higher) up to 76% at 2Q25 vs. 64% in 2020. The near-prime mix is 12% (620 to 679) at 2Q25 vs. 15.4% in 2020 while subprime (less than 620) is down to 12.0% in 2Q25 vs. almost 21% in 2020.
GM: RETAIL SALES VOLUMES
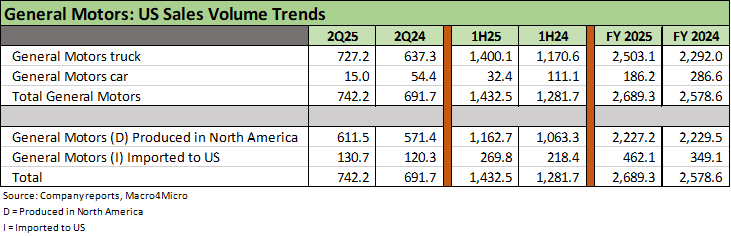
GM is about light trucks: The above chart breaks out the GM mix and volume trends for 2Q25 and 1H25 vs. the prior year (source: Automotive News). The categorization of light trucks includes pickups, SUVs, and crossovers, so the small slice of “cars” is now more one of convention (and some regulatory and trade nuances) than one of utility when they are all overwhelmingly passenger and/or fleet vehicles with some blurring into commercial use in the larger pickup categories. We use the 2Q25 numbers above to match up with the fiscal reporting periods in hand so far. GM 3Q25 earnings will be released later this month (10-21-25). We will update the 3Q25 data at that time. We update 3Q25 volumes below.
Results are about volume, price, and mix: GM delivers an exceptional amount of detail in its quarterly reports and related slides. For those new to tracking autos, we recommend Auto News for an industry practitioners’ perspective without the “EPS spin.” Reading the Detroit News that posts auto coverage every day is also helpful. The Cox Automotive products are excellent for data and trends. These people eat, drink, and sleep autos. The details on EVs and dealer trends are especially helpful, and there is no shortage of information in what Auto News provides including extensive sales and production stats each month with an array of content and data offerings.
3Q25 keeps posting strong growth: GM released 3Q25 and YTD 3Q25 volumes in the middle of last week (10-1-25). Volumes remained quite strong in 3Q25 with GM holding down its market share lead with “ICE market share” at 17.4%. GM’s 3Q25 unit sale posted +7.7% in US vehicle sales and weighed in at +10.3% YTD. The calendar YTD share of 17.2% was cited as the best since 2015.
The favorable volume variance again has GM outperforming the large OEM peer group. Chevrolet was +8.3% in 3Q25 and +9.0% YTD. Cadillac was +25.0% in 3Q25 on the back of good EV results from new luxury EVs. Those increases come with the asterisk of a banner period for EV’s looking to get in under the wire on the expiration of the $7500 tax credit. GMC is the second largest GM brand well ahead of Cadillac and Buick , and GMC posted +8.6% units in 3Q25 and +10.3% YTD.
GM picking up market share with its strong position in light trucks and ICE: GM will spend $4 bn to $5 bn on expanding US capacity over the next two years. The mix of products underscores the benefits of easing emission standards and major cost savings on the rate of “buying credits” to mitigate the heavy fleet mix of light trucks (notably large pickups and large SUVs).
GM has climbed to #2 in EV share and posted records in 2025: GM’s bragging rights is that it is #2 in EVs as a way of showing its commitment to the space with its 12 EV models. Chevrolet is the #2 EV brand and Cadillac is the #5 EV brand. GM wants also to show that it hits what it aims at these days in product planning. No company was more active in making its case for traditional ICE vehicles and challenging emissions rules than GM, but it also can make a claim that it shifted with the rules and was executing in its EV product program.
ICE now trumps EV planning for GM: Cadillac and Buick were both targeted to be 100% EV by 2030. That is not happening. EVs are only 7% to 8% of the market, so the main event – notably for GM – is still all about ICE. On that score, Trump has been helpful to GM by lowering barriers to growing and sustaining GM’s very successful ICE business.
“Executing” in EVs still meant losing money: Expending capital in a space where demand was well short of the regulatory ambitions has changed planning. GM has stated that the company will scale the EV operations to better match up with natural consumer demand. With respect to EVs, GM stated after 1Q25 that “50% of our entries were variable profit positive.” In a high-fixed-cost business, that only gets you so far, but with so many OEMs suspending, downsizing, or canceling EV plans for different models, the GM planning at least hedges EV bets and political risks in future elections. The new low-cost Bolt EV will be out later this year as a 2026 model, and that will be an affordable model that would “barbell” the mix with the Cadillac planning.
The relocation and sourcing challenge: The shifts across product and model line items in sales and production (and where the production takes place) will get very interesting from here with the capacity relocation planning and the mix of import changes for GM (from Mexico, Canada, South Korea and China). The tariff terms keep on shifting with more potential changes underway including more supplier chain and OEM tariff changes being floated the past week (not specific yet). Autos are one of the biggest end markets for semiconductors, so there is plenty of drama ahead along the electronics chain. The USMCA is also up for review by June 2026, and it is hard to use rational economics as a guide for what will unfold. That negotiation could bring fresh uncertainty and even potential termination.
GM: KEY MODELS CHEVROLET AND GMC TRUCKS
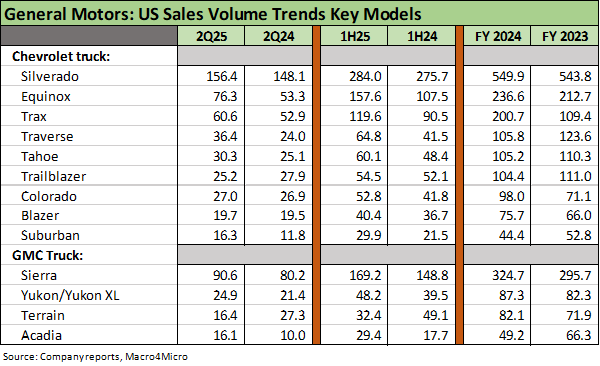
Trucks rule with pickups, SUVs, and crossovers: The lead themes around GM’s operating strategy on the product side as we wind down 2025 is to leverage the exceptionally strong ICE operations. The volume variances above tell a favorable story for GM through 2Q25. That continued into 3Q25, but we will break out those 3Q25 model details later. We summarized the latest 3Q25 volume trends above. These light truck models above have benefitted from the Trump policy of dialing back EVs and emissions and fleet rules and clearly extending the life of the most profitable and successful GM ICE platforms and model segments.
GM is the leader of the legacy ICE carmakers (i.e. ex-Tesla) in EV share: GM has an EV strategy to target a low-cost EV with a Bolt redesign while also tapping luxury EV demand through its Cadillac brand. Cadillac has struggled against the Germans and Lexus in ICE vehicles, so the luxury EV plan has resonated. “Caddy” EVs could offer viable alternatives to the growing ranks of Musk haters. That strategy calls for GM to be well positioned in EVs at the right mix and cost structure. EVs remain unprofitable after fully allocated costs. GM tells a good story about balancing future ICE and EV volumes (and hybrids) and investing in manufacturing flexibility to produce ICE or EV at some of the same plants.
GM: KEY MODELS: BUICK, CADILLAC, CHEVROLET CARS
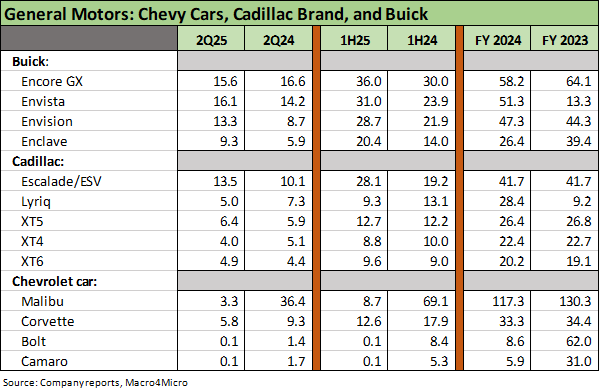
Buick, Cadillac, and Chevrolet Cars still in the game: GM earnings and cash flow are tied to GM showing so much success in pickups, SUVs and crossovers, so it is sometimes easy to forget the models that are categorized as “cars” in the trade literature. The luxury Cadillac brand has strengths in luxury SUVs and EVs while the handful of Chevrolet cars are also detailed in the table with venerable names such as Camaro and Corvette. The Camaro has been discontinued while the Corvette is slated for a redesign in 2029. The Chevy Bolt is expected to be a high volume replacement for the Malibu as it also tackles the lower price EV segment.
Cadillac remains a work in process: The Cadillac brand had struggled over the years against the luxury powerhouses of BMW, Mercedes, Lexus, and Audi having so much success over the cycles (some more than others). The Escalade at GM is part of its large SUV domination while the LYRIQ is a luxury SUV EV. The XT5 is a luxury SUV that was going to “go away” in the shift to all EV, but that plan is under review with EV vs. ICE decisions. The Cadillac XT4, which is a luxury subcompact crossover, is being phased out to make room for production of the Bolt at the Fairfax Kansas plant. The Malibu was also phased out already with the Bolt in theory set to fill in the void.
The “other” vehicle lines: The above table updates some recent volume trends across models under the Buick, Cadillac and Chevrolet brands with Cadillac tackling EVs and Buick facing high tariffs for its subset of Asian-produced vehicle lines. The overall mix is going through a material amount of change since this past cycle as select models age, get phased out, or prepare for redesigns and final decisions on ICE vs. EV mix in the overall portfolio. The legacy Malibu line (midsize sedan) has been discontinued after a long run for that name (decades) in the latest sign of the death of the ICE sedan.
Buick a challenge: With models produced across 3 countries (South Korea, China, and the US), Buick has its work cut out for it in US end markets. The Enclave is the only US made product with the Encore in South Korea, the Envista in South Korea, and the Envision in China. For 3Q25, the Buick models saw a -14.0% decline but with a +14.3% YTD increase. The big increase in 3Q25 was the US-made Enclave with major declines in 3Q25 for the Korean-made Encore (-38% 3Q25) and the China-made Envision (-35% 3Q25).
History and Highlights:
Old GM vs. New GM: The current General Motors is a corporate entity that was created in 2009 out the rather convoluted Chapter 11 process and complex restructuring (Chapter 11 to Section 363 sale, etc.). The legacy GM went into liquidation under the name Motors Liquidation. That process is a long and tortuous story and includes the bailout politics and economics. The substance of the “new GM” creation is that the assets and many liabilities moved over to the new GM (contractual relationships, collective barging agreements, pensions, OPEB, etc.). Even the NOLs were moved over by separate legislative action. Then the New GM moved on from the crisis and put the longest recession in the postwar history in the rear-view mirror.
The “New GM” did an IPO in Nov 2010: The transaction generated around $18 billion in common and $5 billion in preferred. The US Treasury received around $13.5 billion from the IPO. The government of Canada and Ontario and the UAW retiree health care trust also sold shares.
GM separates supplier operations to lower fixed costs: Among the numerous adventures in restructuring GM’s fixed cost base in past cycles was the spinoff of the massive Delphi component operations into a separate entity in 1999. The Delphi history is a long story, but Delphi filed Chapter 11 in October 2005 and was mired in a protracted bankruptcy that was swept up in the auto crisis including GM’s Chapter 11. Delphi has given rise to multiple supplier entities since then (a story for another day). Ford went through a similar process with the spin-off of its supplier chain operations under the name Visteon, which was soon bailed out by Ford on the way to Chapter 11 for Visteon in May 2009.
GM exits Europe: Among the most notable operating changes since 2009 was the radical downsizing of GM’s international operations and exit from Europe with the sale of Opel and Vauxhall to PSA in 2017. That was on the path to PSA becoming Stellantis in the PSA merger with Fiat, who for its part had taken over Chrysler in a complex set of transactions (Section 363 sale, etc.) in the Chrysler Chapter 11 of 2009.
GM and Ford nonfactors in the EU: The consolidation of mass volume producers in Europe saw US operators dramatically downsized with Ford a shadow of its past with a 3% handle market share in 2024. GM’s exit from the EU over the recent cycles is a positive factor in its credit quality, capital efficiency, and strategic focus.
GM creates a new captive finance company: Another radical change in the GM mix from its distressed and Chapter 11 years was the separation of GMAC from the auto company in a series of transactions that ended with the GMAC-to-Ally separated. For GM, the next stage of recovery was the buildout of a new captive finance capability in what today is General Motors Financial (“GMF”). GMF has grown since the acquisition of AmeriCredit announced in 2010 for $3.5 billion. AmeriCredit was a finance operator with a strategic focus on nonprime and subprime, but GMF has grown dramatically since then and morphed into a full-service captive finance operator with strong asset quality and steady growth (detailed above).