
Credit Markets: Little Shop of Worries 11-3-25
High level calm belies some problems that could worsen on bad policy and political dysfunction as reflected in the shutdown.


Consumers and small biz need to be fed…
The market remains unflappable as AI is all about forward valuation (not revenue models that will be tested anytime soon), trade wars are avoided, the bank system is healthy, and mid-to-high consumer credit tiers remain solid.
The absence of macro data in the shutdown continues to give an “out of sight, out of mind” element to payrolls and manufacturing’s tepid state on soaring input costs. Some worries are brewing from the top down over risk-reward symmetry at compressed credit spreads, equity valuations at levels more like the late 1990s, untested supply-demand dynamics for the UST curve, and tariff tail risk that many want to pretend is no longer a threat to pricing, earnings, and payrolls (tariff cost mitigation).
Asset returns were mixed at best this week, the yield curve was unfriendly, and the policy noise remained high in health care and food supply for millions. The record shutdown has created an information vacuum, but risks of Fed independence and the steady drumbeat of tariff impacts could sneak up on investors during late year outlook season (see The Curve: Macro Data MIA? Policy Prudence KIA? 11-3-25, Market Commentary: Asset Returns 11-2-25).
The week ending on Halloween saw a mild post-rebalancing widening of spreads in IG and HY with YTD HY OAS barely wider (+2 bps) and IG -2 bps tighter YTD. For YTD 2025 returns, the bond return story has been about the bull steepener of the curve, but that is looking more tenuous after this week’s FOMC meeting and commentary. The odds of an FOMC cut in December dropped from over 94% earlier in the week to 65.2% as we go to print.
The HY OAS is +294 bps in a sign of constructive views on the credit cycle in HY bonds and the +80 bps is clearly in line with multi-cycle credit lows for IG.
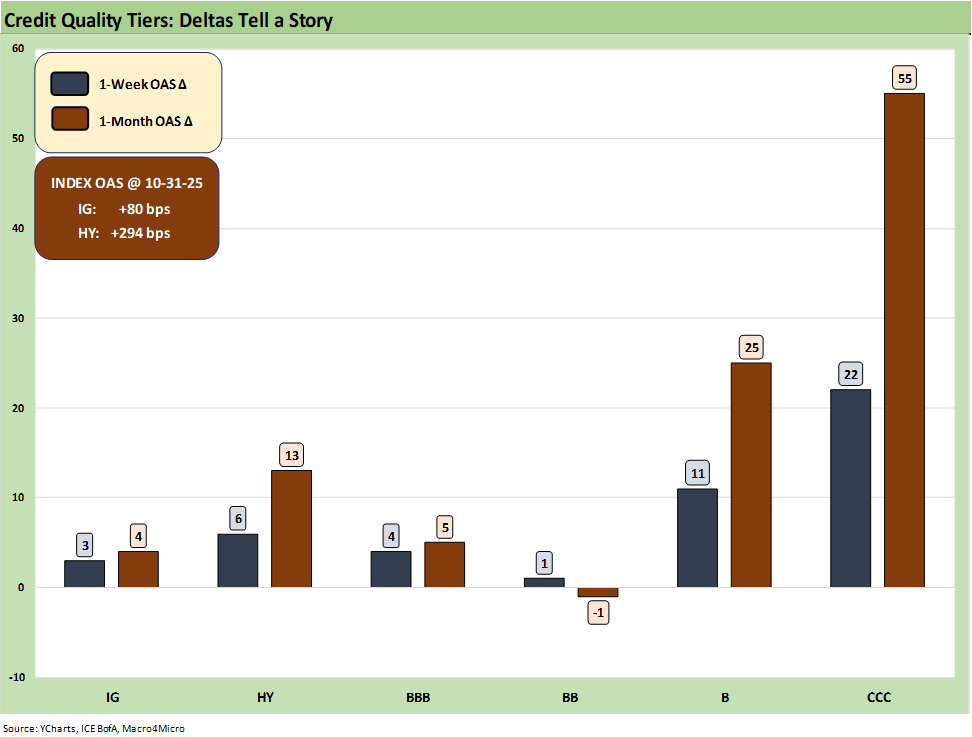
The above chart updates the 1-week and trailing 1-month spread deltas for IG and HY and from the BBB to CCC tiers. With IG and HY slightly tighter on the week before rebalancing, some post-restructured bonds dropped in (Saks, Altice) to push HY wider by +13 bps with the CCC +55 bps wider on the month and +22 bps on the week. IG moved from +77 bps before the rebalancing to +80 bps after.
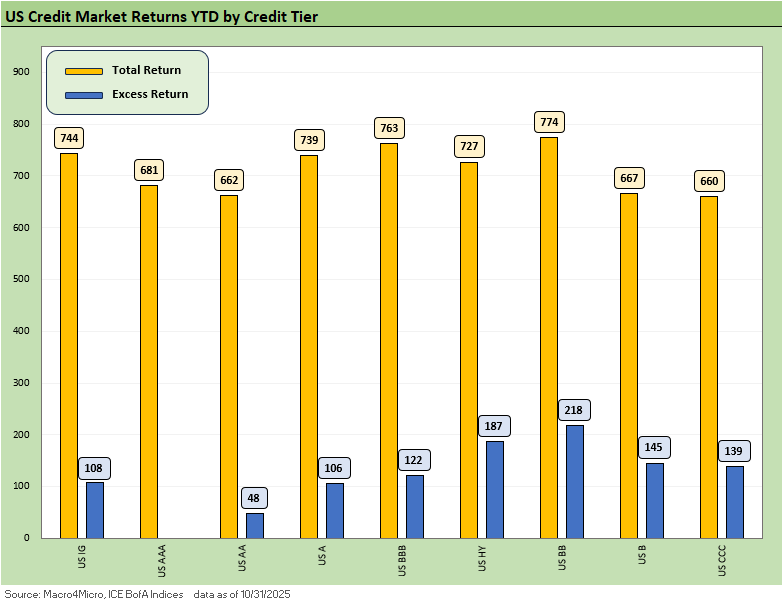
The above chart updates the YTD 2025 excess returns and total returns for IG and HY across the credit tiers. The support of the UST curve is clear enough in the total return numbers, but those tailed off sequentially on the UST action. The YTD excess returns were mixed in trends on the week on spread contraction prior to the rebalancing with HY excess return increasing to +187 bps YTD. The IG excess return declined sequentially to +108 bps YTD from +131 bps last week.
Credit has generally been delivering positive trends of late, and one can make an easy case that the risk compensation has played out more favorably for BBs for the risks being taken vs. the lower tiers. The CCC tier with its mix of coupons, spreads, and shorter duration had been framing up well in the bar chart until recent weeks. The BB tier remains the clear winner YTD vs. the B and CCC tiers, begging the question of how much better the excess returns in the CCC and weak B range should be given the magnitude of the risks relative to the BBB and BB tiers.
For now, the B and CCC excess returns are falling well short of where their returns should be. The BBB tier was modestly lower than the B and CCC tier YTD in excess returns at +122 bps. The risk-adjusted debate tends to get obscured by the discussion of what is the right metric to make that risk-adjusted return assessment.
Note: The most recent data and related comments are in “Recent Trends.” We break out “Historical Context” sections in the Credit Markets and Yield Curve weeklies to roll forward the history and cyclical framework. We do that so new readers do not have to go fishing through links.
Recent Trends:
The IG market spread action was very uneventful for the week. We saw spreads widen on the week for IG by +3 bps to +80 bps with BBBs +4 bps, the A and AA tiers both +3 bps, and the long duration AAA tier wider by +4 bps. The total face value of the IG index is now almost $9.45 trillion (face value) with recent data showing the A tier edging ahead of the BBB tier in total face value over the summer. The BBB tier is larger than France and the UK GDP but still a few hundred billion short of Germany.
Historical context:
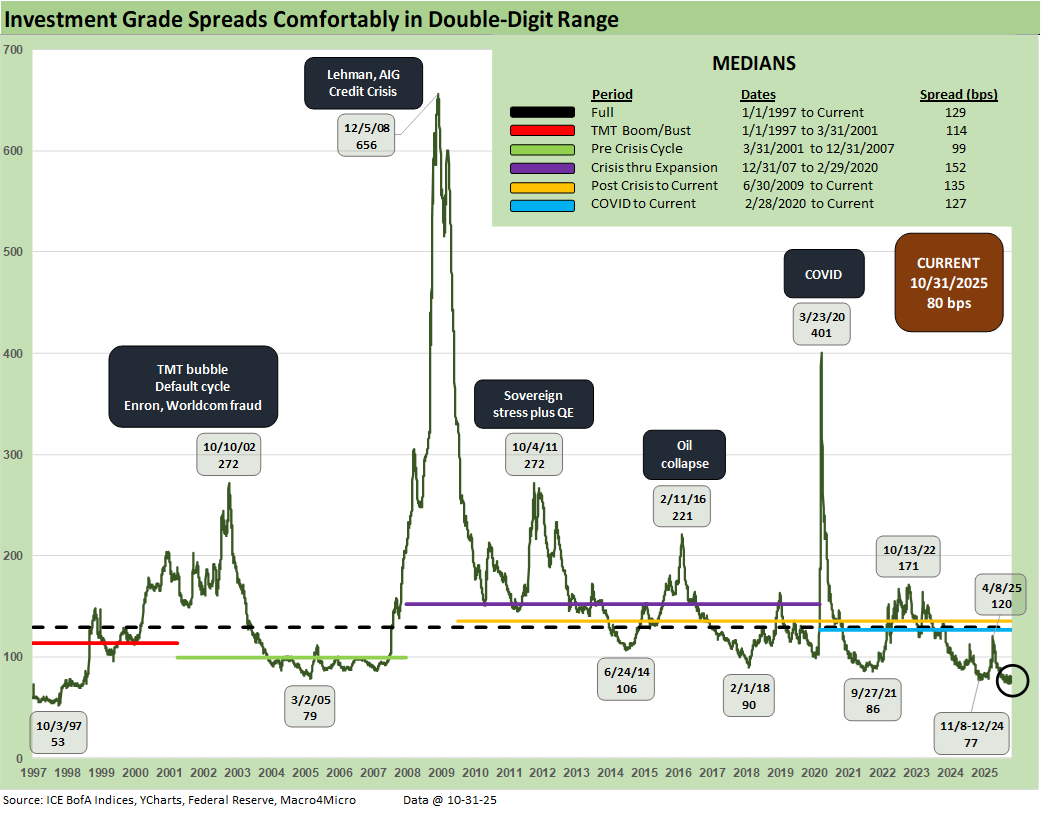
The above updates the multi-cycle spread history for IG as we see the wild swings across time when the banks were in harm’s way in 2008 and the heavy exposure to energy names whipsawed BBB energy in 2015 and early 2016.
The current +80 bps is near the mid-70 handles in recent weeks and the lows in Nov 2024 . IG spreads are slightly wide to the March 2005 levels just before the auto OEMs started taking a lot of heat with a GM warning in mid-March 2005 (downgrades for Autos later in the year). There is no getting around the reality that IG spreads rarely get this low, but there is plenty of history where they were lower in the late 1990s.
The record lows for IG spreads were seen in early Oct 1997 at +53 bps when that year saw a protracted stretch of 60-handle spreads.
The Oct 1997 low came just before the Asian Yankee bond market started to implode, and the broader regional Asian crisis unfolded. The market spent time in 1998 in the mid-70s range including the early summer. Life got ugly starting in Aug 1998. Spreads in 1998 kicked into a correlated beatdown after the Russia default in Aug 1998 did damage to other markets as a contagion effect hit EM credit and US HY valuations.
1998 was the summer and fall of LTCM after the Russian default of Aug 1998. Lehman also saw a mini panic by Oct 1998 with a funding crunch that they got past quickly. CDS exposure and counterparty risk saw fleeting focus at the time. Counterparty risk lessons were not learned in 1998 as we saw in the housing bubble and structured finance boom on the way to the 2008 crisis.
Banks and financial services are an anchor today…
Critical drivers of IG spreads are always the banks and financials broadly at over ¼ of face IG value, and the major banks are very sound at this point compared to past recession periods such as Dec 2007 to June 2009, which was an epic meltdown for the banks and brokers. The securities firms ended up merging (BofA+ML, JPM+Bear) or essentially getting sold off in pieces (Lehman) or converting to Bank Holding Companies (Goldman, Morgan Stanley). The days of commercial paper funding of securities firms have given way to deposits, so there is also much less funding risk in the system.
The TMT bubble years of 2000-2002 is the stuff of legend. Earlier, the infamous 1980s LBO reckoning and the commercial real estate stress of 1990-1993 came not long after the thrift crisis and oil patch collapse slammed many banks and S&Ls. The term “regional bank crisis was kicked around in the early 1990s from real estate exposure, but Citibank was also on the ropes.
The COVID crisis was a very different beast in 2020, but the market benefited from a well-positioned Fed with a crisis-period toolbox to pull out. How the Fed will be governed or legislated under the shadow Project 2025 priorities (see Chapter 21 and 24) will be a critical variable into 2026 when the new Trump team is in place.
What Trump wants to do with his loyalists at the helm of the Fed is unclear except for the initial 300 bps in fed funds cuts he demanded (now 275? Soon to be 250 bps by Jan 2026?). He most definitely will not receive such an outsized series of cuts without a massive crisis in the markets, which would not bode well for his “clout” if they blame his economic policies.
Recent Trends:
HY OAS saw a +6 bps move wider on the week, which brings the YTD widening to +2 bps. The 1-month change is at +13 bps wider even with such extremely tight spreads. We cover the credit tiers in more detail further below.
Historical Context:
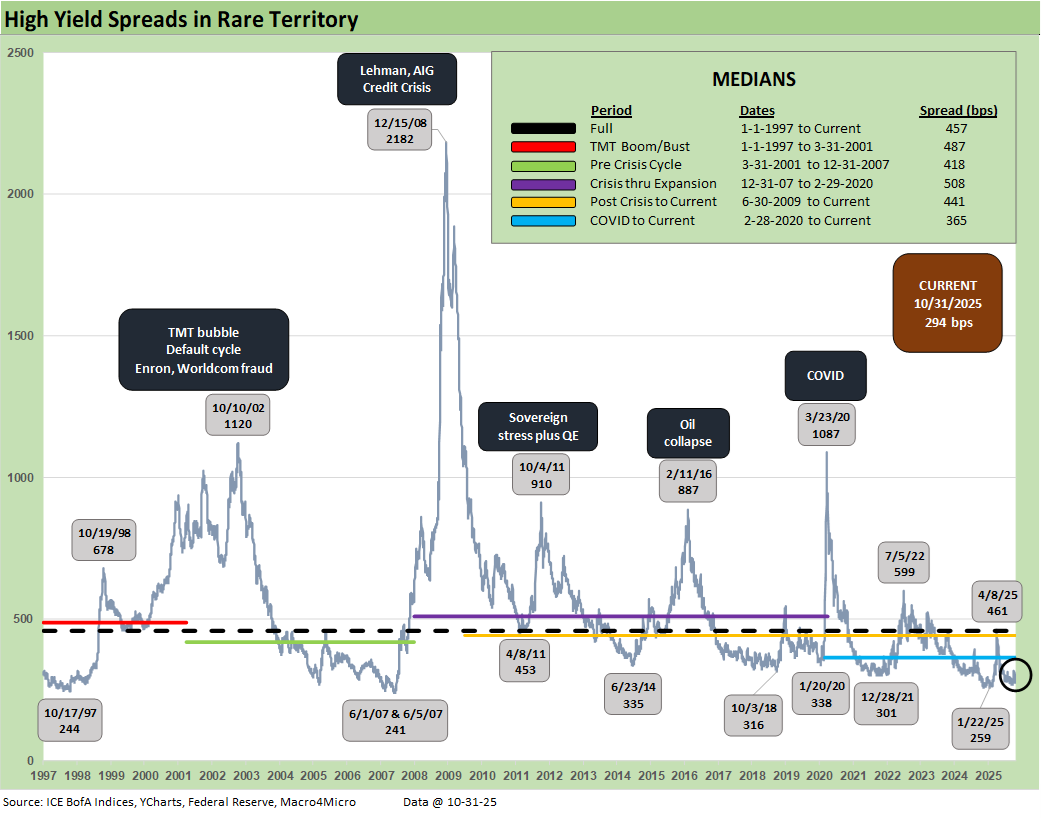
The past week’s HY move wider to +294 bps comes against the backdrop of an FOMC cut of -25 bps, subsiding China trade anxiety, and solid bank and industrial bellwether 3Q25 earnings. The S&P is running at over +10% blended earnings growth for these larges caps.
HY OAS remains inside the COVID-to-current median of +365 bps and well below the post-Liberation Day spike to +461 bps. We’re now inside the late 2021 tights and in the areas of the recent sub-300 tights. The main threats are stubborn long rates, tariff realities (despite those in denial), consumers facing pressure on such major threats as health insurance premiums. The questions around whether the FOMC will ease have gotten louder quickly, and inflation is still 1% above target. Political chaos is other worldly and has not been this bad since the Civil War. 2025 makes 1968 look like a walk in the park.
Getting all these challenges to fall into place favorably is a big ask given the scale of the political dysfunction and Trump’s sensitivity around being tough on trade partners with the USMCA up for review in coming months. China is the only trade partner that can stand up and defend their position in the same weight class as the US. Meanwhile, the IEEPA tariff weapons will be before SCOTUS this week.
Today’s HY market presents a much healthier credit mix than in June 2007 when LBOs had gone off the charts and were partly funded with HY bonds. In the current market, those highly leveraged transactions have migrated over to private credit, which is generating some ugly headlines right now on a few deals. We will be getting waves of BDC earnings this week, and we expect that nerves will continues to calm down around “credit contagion” chatter given a few (very) bad headline deals.
The HY bond index default cycle is very much in check. The distress and debt exchange actions will be weighed more heavily (and for the most part quietly) over in private credit as the year plays out. That said, we have two very noisy private credit situations (Tricolor, First Brands) that dominated the headlines in recent weeks with the potentially massive fraud chatter around First Brands and some grim commentary around Tricolor. We have seen subprime auto finance defaults before – even in IG commercial paper issuers – so that is not a Loch Ness moment. First Brands could have some auditors facing some risks, and the banker due diligence team might get a “time out” from management.
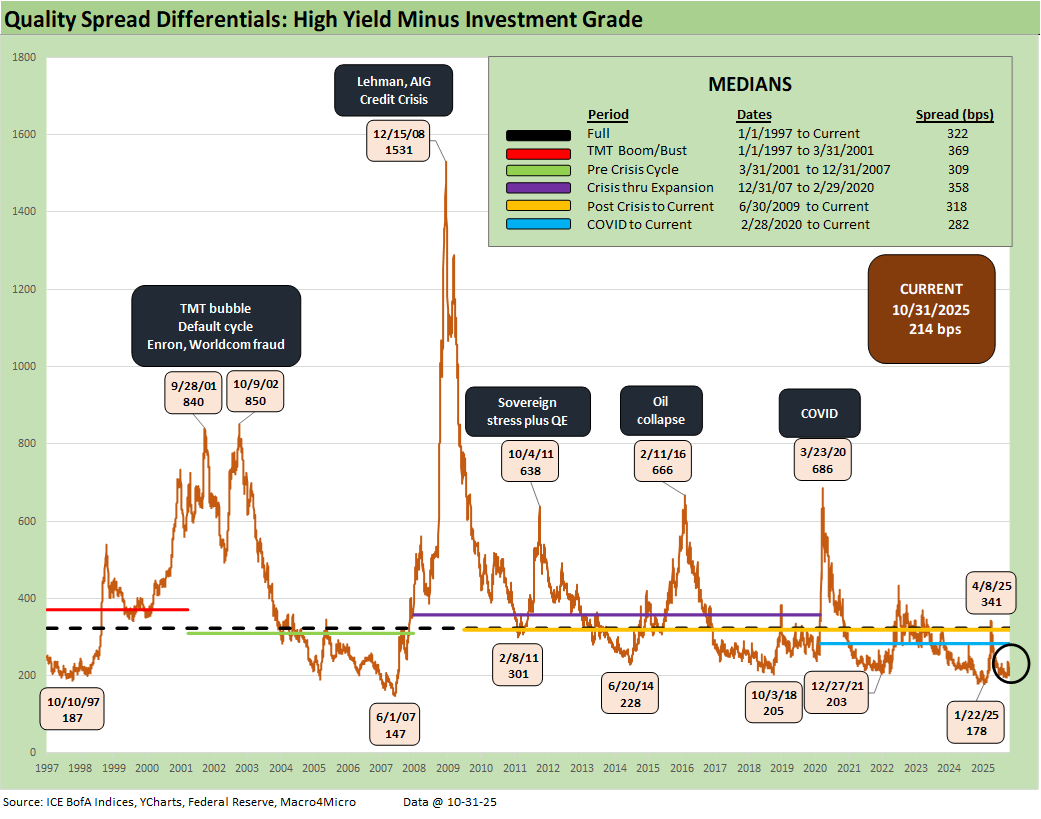
The “HY OAS minus IG OAS” quality spread differential of +214 bps is above the tights of +178 bps seen in Jan 2025 and materially higher than the +147 bps in June 2007. The +214 bps is inside the credit cycle mini-peak in June 2014 but above the Oct 2018 lows.
We see the peak of +341 bps after Liberation Day vs. a long-term median of +322 bps. Most of the cyclical timeline medians noted in the box had 300-handles, so despite some recent widening in HY, the trend overall still highlights that quality spreads are offering very low compensation for moving down the credit tiers.
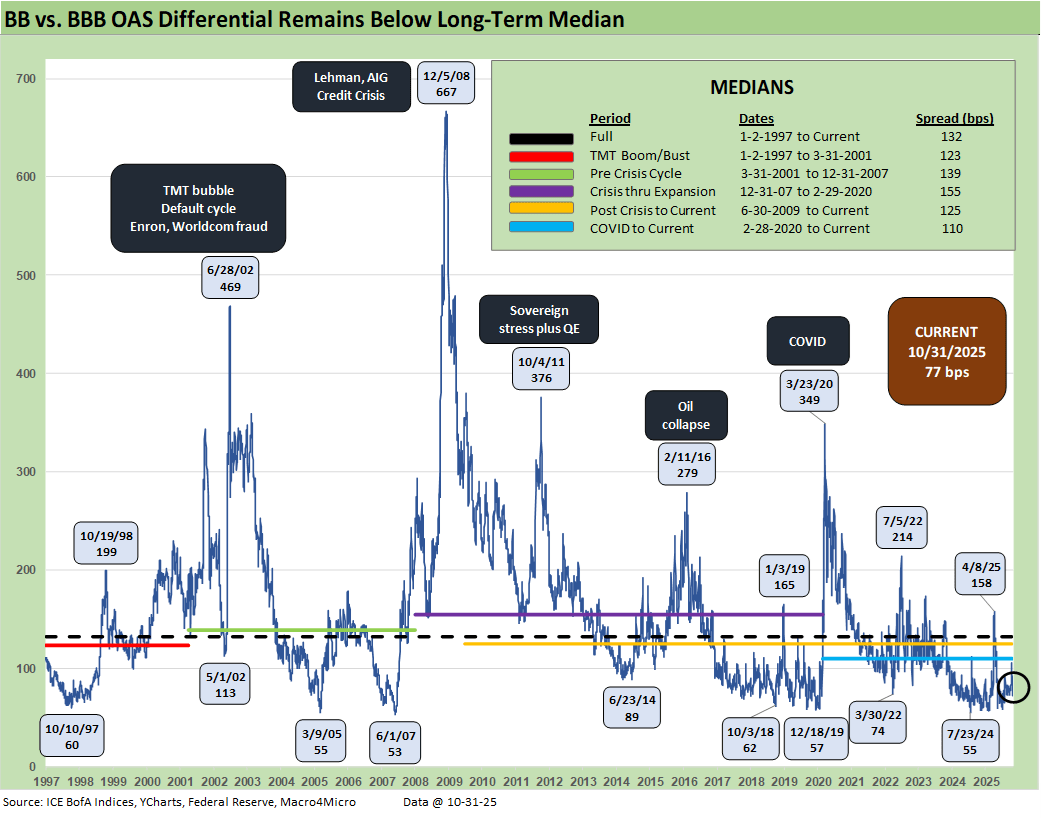
The “BB OAS minus BBB OAS” quality spread differential compressed by -3 bps this week to +77 bps, or well inside the post-Liberation Day spike to +158 bps. The long-term median of +132 bps is consistent with the medians across the credit cycles detailed in the box.
The current cycle has routinely hit low BB vs. BBB differentials with 50-handles seen at numerous points. The record low tick was in June 2007 at +53 bps. The market has come close to the all-time lows on numerous occasions from 2019 to 2024.
Recent Trends:
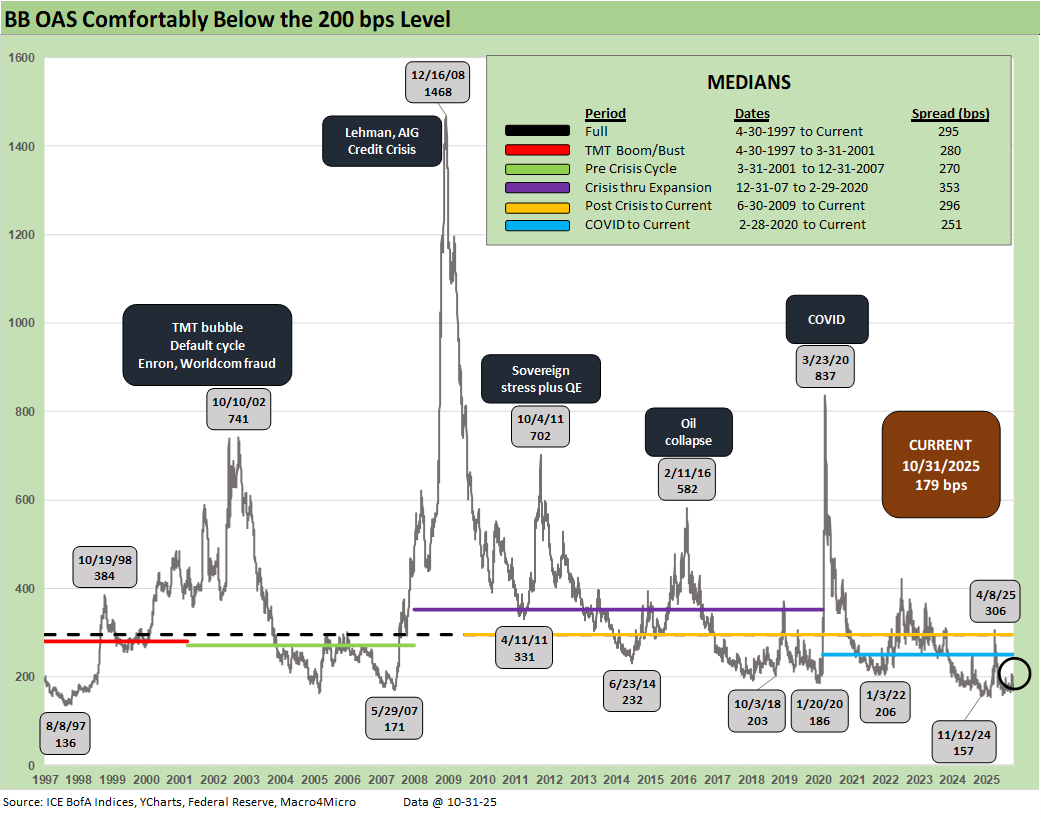
The above plots the time series for the BB tier across the cycles. The past week saw a +1 bps rise to +179 bps. The long-term median of +295 bps remains in a different zip code.
Historical Context:
The demand for BB tier bonds has seen BBB buyers, HY lite strategies, and defensive HY funds all looking to this tier that ranks as by far the largest in HY. The strategy has worked as we covered earlier in excess and total returns across the tiers. The BB tier has been a good way to take credit risk while managing duration exposure and still carrying a respectable coupon.
Recent Trends:
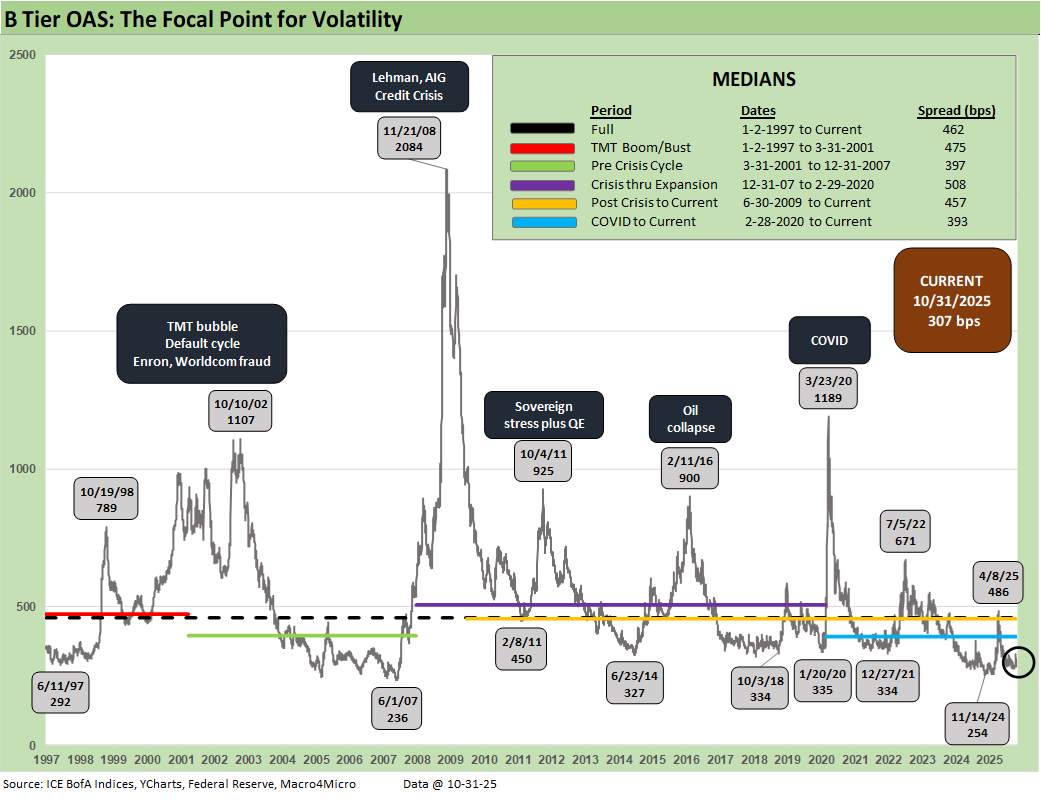
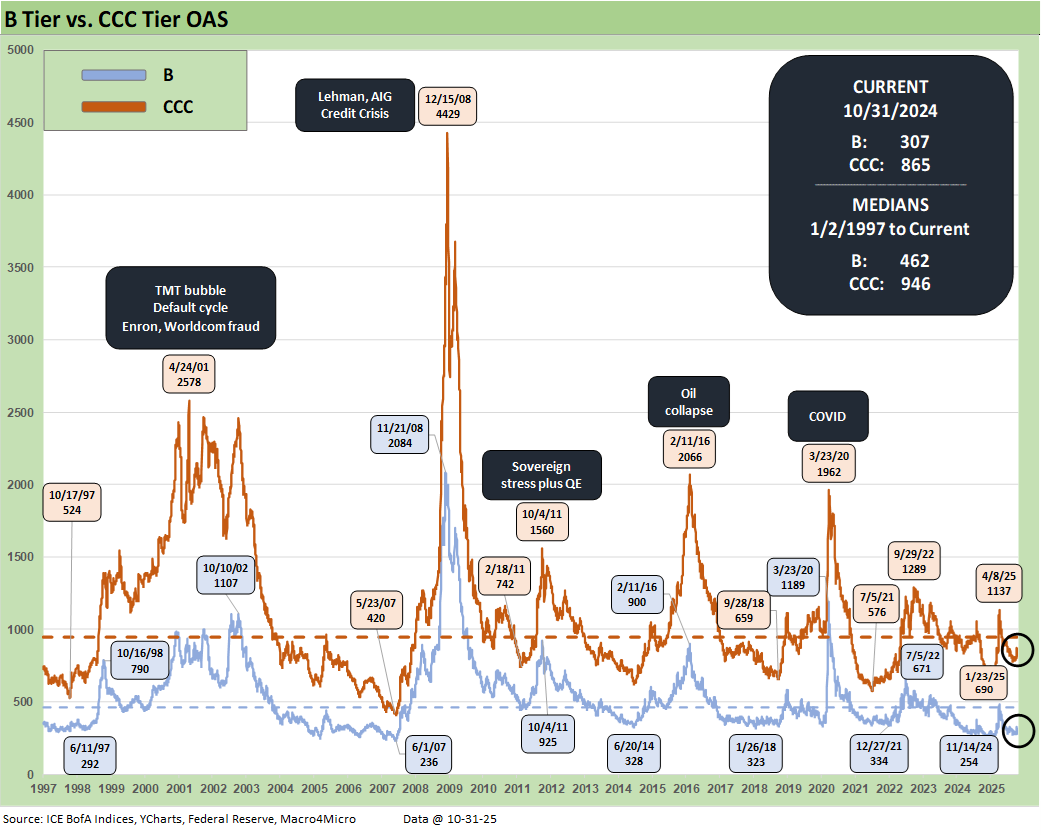
We see the current level at +307 bps, or +11 bps wider on the week, as the B tier OAS moved back above the +300 bps line. B tier OAS had reached a post-2007 low of +254 bps in Nov 2024 before the Liberation Day fallout in April 2025 drove the B tier OAS to +486 bps. The long-term median stands at +462 bps.
Historical Context:
The B tier is the sweet spot and home of the “HY Classic” investor. This current cycle’s median at +393 bps is the lowest of the mini-cycle medians presented in the chart. It is well below the mid to high 400 handles seen in half the timelines detailed with the exception of the post-crisis (Dec 2007 to Feb 2020) median which crossed above the 500 range to +508 bps. The March 2001 to Dec 2007 (start of recession) median was just under +400 bps at +397 bps when the compression period from 1H04 to 1H07 pushed that timeline median lower.
Recent Trends:
The above time series plots the wildest ride across the cycles seen in the B and CCC OAS levels. Both credit tiers are dramatically below their long-term medians. The B tier at +307 bps is well inside the median of +462 bps while the CCC tier at +865 bps is well below the median of +946 bps.
Historical Context:
The post-crisis spread spike in Dec 2008 is ranked in a world of its own given the bundle of risks including a collapse of some market makers (and near collapse of others without Fed-engineered mergers) as well as evaporating secondary liquidity in the OTC HY bond market.
The TMT cycle default wave and secondary liquidity implosion saw multiple spread peaks in 2001 and 2002 that were especially ugly. Enron came in the fall of 2001 and WorldCom in the summer of 2002. IG spreads and BBB tier names also saw selective panic in the summer of 2002.
The sovereign panic of fall 2011 is in evidence as was the overexposure and E&P excess of 2015 to early 2016 on the collapse of oil and gas as the cash flow burn and valuation crisis dominated the upstream sector.
COVID saw a wave of supportive monetary policy and fiscal actions, so the energy sector HY crisis peak OAS in early 2016 was wider in spreads than those seen at the 3-23-20 COVID highs. In the case of the energy crisis, a major cross-section of the HY universe was driven by the same small group of risk factors in oil and gas prices and the recurring story of a collapsing borrowing base with the banks. Fear of HY fund outflows piled onto the defensive pricing.
During COVID, the return to ZIRP and the “great reopening” of the economy and markets bolstered risk appetites and generated record refinancing and extension volume. In turn, that materially reduced refinancing risk (thus default risk) and lowered coupon costs from IG to HY. Household cash flow was also boosted on mortgage refinancing to record lows.
The ZIRP backdrop also eased ABS costs and bank line costs. Under some of the Fed legislation and control moves being discussed in the current market, that support seen in earlier credit panics would not have happened. If the Fed loses such tools, that would mean the White House would pick winners and losers (i.e. friends vs. enemies).
Control of the Fed would offer the White House vastly more financial power than it has now to “influence” (intimidate? control?) borrowers and lenders alike. Such an outcome fits into any good authoritarian’s playbook (control the guns and money…one often leads to the other). Purges help.
Recent Trends:
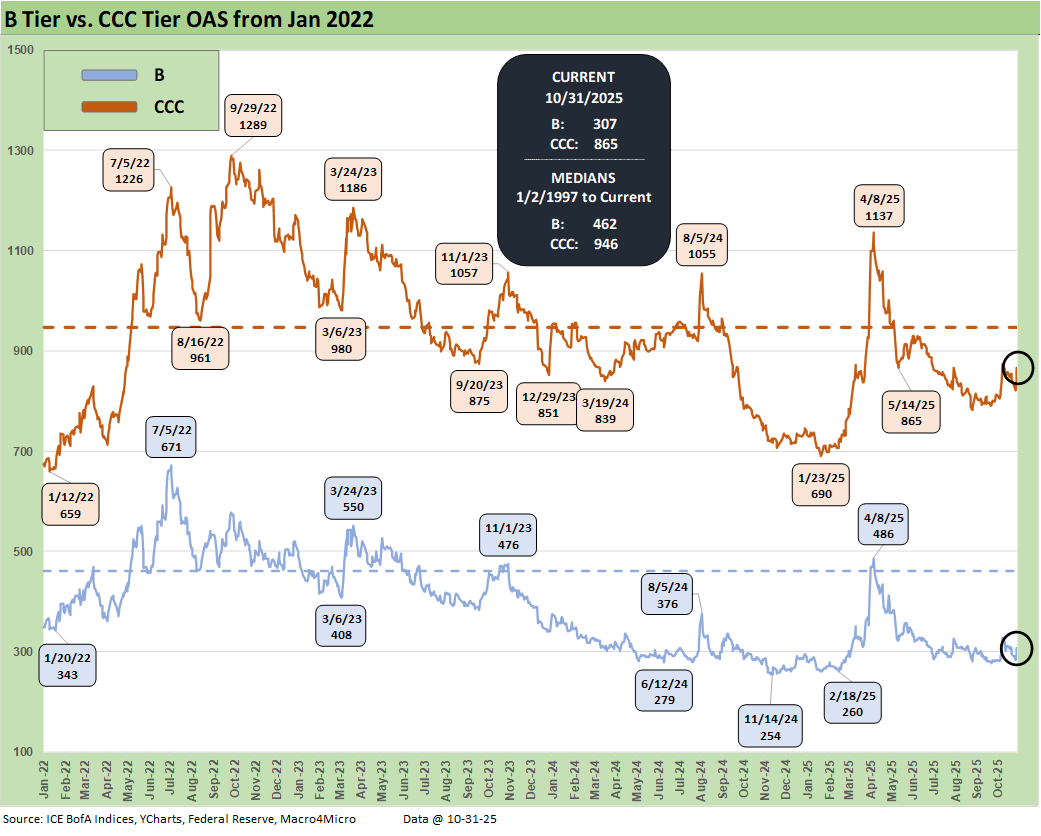
The above offers a more granular visual of the B vs. CCC OAS since the start of 2022 to get a read on how credit pricing moved across the tightening cycle on the way to easing mode.
The sudden widening on “China war Friday” was a function of renewed aggression toward China trade policy (see Credit Markets: Toxic Brew? New or Old Recipe? 10-13-25). Trump scrambled to calm nerves on Truth Social on the weekend after making numerous threats. That offers a reminder that these spread levels are vulnerable to bad policy moves.
The China-US trade battles tend to be a wait-and-see exercise again on “pauses” and extensions. We just got another one that did not really change the core risks of relapses, but at least the China front will be quiet for a while.
China had tweaked Trump to elicit that response on strategic metals and rare earth restrictions, but Trump has been threatening the EU and Mexico to jack up punitive tariffs on China for weeks. It is a two-way street with the consumer lying down in the middle of the road. The big risk into 2026 is the USMCA review. That should be an adventure, and it could be materially influenced by the SCOTUS IEEPA decision and how aggressive Trump could be in the aftermath.
Historical Context:
The Russian invasion of Ukraine also rattled markets in 2022 as evident in the above chart. The resulting dislocation in energy markets was a major contributor to inflation that seldom gets mentioned in the political arena or by more partisan economists. Oil and gas prices were also major factors in the mix of 1973-1975 and 1979-1981 inflationary/stagflationary periods.
In the end, there was no recession in 2022 and no ugly default wave. Inflation came down quickly from the June 2022 peak. CCC spreads peaked in Sept 2022 as seen in the chart above as did B tier spreads in early July 2022. The inflation pain of 2022 too often gets cited without proper context around what is being “repaired” (or not repaired) in 2025 in the context of inflation.
Many of the talking heads have selective memories and seem to forget that headline CPI was 2.9% in Dec 2024. Despite claims, Trump has not driven inflation down since taking office. Too often the political rhetoric frames current inflation against the 2022 peak rather than the end of 2024. What Trump has done is create new contingent concerns around inflation from tariffs as well as disturbing supply and demand balances in key goods. China’s wide range of imports from high to low value is where you do not want to see more supply-demand imbalances.
Progress in 2025 through September on CPI has been essentially nonexistent to this point. The noisemakers should ask themselves how inflation went so high by June 2022 and then came down so quickly. That is a natural extension of pondering where it goes from here – and why.
The supply-demand imbalances of 2021 should have been on the Fed’s radar screen and a bigger priority at that time. That said, the absence of discussion of Russia and oil/gas impacts on inflation smack of selective performance attribution and is both misleading and intellectually dishonest. We are hearing plenty of intellectual dishonesty out of the White House on economic indicators, whether inflation or GDP growth (see The Curve: A Slow Pour of Tariffs 10-27-25).
Recent Trends:
The quality spread differential between the B and CCC tier was wider on the week by +11 bps to +558 bps with CCCs and Bs moving wider by +11 bps and +22 bps, respectively.
Historical Context:
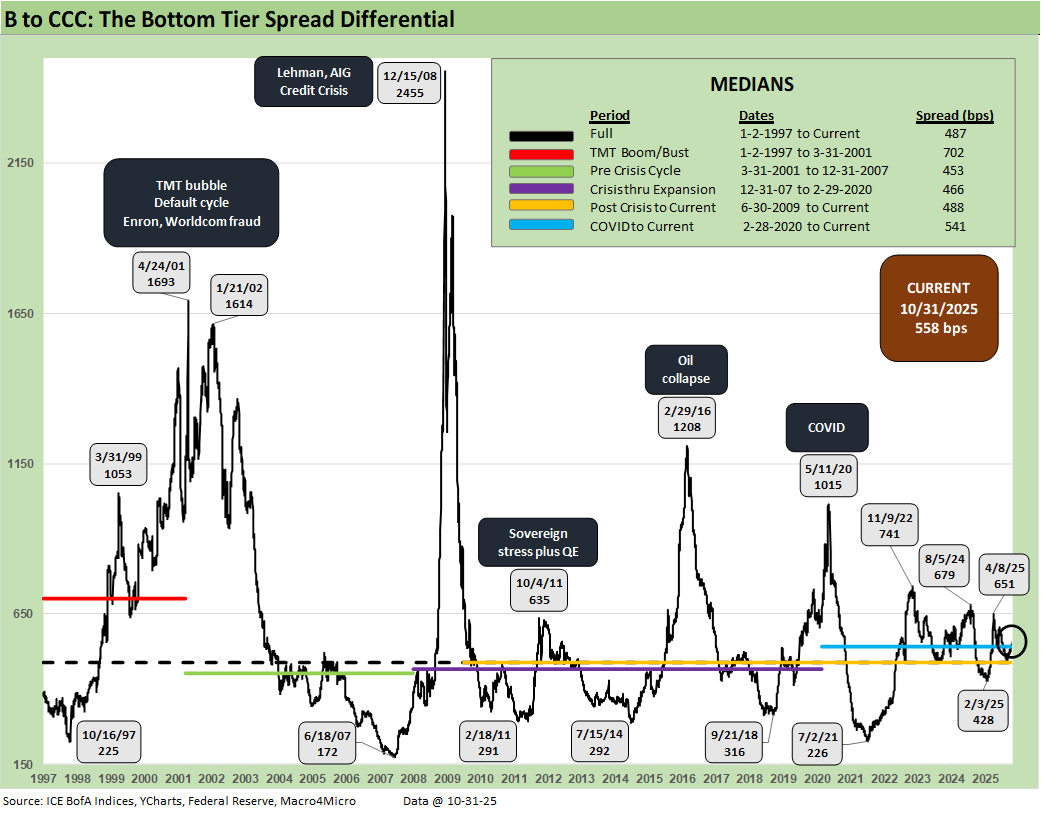
The above quality spread differential for B vs. CCC tells a simple story. In times of macro stress, HY secondary liquidity panics (fear of fund redemption waves, etc.) and quality shocks where the HY index has industry concentrations (e.g. TMT, Energy), the CCC tier quickly sees credit risk turn into the equivalent of equity risk and even high-risk equities. That means bond pricing is expected to offer returns commensurate with that status. That is when the action is about dollar prices and not spreads.
Trying to gauge the credit risk, the default risk, the loss-given-default pricing component, the secondary liquidity penalty, the structural risks of the governing documents, and the recovery value and time horizon risks (30 days on CDS vs. post workout value upon emergence, etc.) is where the distressed debt commandos and seasoned vets come in.
The quantitative modeling of defaults can sometimes take on the nature of “weird science” or “fake science” while the classic distressed investor typically has the experience and legal inputs to navigate such markets. Assumptions can always be wrong, but there are histories and templates that those players tap into.
Recent Trends:
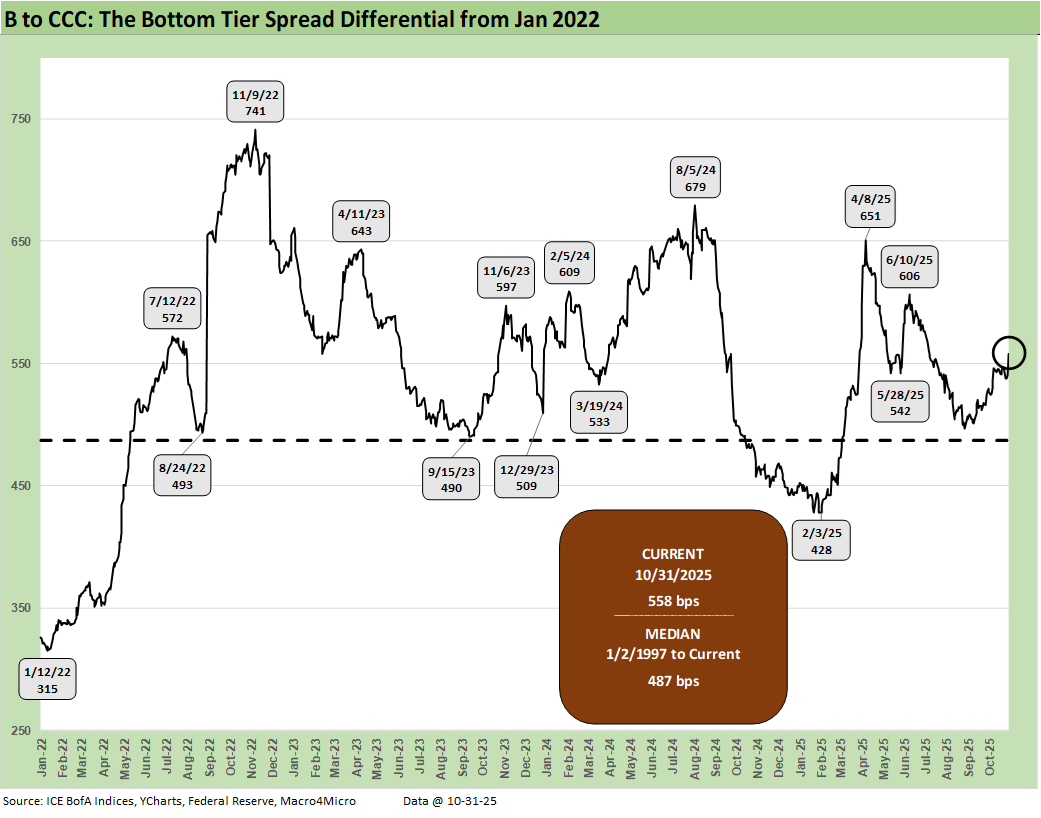
The above chart just shortens up the time horizon for the B vs. CCC quality spread differential history for the period from Jan 2022 through current times to capture the tightening cycle, the start of easing, and the new world of tariffs.
We see peak quality spread differentials at +741 bps in Nov 2022, up from +315 bps at Jan 2022. We are currently at +558 bps, above the long-term median of +487 bps.
Historical context:
As a reminder, many market watchers were screaming recession in the fall of 2022. We did not see it that way (see Unemployment, Recessions, and the Potter Stewart Rule 10-7-22). What NBER might dub a “recession” is always a “jump ball” and comes at a major lag (see Business Cycles: The Recession Dating Game 10-10-22). From our standpoint, a recession would require negative payroll and sustained weakness in Personal Consumption Expenditures. That is not off the table over the next 6 months, but we are not there yet. However, there is a growing chorus that the market is heading in that direction.
Cyclical turning points? 2022 vs. today…
In the current market and the recession debate, we see a mixed picture. The fall of 2022 lacked serious payroll pressures, and we are seeing some early signs of those now. We will see if that data flow gets choked off in the shutdown or radically reduced via a Project 2025 hit squad.
The shutdown brings worries that Vought (OMB head and Project 2025 architect) will use the shutdown to overhaul all of the data resources. That will impair economic visibility and the ability to frame risks and Fed policy. The past two weeks brought back the risk of a China trade war, which is part of a radically different set of risks in tariffs that was not in the picture back in 2022. That risk took another “pause” after the APEC Summit.
There was plenty to worry about back in 2022 and Russia-Ukraine was not helping on the front of cyclical optimism with an energy price spike. However, consumer spending was still solid, and employment was strong. The yield curve was of course a mess. That said, it takes a lot to cause a recession.
PCE and consumer spending was rolling along impressively in the fall of 2022. That has been under pressure in 2025 with PCE lines in the GDP account weak in 1Q25 and 2Q25 even after the sharp upward revision in the final estimate for 2Q25 (see 2Q25 GDP Final Estimate: Big Upward Revision 9-25-25). We are seeing some decent retail sales numbers along the way, and the latest PCE release on income and outlays was more constructive on consumer outlays (see PCE August 2025: Very Slow Fuse 9-26-25). Unfortunately, GDP releases, PCE, and Income & Outlays data has been sidelined during the shutdown.
Tariffs and inflation…
PCE inflation numbers remain well above target while CPI posted some warm numbers for August, but PPI offered some offsets (see CPI August 2025: Slow Burn or Fleeting Adjustment? 9-11-25, PPI Aug 2025: For my next trick… 9-10-25). The updates for September CPI was more about “absence of disaster” in the market reaction, but the signals across many line items were not favorable (see CPI September 2025: Headline Up, Core Down 10-24-25).
After the tariff legal decision on IEEPA in coming days/weeks, we believe economic turmoil could ease if that Appeals Court decision can hold up against the SCOTUS “friends of Trump” (see Macro Menu: There is More Than “Recession” to Consider 8-5-25).
If SCOTUS rules against Trump in the IEEPA case, he would lose some of his easiest, readily available weapons in trade talks – especially with China. The loss of IEEPA would also (in theory) reduce Trump leverage over the EU, Canada and Mexico. The White House will of course deny that and try more triple-digit tariff threats regardless. The USMCA is up for review in 2026, so the anxiety will be part of the landscape one way or another.
The 3Q25 earnings season and guidance priorities…
Last but not least, we saw solid earnings trends coming out of 2Q25 with constructive guidance. The 3Q25 earnings season has been very solid year again with blended earnings growth over 10%. The long tail of small and mid-sized business often gets overlooked in terms of the threat from that sector to payrolls. What moves the stock market with large caps may not rescue payroll trends.
We also just saw a fresh wave of tariffs to be phased in and even more in the queue. We got some fresh color on these tariffs and associated cost mitigation strategies in earnings call Q&A. There is no question manufacturers have been hit hard on the expense line. That has been a major topic in ISM feedback and in industry trade group feedback. The question is the timing and magnitude of secondary and tertiary effects from pricing to margins to attempts at cost offsets.
The questions around capex planning for 2026 are still hazy. That might be a 4Q25 earnings guidance discussion. For those most exposed to tariffs and global sourcing, the IEEPA decision is critical. That will not be available except for (maybe) the late earnings reports as we now roll into retail earnings season. The BDC earnings reports are concentrated in early November (this week), and those have taken on new significance with the two meltdowns (First Brands, Tricolor).
Recession debate still gets our “no” vote for 4Q25…
For now, the recession risk handicapping is a pitched battle. The mix of variables are worse in the fall of 2025 than 2022 with the exception of inflation (lower now). Short interest rates are lower now and even the lower odds still favor more easing. Jobs and consumer spending and corporate sector reinvestment and hiring are the main events, and labor will remain a weak part of the cyclical story. Consumer spending in the PCE lines of GDP is weaker now than in 2022 (and 2024) as is the employment picture. The small business sector is also weaker now on tariffs.
All in, risk premiums in credit are low, multiples are very high in equities, and the market is relying on Washington to not blow it all up. So far, we have avoided fully unhinged trade wars in the “age of Trump tariffs” except a very brief and ugly one with China.
Presumably, the shutdown will not do too much damage, or the market will need to react. The signs are not good on the shutdown, but we could see odds of a deal improving once all the “mail gets opened” on health insurance premiums and voters are outraged. If the shutdown brings a mass overhaul of economic data releases (BLS and BEA), then the market will know that there is serious trouble ahead for Fed independence.
See also:
The Curve: Macro Data MIA? Policy Prudence KIA? 11-3-25
Market Commentary: Asset Returns 11-2-25
Mini Market Lookback: Not Quite Magnificent Week 11-1-25
Synchrony: Credit Card Bellwether 10-30-25
Credit Markets: Call Me After Trouble Arrives 10-27-25
The Curve: A Slow Pour of Tariffs 10-27-25
Market Commentary: Asset Returns 10-26-25
Existing Home Sales Sept 2025: Staying in a Tight Range 10-26-25
Mini Market Lookback: Absence of Bad News Reigns 10-25-25
CPI September 2025: Headline Up, Core Down 10-24-25
General Motors Update: Same Ride, Smooth Enough 10-23-25
Credit Markets: The Conan the Barbarian Rule 10-20-25
Mini Market Lookback: Healthy Banks, Mixed Economy, Poor Governance 10-18-25
Mini Market Lookback: Event Risk Revisited 10-11-25
Credit Profile: General Motors and GM Financial 10-9-25
Mini Market Lookback: Chess? Checkers? Set the game table on fire? 10-4-25
JOLTS Aug 2025: Tough math when “total unemployed > job openings” 9-30-25
Mini Market Lookback: Market Compartmentalization, Political Chaos 9-27-25
PCE August 2025: Very Slow Fuse 9-26-25
Durable Goods Aug 2025: Core Demand Stays Steady 9-25-25
2Q25 GDP Final Estimate: Big Upward Revision 9-25-25
New Homes Sales Aug 2025: Surprise Bounce, Revisions Ahead? 9-25-25
Mini Market Lookback: Easy Street 9-20-25
Home Starts August 2025: Bad News for Starts 9-17-25
Industrial Production Aug 2025: Capacity Utilization 9-16-25
Retail Sales Aug 2025: Resilience with Fraying Edges 9-16-25
Mini Market Lookback: Ugly Week in America, Mild in Markets 9-13-25
CPI August 2025: Slow Burn or Fleeting Adjustment? 9-11-25
PPI Aug 2025: For my next trick… 9-10-25
Mini Market Lookback: Job Trends Worst Since COVID 9-6-25
 |
|
You laid out the structural fragility in credit markets with rare historical depth. I liked how you connected today’s tight spreads to past cycles like 1998 and 2007 because it gives context to the illusion of calm. S&P Global data shows CCC-rated issuance has fallen 42% year to date, underscoring how lower-tier credit is already rationing risk. I wonder whether this thinning liquidity in subprime and private credit will quietly pressure spreads before the year's end.