
PCE August 2025: Very Slow Fuse
PCE for August was another one of those “absence of bad news is good news” months, but there was ample evidence of inflationary forces at work.


The latest national security threat will bring more tariffs and pricing pressure.
The PCE inflation lines show slow and steady pricing pressure in Goods (Durables and Nondurables) and very stubborn sideways Services inflation. In Goods, we see multi-month sequential increases and some new recent 2025 highs as evidence of inflation pressures.
PCE price indexes YoY in August 2025 saw headline PCE at 2.7% (up from 2.6% in July) and Core PCE at +2.9% (flat to July). Goods PCE was +0.9% YoY at a YTD high. Durables was also at a YTD high and Nondurables at a post-Feb high. For the Aug 2025 price indexes, the Food line hit 2.2% YoY, which is also a YTD high.
Services PCE remains mired in the mid 3% range with the Aug 2025 level of 3.6% only exceeded in 2025 by February’s 3.8%. The range in 2025 for Services has been 3.5% on the low side to a single month of 3.8%. We see 4 months at 3.6% including January. As a reminder, Services consumption is almost double the Goods line in dollar terms as detailed in the PCE report. The fact that Services inflation is not moving much from the mid 3% area is an issue in a services-heavy economy.
The balance of personal income vs. outlays still shows consumer resilience with the payroll numbers serving as a cautious leading indicator on what may unfold in the fall if tariff-cost-mitigation actions start to weigh on payrolls, headcount planning, and capex reassessment on earnings weakness.
We face more tariff risk coming on with earlier follow-through lags (effective dates, working capital cycles etc.) including some new announcements (actual or teased) at the end of this week on branded pharma (100%) commercial vehicles (25%), and upholstered furniture (30%) and kitchen cabinet doors (50%) among others. The National Security threat seems to be a bit of reach. It’s unclear which category will fall under Section 232 and where the SCOTUS IEEPA appeal fits into the picture.
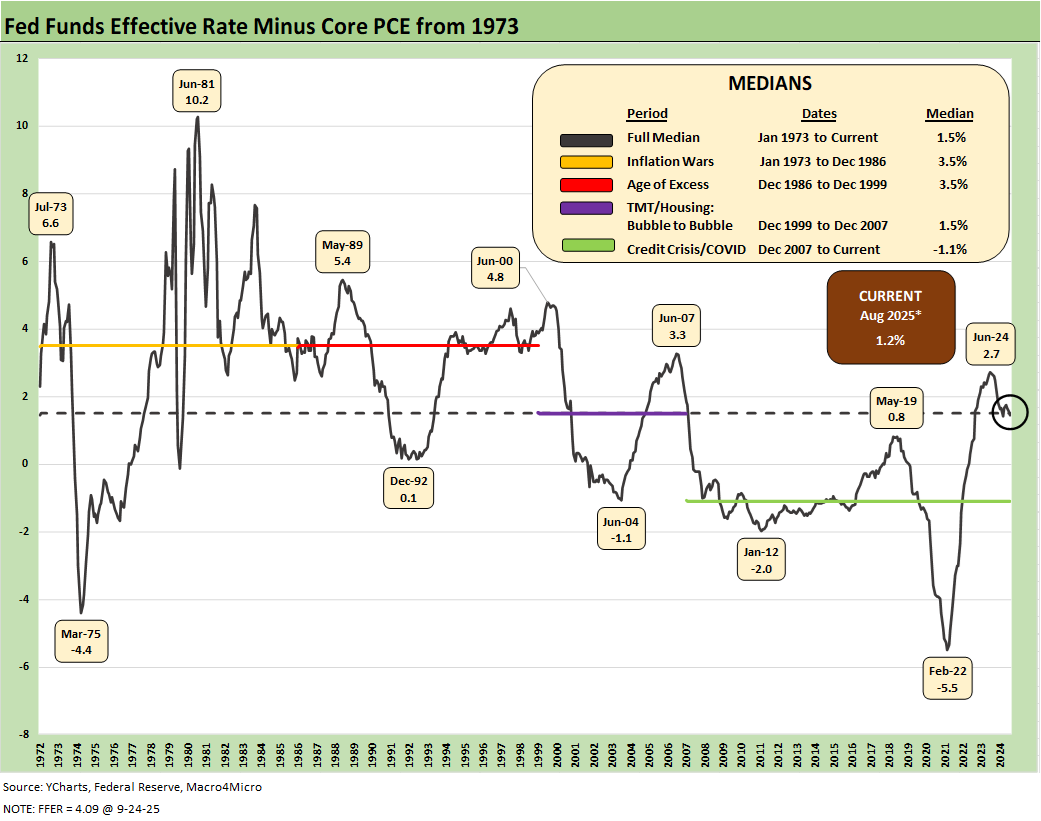
When we consider the level of tightening that could guard the system against a return to the stagflation of 1980-1982 or 1973-1975, the relationship of fed funds to PCE (or CPI) is critical in terms of the Fed mission. So, given the fact that Trump wants to cut fed funds by 300 bps (give or take 25 bps with the recent cut), the above chart does tell a story.
The “fed funds minus Core PCE” differential since 1973 provides a read on “real fed funds” and to what extent the Fed is engaged in “real” tightening as opposed to the “closet accommodation” that we saw in much of 2H22 when tightening was moving into higher gear but badly lagging inflation. Trump is calling for meaningfully negative real fed funds.
The long-term differential is +1.5%, and the differential now is +1.2%. That leaves room for easing, but the final judgement on actions comes down to how you see the tariff threats, the supply vs. demand side of the equation for goods, payroll economics and inflation expectations, and what that might mean for stagflation risk.
A glance back at the stagflation years of periods such as 1973 or 1981 and the various
“prevent defense” moves of the 1980s remind us how aggressive the Fed felt it needed to be. The idea that Trump would put in a Fed head with negligible experience and a few short stays at a handful of organizations (including one right wing activist group) is similar to what he has planned for the BLS. The stakes for the Fed are dramatically higher than for the BLS, which is bad enough (see Happiness is Doing Your Own Report Card 8-1-25).
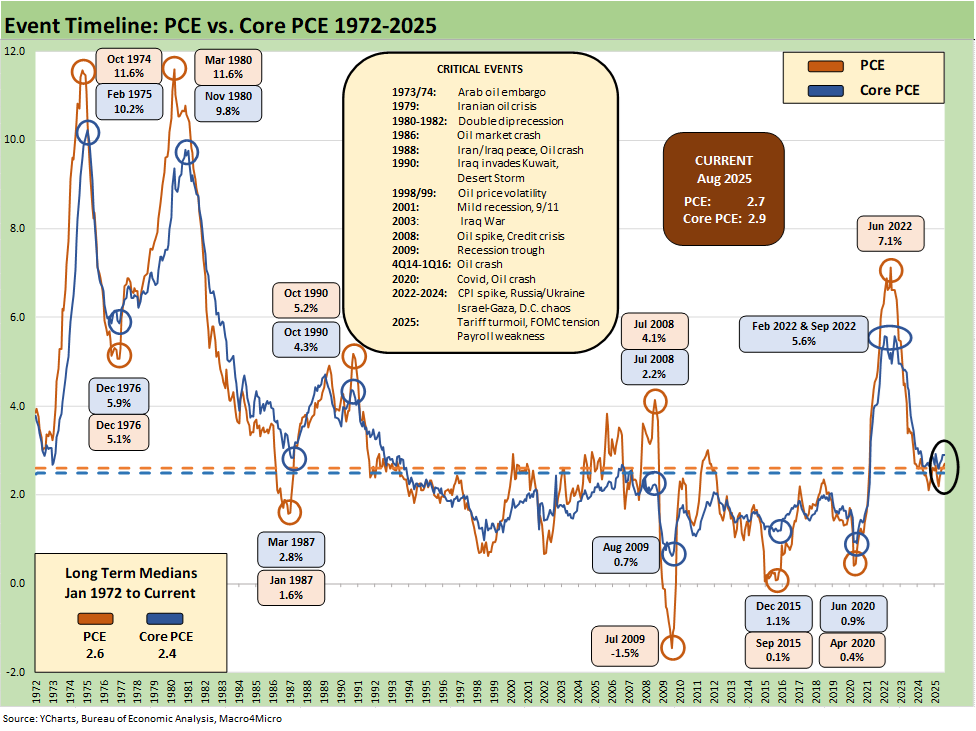
The above chart updates the long-term time series from 1972 for PCE vs. Core PCE across the decades and cycles. We see the 2.6% headline PCE long-term median in the lower left (below the current 2.7%) and the 2.4% core PCE median (vs. current 2.9%). That is dramatically better than where we came from in 2022 but still well above the 2.0% target.
The August 2025 PCE numbers are at reasonable levels in long-term context, but they just moved in the wrong direction again at a time when the FOMC is in a state of political turmoil and Fed leaders are under attack. The September SEP report and dot plot kept the PCE inflation forecast for 2025 unchanged from June at 3.0% headline and 3.1% core.
The dot plot and forecasts in September were not dovish by any stretch (see FOMC: Curve Scenarios Take Wing, Steepen for Now 9-17-25) and were not materially different from the June meeting (see FOMC Day: PCE Outlook Negative, GDP Expectations Grim 6-18-25).
The next set of Fed moves in October and December come at a time when Trump attacks on macro statistics and independent agencies is nothing short of alarming. The policy is now to attack the data when it is not supportive.
That rhetoric and actions in 2025 have so far been right out of the 1984 handbook but also in clear print in Project 2025, where the use of the term “like-minded” was a troubling euphemism that appeared to advocate consolidation, downsizing and purging for maximum White House control. It is not about increasing budgets, investing in tech, and maximizing the quality of data. It is about “like-minded” leaders controlling information. We have looked at those issues in separate commentaries.
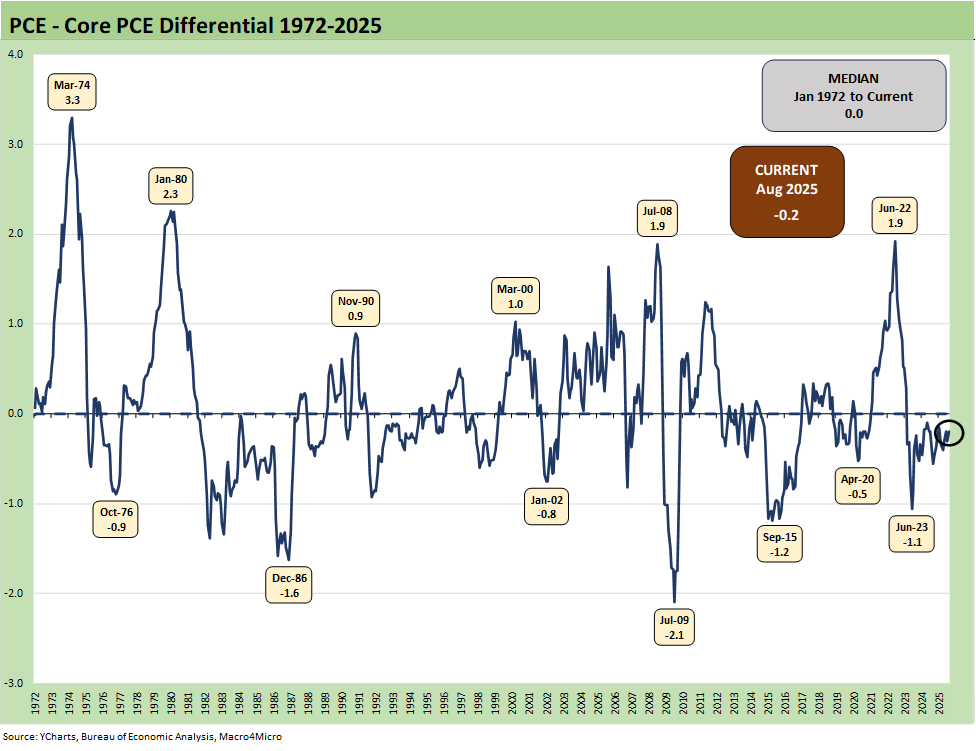
The above chart frames the long-term differential history between PCE and Core PCE since 1972. The long-term differential is zero and we currently stand at -0.2%. The volatility around that compressed long-term median ties into the energy wildcard with some food distortions also back in the 1970s. We look at some of the CPI energy and food inflation moves in separate commentaries (see Inflation: The Grocery Price Thing vs. Energy 12-16-24, Inflation Timelines: Cyclical Histories, Key CPI Buckets11-20-23).
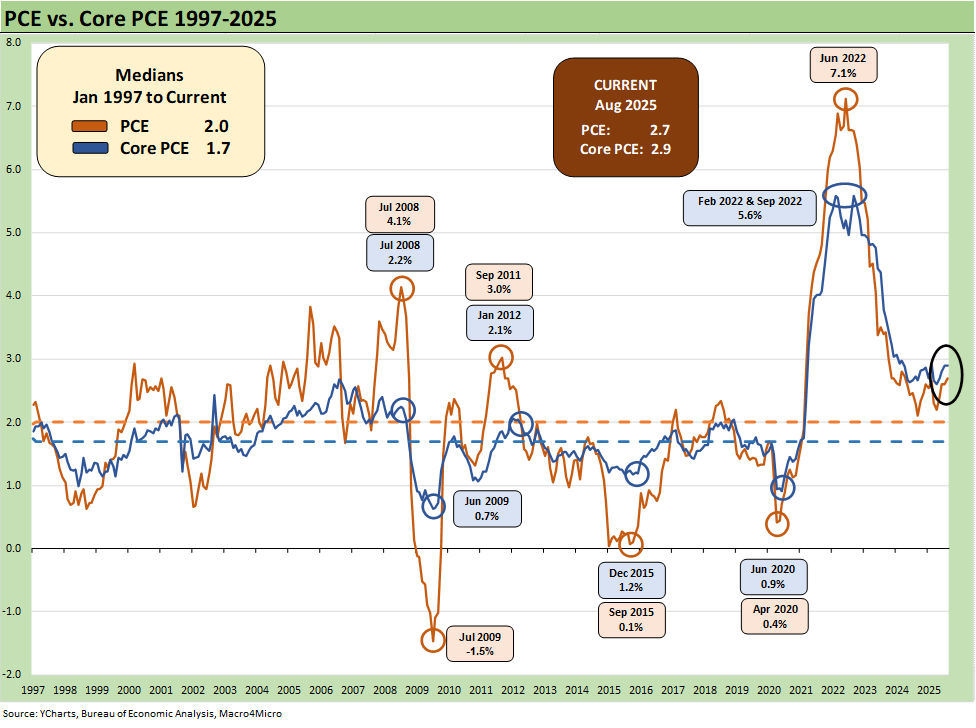
The above chart looks at a shorter timeline from 1997 to offer a better visual scale separate from the wild 1970s and 1980s. The recent days after Powell’s Jackson Hole speech restarted the debate in financial and economic circles around whether the target should be 2.5% or 3.0% or in some range. The above chart offers a reminder of how hard it is to get to 2.0% or below for headline PCE or Core PCE. The price chart covering the timeline from the inflationary/stagflationary periods of 1973 to 1982 hammer that home as well.
The “1997 to 2025” period shows a rare stretch at or below the 2.0% PCE line and Core PCE median. It took a lot to go wrong in that time horizon to cross that 2.0% threshold. The events along the way included tech bubbles bursting in 2000-2001, oil crashes in the late 1990s and the late 2014 to early 2016 period, and a systemic bank system crisis from 2008 to 2011 (including sovereign stress) to get us there. The COVID pandemic was a new one for the modern capital markets.
In the above timeline, we even see deflation in the post-crisis recession trough in mid-2009. The collapse in oil prices in late 2015 and then the COVID impact in 2020 gave an assist to low PCE. Oil is a big headline mover whenever there is a sharp decline or spike, and we have had plenty of both.
It is interesting that the topic of the Feb 2022 invasion of Ukraine and ensuing oil and gas spike never seem to find a way into the Trump and MAGA rhetoric on inflation in 2022. That was a major factor in inflation, but the economic reality did not serve the domestic political priorities. The Biden policies and stimulus definitely had a major inflationary impact on pricing and supply-demand imbalances after COVID. That is also the case with the Russian invasion of Ukraine. Energy has been in deflation mode for most of 2025, and that has helped dampen the inflation headline numbers.
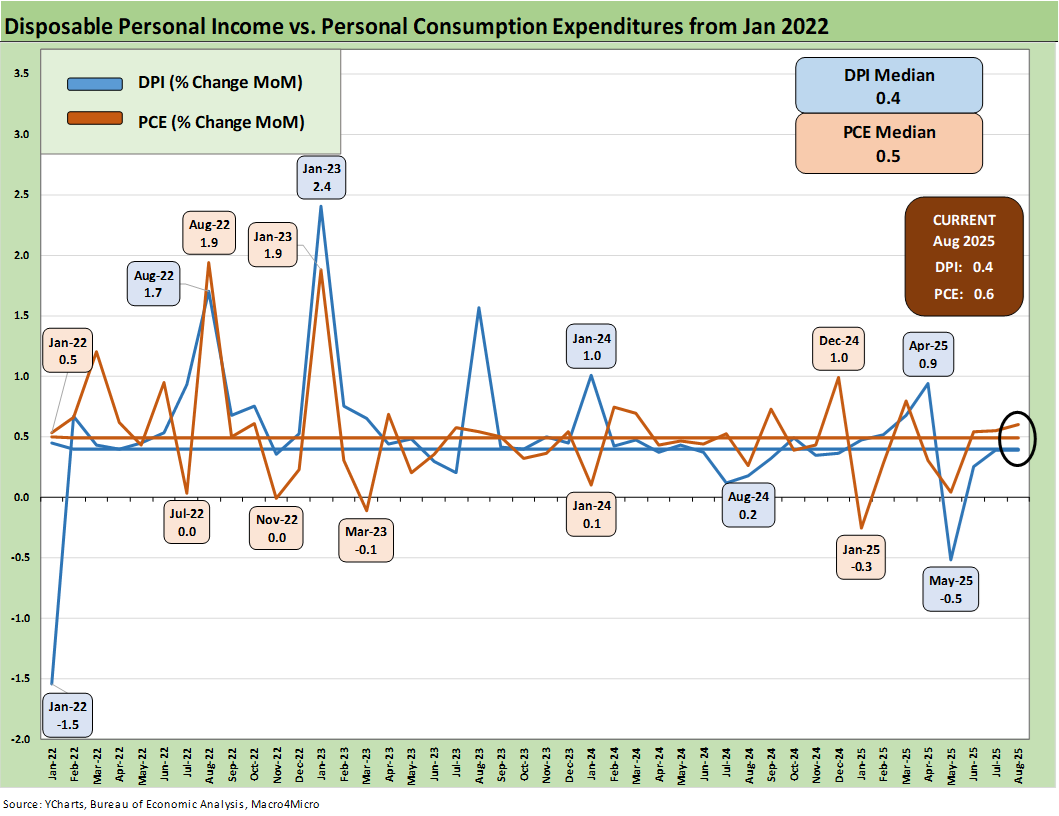
The above chart covers the time horizon for DPI vs. PCE from early 2022 as the tightening cycle kicked into gear after March 2022. Life in Jan 2022 was still quiet for Disposable Personal Income. We like to include this and the following chart just given the heavy mix of disinformation and politically axed story lines.
Looking back before the start of this chart, the 2021 period was a big macro rebound in GDP off the COVID peak period. The strong macro backdrop in 2021 and heavy dose of fiscal accommodation did not mesh well with residual supply-side shortages in goods broadly as 2022 saw the end of ZIRP and a material inflation spike.
Oil was a problem after the Putin invasion of Ukraine in late Feb 2022, and inflation hit a high in June 2022 at +9.1% for CPI as a headline grabber (headline PCE at +7.1% in June 2022) before the steady inflation slide to current rates. Core PCE had dueling peaks at +5.6% for Feb 2022 and Sept 2022.
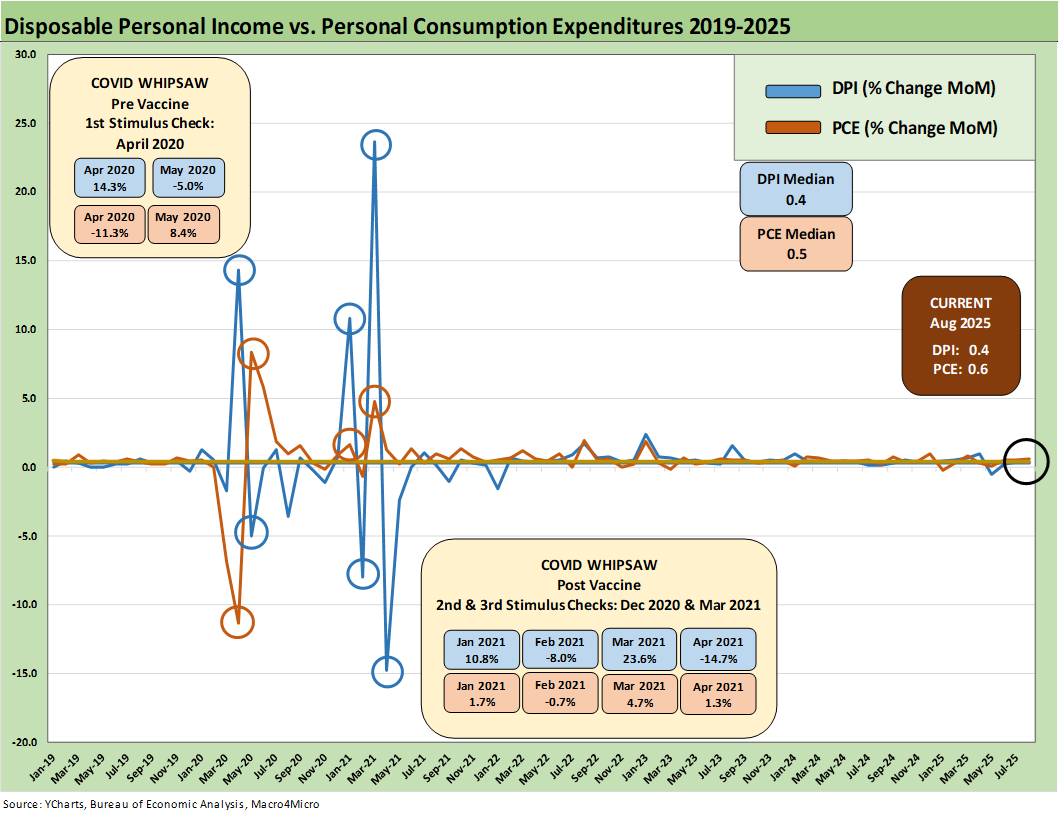
The above chart plots MoM Disposable Personal Income vs. PCE and offers a read on how wild things got during and right after the pandemic peak. This is a chart we use each month to revisit the DPI swings that came with the three COVID relief/stimulus packages. That included two under Trump and one under Biden.
As a reminder, Trump signed the CARES Act in March 2020 (shows up in the DPI in April 2020) and Trump also signed the Dec 2020 legislation disbursed in Jan 2021 (Trump seldom mentioned that Dec 2020 one since it was easier to blame Biden and Powell). Biden signed the America Rescue Plan (disbursed in March 2021) that was a demand pile-on (we would argue over the-top-stimulus) in a supply-constrained environment (thus inflation). The DPI and PCE wave tied to each of those shows up in the chart above.
As a reminder, the COVID vaccine was announced in early Nov 2020 just ahead of two stimulus actions. That was soon to be a factor in PCE patterns and lag effects. The quarterly GDP numbers in 2021 on the post-COVID bounce were numbers generally not seen since the Reagan and Clinton years (see Presidential GDP Dance Off: Clinton vs. Trump 7-27-24, Presidential GDP Dance Off: Reagan vs. Trump 7-27-24).
COVID was a distinct period for supply chains and supply-demand imbalances. With tariffs and potential trade wars, it will remain important to look for similar imbalances whether in narrow product categories or in broad commodities and materials areas. So far, the major trade partners have not initiated much in retaliation with the exception of a brief China spat. That has mitigated the damage but that de facto submission could come back to haunt some major trade partners if others run for office with a “get tough” election pitch.
Jacking up aluminum, steel, copper on the materials side and seeking even more tariffs on lumber is not a great idea for keeping prices and costs contained. Auto tariffs in Section 232 are extreme even after the array of “deals” and could go higher if the USMCA breaks down in 2026. We saw semis, pharma, and aircraft/engines/parts added to the Section 232 pipeline although most of the aircraft/parts risk was mitigated in EU talks. This past week brough commercial vehicles, branded pharma, cabinets, and a range of targets on national security grounds including upholstered furniture (making the world safe for couch potatos.)
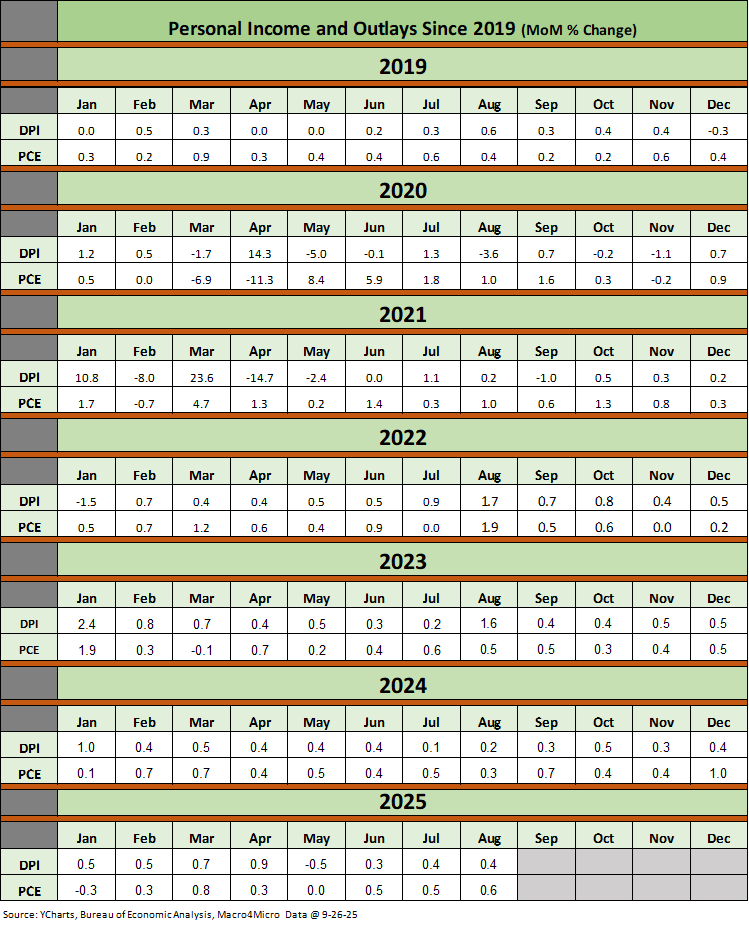
The above table plots the monthly Disposable Personal Income MoM change numbers vs. the Personal Consumption Expenditure numbers across the years from 2019 through Aug 2025. It is an easy scan across key time periods for a look at turning points in DPI (e.g. stimulus payments) or PCE. We rolled in waves of revisions in this month’s updates.
One exercise to do from time to time is to look at Table 1 in the monthly “PCE release” for the granular dollar amount on each line. The line items can sometimes show some volatility. We like to look for gaps between DPI and PCE and moves in Personal Savings.
Any reader of Table 1 can simply tick off which lines might come under pressure in coming months. Examples include expense lines such as Medicaid (post tax bill) or durable goods that face tariffs.
It is always worth remembering that a tariff is a regressive tax that hits lower income consumers harder and the same for small businesses. The same is true in Medicaid costs based on the income brackets of Medicaid users. A loss of health care benefits and higher pharma costs is a zero-sum game with other consumption lines.
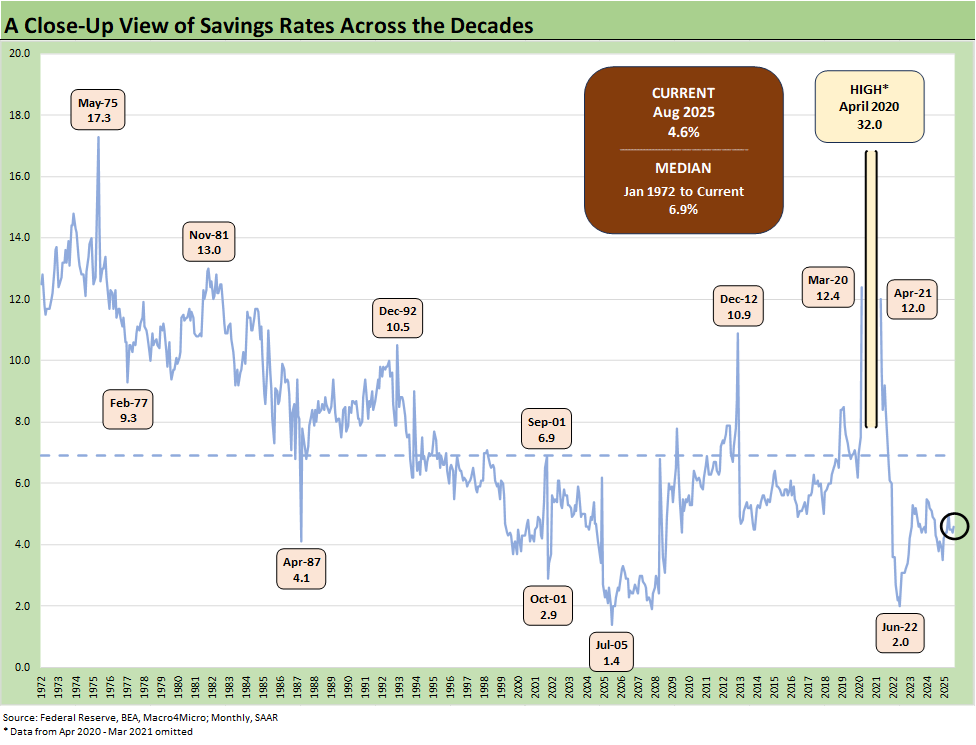
The above chart updates the savings rate history with the latest number ticking down MoM to 4.6% from a revised 4.8% and after a 2025 peak in April of 5.7% (as revised). We have looked at the savings rate dynamics in earlier commentaries (see Savings Rates: Context Across the Cycles 10-27-23). Savings rates peak in times of worry (occasionally panic) as evident in the chart above.
The period leading into May 1975 was no picnic after the massive stagflation bout and the same was true in Nov 1981. Dec 1992 had a raft of issues as the commercial real estate bubble was bursting (and hammering some banks), the leveraged finance boom was on the back end of the default cycle, the thrift crisis effects were still playing out across some major regional economies (notably TX and CA), and the regional oil patch pain that had come home to roost in 1987-1990 was lingering.
As we head into months of debate around tariff effects, it is important to get below the headline numbers and dig into the product line trends to gauge sequential pressures on purchasing power and consumer side effects.
See also:
Durable Goods Aug 2025: Core Demand Stays Steady 9-25-25
2Q25 GDP Final Estimate: Big Upward Revision 9-25-25
New Homes Sales Aug 2025: Surprise Bounce, Revisions Ahead? 9-25-25
Credit Markets: IG Spreads Back in the Clinton Zone 9-22-25
The Curve: FOMC Takes the Slow Road 9-21-25
Market Commentary: Asset Returns 9-21-25
Mini Market Lookback: Easy Street 9-20-25
FOMC: Curve Scenarios Take Wing, Steepen for Now 9-17-25
Home Starts August 2025: Bad News for Starts 9-17-25
Industrial Production Aug 2025: Capacity Utilization 9-16-25
Retail Sales Aug 2025: Resilience with Fraying Edges 9-16-25
Credit Markets: Quality Spread Compression Continues 9-14-25
The Curve: FOMC Balancing Act 9-14-25
Footnotes & Flashbacks: Asset Returns 9-14-25
Mini Market Lookback: Ugly Week in America, Mild in Markets 9-13-25
CPI August 2025: Slow Burn or Fleeting Adjustment? 9-11-25
PPI Aug 2025: For my next trick… 9-10-25
Mini Market Lookback: Job Trends Worst Since COVID 9-6-25
Payrolls Aug 2025: Into the Weeds 9-5-25
Employment August 2025: Payroll Flight 9-5-25
JOLTS July 2025: Job Market Softening, Not Retrenching 9-3-25
Hertz Update: Viable Balance Sheet a Long Way Off 9-3-25
Mini Market Lookback: Tariffs Back on Front Burner 8-30-25