
Employment Sept 2025: In Data We Trust
A good headline number for Sept payroll but one that is less impressive in occupational mix.


Affordability better. Inflation lower. Jobs booming. Greatest ever.
The headline Sept payroll adds of +119K ease some bearish signals of late. The belated payroll release brings us closer to more inputs on how the consumer and the cycle are faring, but 4Q25 data is the real story after such mixed results including two negative months.
The uptick to a 4.4% unemployment rate in Sept (from 4.3% in August) in the Household Survey comes after a +219K increase in the total unemployed to 7.6 million unemployed (Summary Table A). That is above 7.38 million in Aug, 7.24 million in July, and the 7.01million unemployed and for YoY the 6.9 million in Sept 2024. The civilian labor force rose by 470K to 171.2 million and the participation rate rose by +0.1% to 62.4%. The 4.4% unemployment rate (7,603K/171,248K = 4.4%) is still strong in historical context. The total employed in the labor force rose by 251K to 163.6 million.
The “U Family” (U-1 through U-6, Table A-15) all ticked higher from August except for the structural underemployment indicator of the U-6, which moves from 8.1% to 8.0%. That U-6 is still above 7.7% in Sept 2024 and 7.5% where 2025 began.
Manufacturing was down again by -6K from August 2025 and down by -94K vs. Sept 2024. Durable Goods was also down by -4K MoM but down by -79K YoY vs. Sept 2024.
Services occupations totaled +87K in job adds with Healthcare and Social Assistance higher by over +57K and Leisure and Hospitality higher by +47K. While higher jobs are good news, those categories are not the bucket we would call “multiplier effect” jobs such as manufacturing that bring a broader supplier chain and address the foundation of the Trump tariff plan. At the same time, Transportation and Warehousing is down by -25.3K in what is not a bullish cyclical signal.
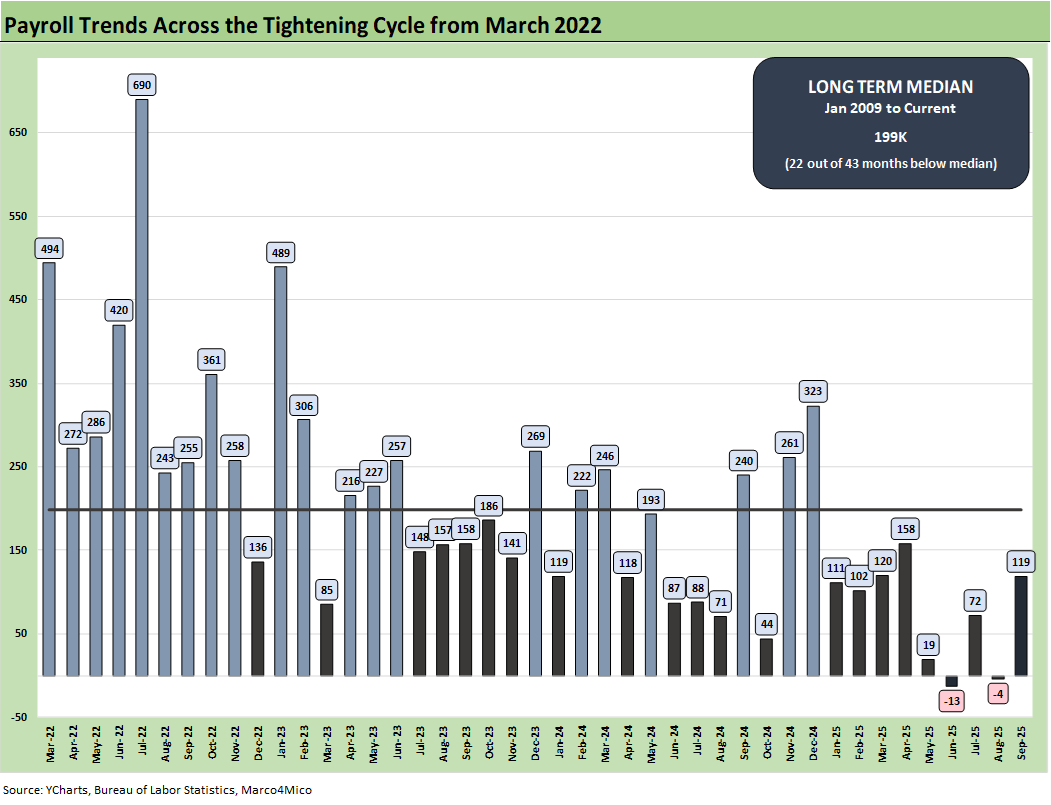
The monthly payroll adds/declines chart above tells an objective data story. The timeline covered starts with the beginning of the tightening cycle in March 2022. We also include a median line (median from Jan 2009). Every month since January 2025 is below the median. That doesn’t exactly jive with Trump’s description of his term so far as the “greatest in Presidential history.”
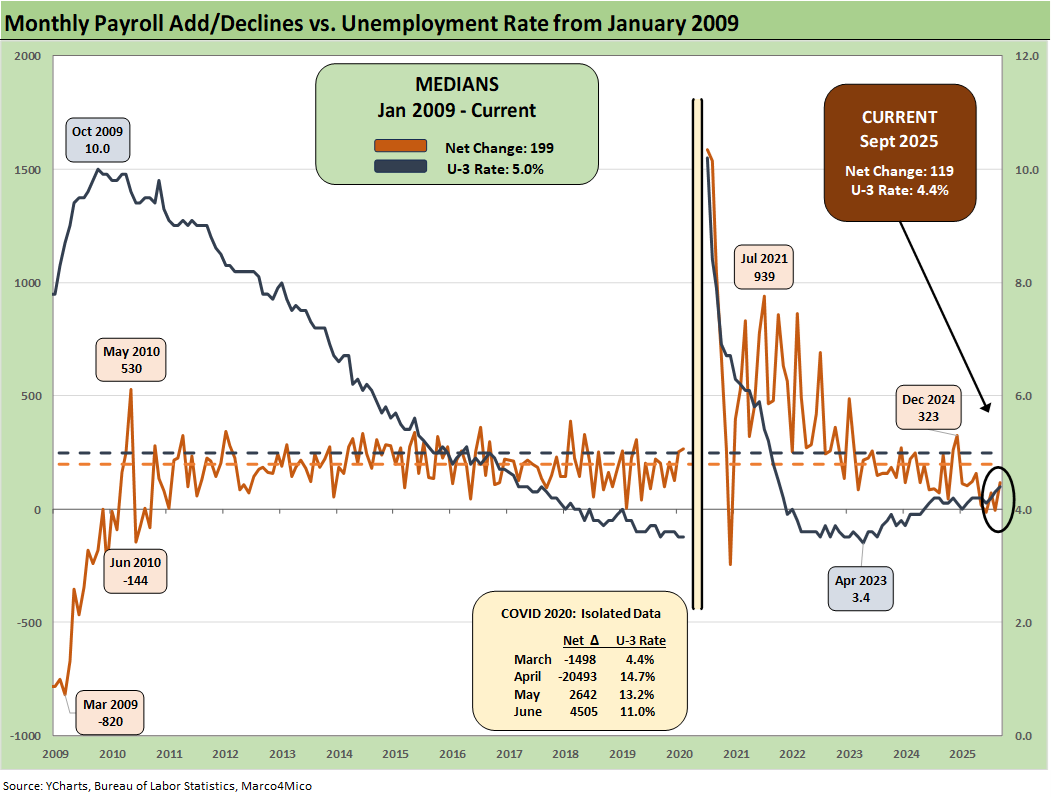
The above chart plots the running job adds/declines since Jan 2009 against the unemployment rate, which ticked higher to 4.4% from 4.3% MoM. We isolate the worst months of the COVID dislocations in the above box for better visuals to capture the other periods.
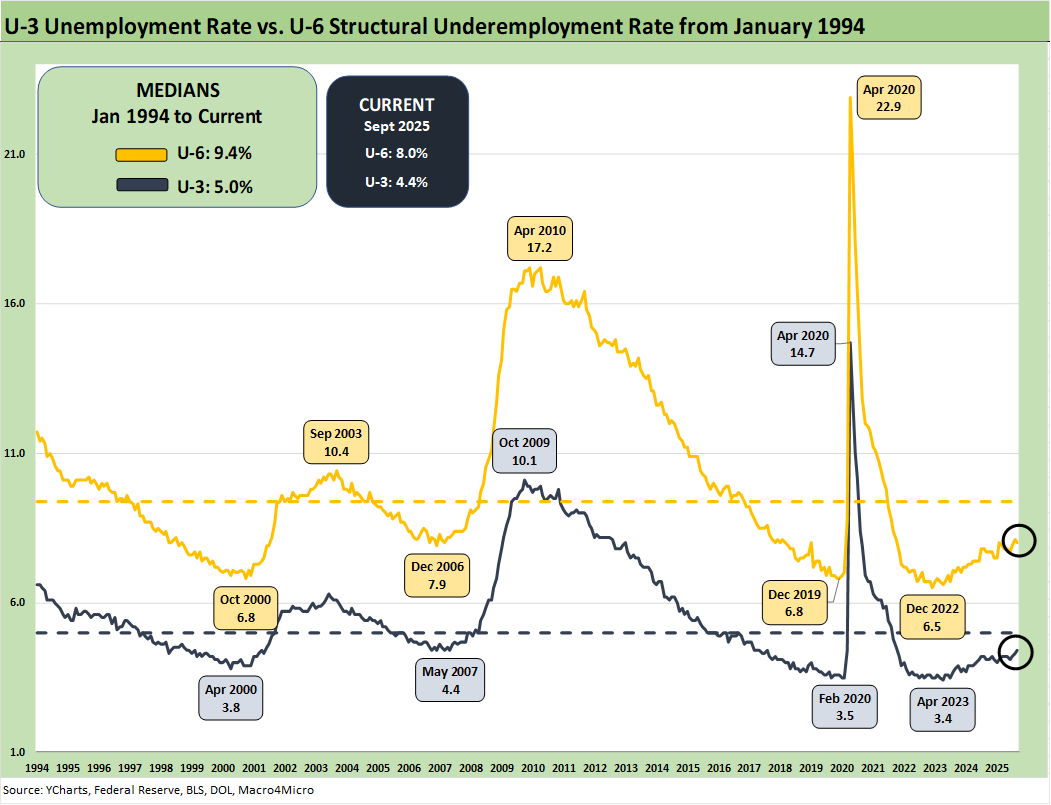
The above chart updates the time series for the U-3 unemployment rate and U-6 structural underemployment rate across the years from 1994. The current U-3 rate ticked higher to +4.4% in Sept. As a reminder, the U-6 metric is defined with the numerator as “total unemployed + persons marginally attached to the labor force + total employed part time for economic reasons.” The denominator is “civilian labor force + workers marginally attached to the labor force.”
The U-6 ticked lower to 8.0% from 8.1%, still up from 7.9% in July and 7.7% in June. The U-6 rose sharply in Feb 2025 to 8.0% from 7.5% in Jan 2025. The current 8.0% is well above the 6% handles seen in spring of 2023. The U-6 is also up from the 7.7% level of last year during Sept 2024. The 8.0% U-6 is below the median from 1994 of +9.4%. That 9.4% includes the post-crisis shock and the longest recession since the Great Depression.
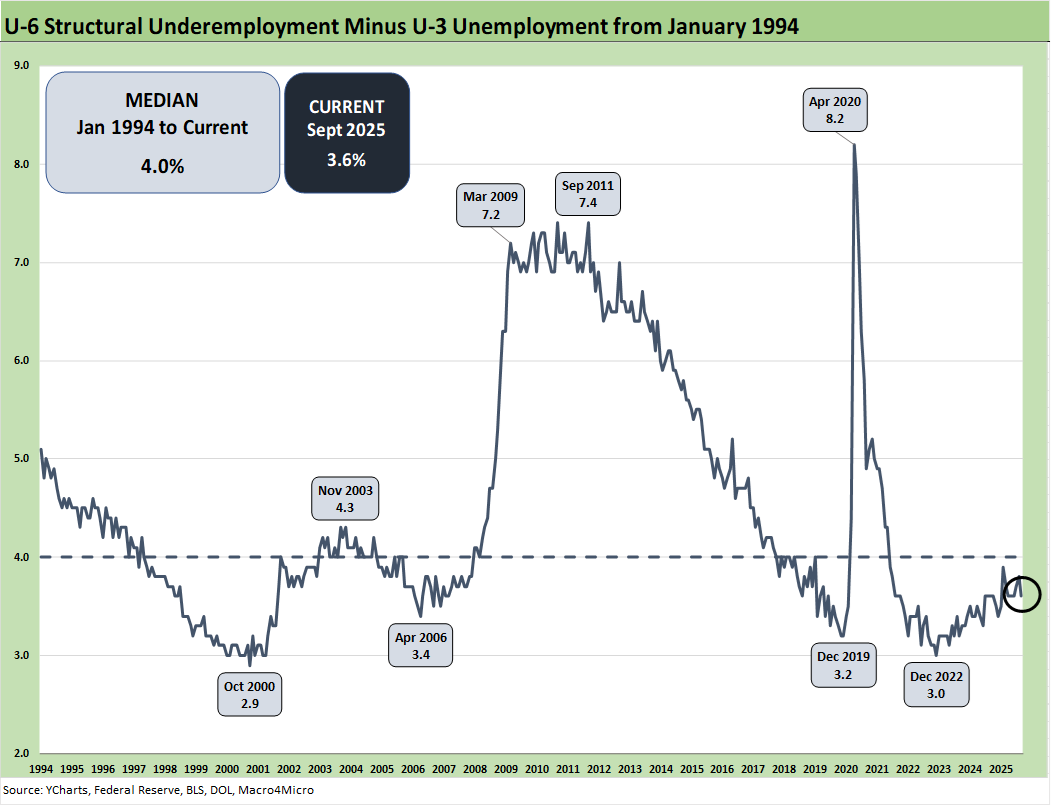
The time series above updates the U-6 minus U-3 differential as a measure of relative employment quality and to flag risks of major dislocations in large swaths of the economy (think oil patch in the late 1980s, tech bubble imploding 2001-2003, financial services and automotive in 2009).
The current 3.6% differential is below the long-term median of 4.0%. The job ranks are weakening now but are also in a mixed period where tariffs are still getting worked out with trade partners and the courts. Many questions will get answers with respect to how tariffs will flow into working capital cycles and new capacity planning. For example, we are seeing major planning to relocate automotive OEM capacity back to the US. That should attract more supplier chain capex. In contrast, the idea of a major new aluminum smelter in the US will not happen based on economics and the timeline to build one. There are a lot of stories along the manufacturing chains.
Some of the risk issues get swept up in immigration and deportation numbers, but the analysis always comes back to the number of workers with paychecks. Employers will be making decisions to mitigate the tariff damage if they are not passing along the cost in prices or want to limit the scale of the price increase to customers. There is no hiding from the need for economic reactions along the supplier-to-customer ecosystem. Someone always pays – including those paying with their employment in tariff cost mitigation decisions.
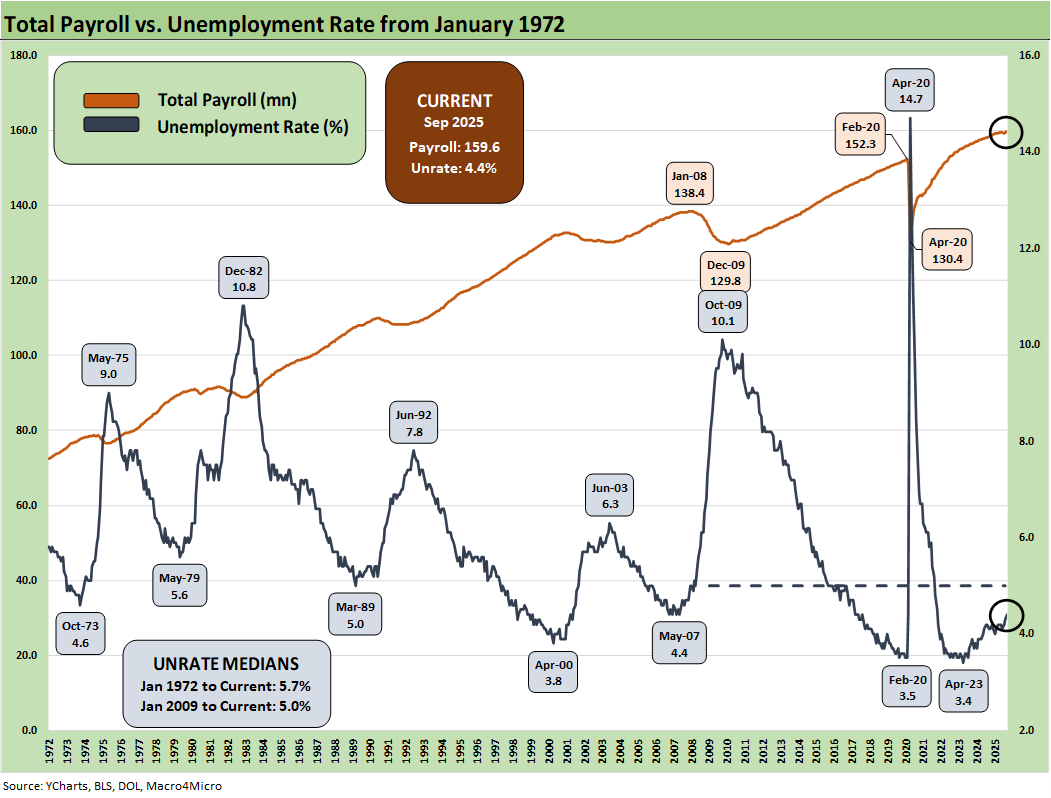
The above chart updates total payroll vs. the unemployment rate. More bodies with more paychecks is always by definition a good thing. The trick from here is how the consumer deploys that paycheck and whether the zero-sum realities of household budgets undercuts spending range.
We had been seeing reasonably better trends in consumer income and consumption in the monthly PCE releases, but the market awaits more data. The 2Q25 GDP growth numbers failed to inspire in the consumer metric despite some upward revisions (see 2Q25 GDP: Second Estimate, Updated Distortion Lines 8-28-25). That followed similar weakness in 1Q25 GDP (see 1Q25 GDP: Final Estimate, Consumer Fade 6-26-25). We do not have 3Q25 GDP data yet.
Soft survey numbers for consumers remain an area of focus even with UMich consumer sentiment almost barely missing an all-time low the past month. They had climbed for a while after the worst of the post-Liberation Day nerves and China trade worries but are fading again. The consumer still has ample reasons to get defensive and push saving rates higher than what we have seen in the monthly PCE numbers.
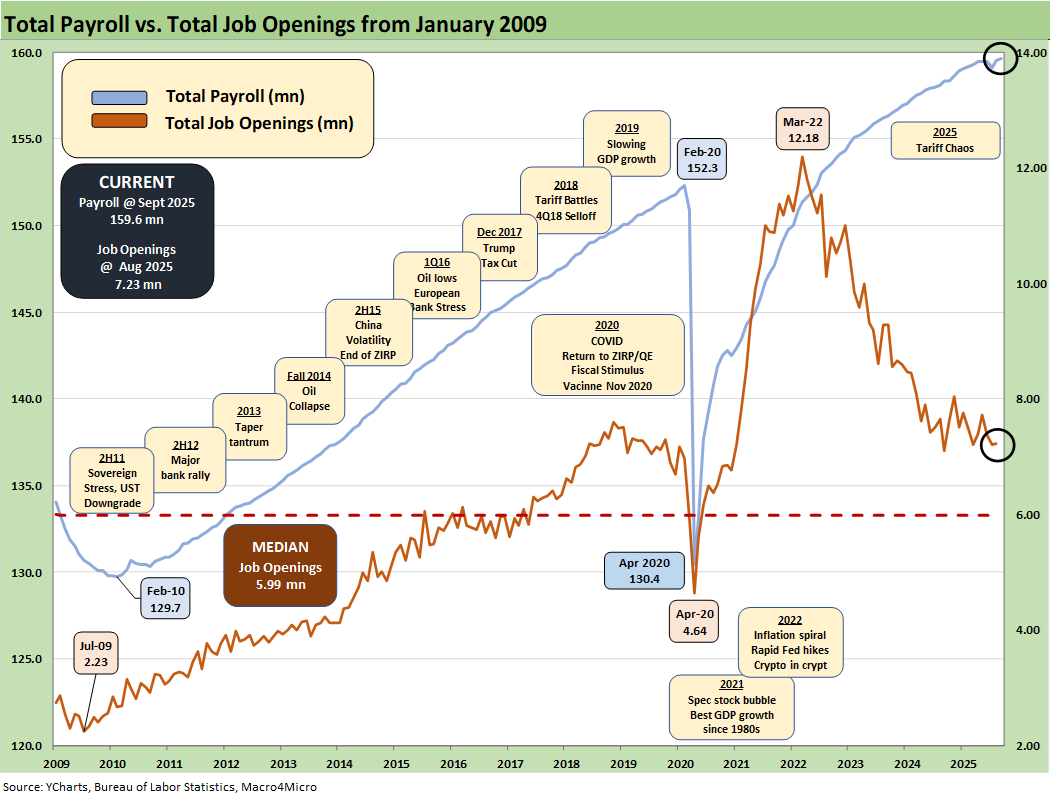
The above chart updates the total payroll number vs. job openings. The most recent JOLTS numbers have been unimpressive (JOLTS Aug 2025: Tough math when “total unemployed > job openings” see 9-30-25). We will need to wait for more timely JOLTS data.
The management teams have a lot of moving parts to factor into guidance whether quantitative or qualitative and now from the final IEEPA decision from SCOTUS to the fallout in consumer spending from health care premium increases to retrenchments in SNAP spending and eligibility criteria.
The color in trade literature and in economic releases such as the Beige Book that drill down into the weeds are clearly signaling the tariffs are a major problem. The GOP also saw some empirical evidence in the recent elections and moves to roll in tariff exemptions without offering a confession stating that “buyer pays.”
For some (notably retail and many small businesses), the tariff threat can be existential. The cash drain in “writing the tariff check” and the hit to earnings from the expense line can impair trade credit and fuel bank credit problems for small businesses that are the backbone of payroll counts in the US. The payroll impact is already showing up. As noted in the chart at the top of the commentary, negative payroll months stand out in a time series where the White House has been touting the “greatest first 8 months” (now 9 in payroll data) “in Presidential History.”
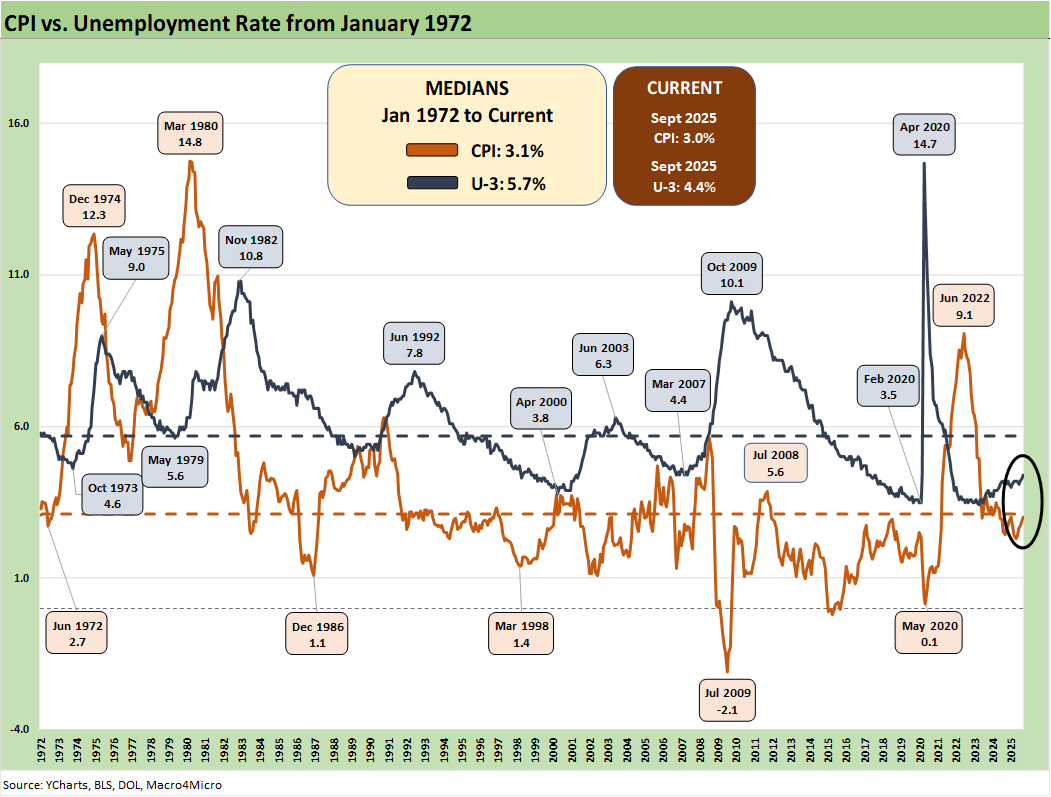
Inflation reports had generally brought good news relative to expectations given the scale of the forward threat and lagging effects to be seen across working capital cycles. That said, the inflation creep and affordability strain is clearly in evidence and taking a toll on inflation by product groups are showing up in the data with more to come (see Simplifying the Affordability Question 11-11-25, CPI September 2025: Headline Up, Core Down 10-24-25).