
Retail Gasoline Prices: Biblical Power to Control Global Commodities
We look at national averages retail prices for regular gasoline. Numbers and facts matter.


Let my oil prices go…
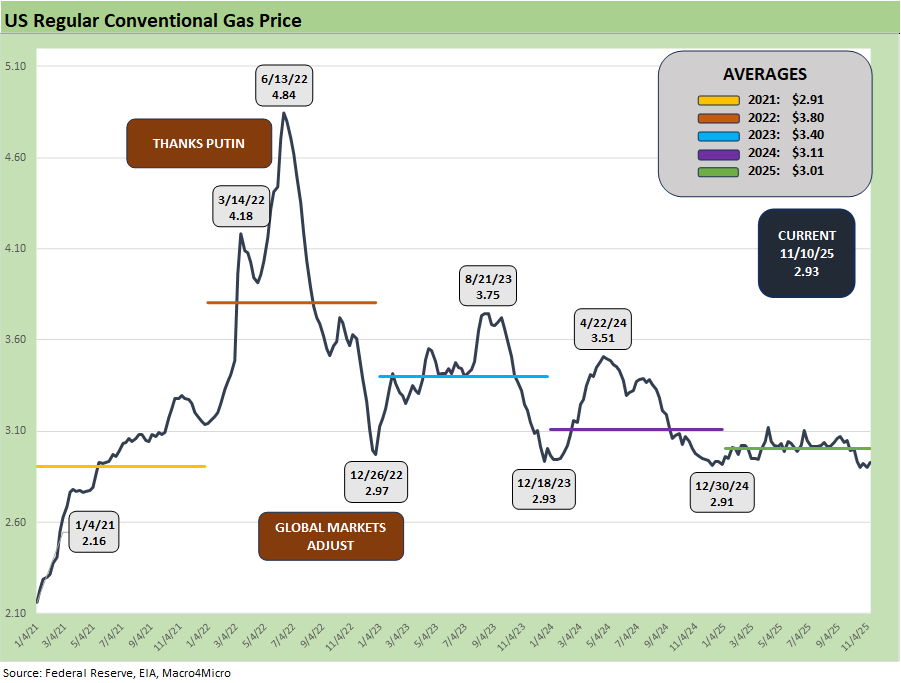
We look back across recent periods for retail gasoline prices given recent White House efforts to extol their retail gasoline performance. Retail gasoline prices have been very steady in 2025 but also on top of where the price was in Dec 2024. In other words, there has been little “improvement” from where the year began, so absence of bad news is good news.
As we look back across time, any US President who cites their ability to materially influence global supply-demand balances for oil over the course of a year have a very heavy burden of proof (as in it’s BS).
Beware when political leaders cite their mastery of retail gasoline but cannot articulate the OPEC supply policies, relevant production trends domestically, or simply ignore the demand side of the equation (China, US, EU).
Crude oil declines across 2025 have been hard on energy subsectors in the equity markets with the broad Energy ETF (XLE) and E&P ETF (XOP) among the bottom tier performers (see Market Commetary: Asset Returns 11-9-25). Oil price weakness has reflected supply threats from OPEC and record production in the US and Canada, which together have kept oil cost inputs in check for refiners. Major refiner equities (VLO, PSX, MPC) have trounced E&P operators on the soft crude oil prices.
Retail Gasoline Prices: Numbers, Not Adjectives
The above chart frames the weekly average US retail regular gasoline prices from the start of 2021 through current levels (Nov 2025). As we cover in our monthly CPI commentaries, the cost of gasoline, electricity, and utility piped gas is an important part of household budgets. The political spin by Trump on energy after the election setbacks is taking more than a few liberties with describing how the new team and new term has done on affordability.
In the unfolding affordability disinformation wars, the White House is running fast and loose on the facts of gasoline prices since 2021. We are still waiting for Trump to use the word PUTIN in the 2022 inflation story line, but we all know that is not happening.
The recent cycles of pain and gain in the oil and gas market have been stunning across the cycles. Multiple spikes from 1973-1974 and 1979-1981 culminated in a 1986 oil crash as global supply adjusted. After a debt-financed technology revolution (unconventional drilling, shale boom, etc.), a record number of bankruptcies shocked the markets from late 2014 into a multiyear stretch of credit pain. With that history, it is hard not to roll your eyes when someone says they can control the oil price trends from the White House.
Using recent gasoline prices to self-evaluate on affordability…
Current oil and gasoline prices are not a mystery, but they get turned into points of confusion in all the blather. Retail gasoline prices have been in a narrow range in 2025 and are essentially on top of where December 2024 ended. A lot of factors can go into how retail gasoline prices frame up around costs of feedstock “on the way in” (supply of oil) and also on the demand side (economic growth) and how that all translates into the pump price and other energy markets. For now, stability is a good thing in the macro story.
There obviously are a lot of problems in the qualitative dialogue around inflation levels narrowly and the concept of affordability more broadly. In the end, the self-congratulations have a political purpose. The question always comes back to the starting point of “What are the numbers as of now? What were they at the beginning?” We detail the price trends in gasoline in the charts herein. There has been no damage done YTD with Nov 2025 prices much like Dec 2024. “Absence of bad news” in gasoline is thus good news for consumers.
Inflation and affordability rages as the new debate (at least until we get new CPI data someday). Like tariffs and fact flow, the politics takes over. Earlier this week we looked at some simple factual questions (see Simplifying the Affordability Question (11-11-25). The reality is that inflation is getting moderately and steadily worse. Gasoline is at least helping, but that chart we reproduce below tells a story of “higher.”
Trump’s self-praise on affordability begs a simple question:
“Which CPI line items from the BLS report are higher or lower (in the latest CPI release for September 2025) relative to their respective CPI levels in Dec 2024 (Biden’s last full month?)”
Answer: Gasoline CPI was better in Dec 2024 than in Sept 2025 but both were good months with deflation.
As detailed in the next chart, which is a replay of the chart from the earlier piece, we see some of the inflationary pressures that need to be considered by the FOMC in December and again in the coming year in fed funds decisions. The FedWatch odds of a cut is now close to a toss-up with 50.7% probability as we go to print.
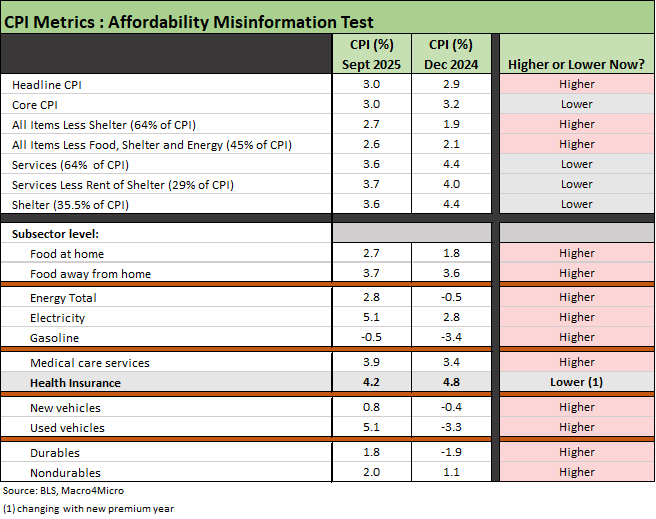
Our favorite line item above for a broad inflation focus is “All items less Shelter” (35% of the CPI index). As you can see in the chart, that number is higher. As a reminder, shelter inflation is not measured by the price of new and existing home sales. Since the early 1980s, shelter is a theoretical “cost of shelter” derived from rents.
There is no shortage of timelines to look at in terms of MoM CPI sequential moves in such headline products as beef and coffee and various tariffed vegetables. We see broad categories above almost all higher in Sept 2025 than Dec 2024 with critical categories such as Food, Energy, Medical Care Services, New/Used Vehicles, Durables, and Nondurables (see CPI September 2025: Headline Up, Core Down 10-24-25, CPI August 2025: Slow Burn or Fleeting Adjustment? 9-11-25). The granular lines in food or a range of goods require looking at the sequential trends to show how tariffs have flowed into the pricing trends into 2025.
The fact that the White House now appears to be foot-dragging on revised and updated CPI and payroll numbers highlights an intent to reduce clarity in the economic indicators. Such updates should be a high priority.
The screen media needs some data 101 or some spine transplants…
The main point in updating some of these data points is that the mainstream media fumbles the ball on the factual side in pressing for responses to real numbers from the White House and team (notably Bessent, who is working the media to massage perspective). The latest exercise seems more about butchering the “affordability” topic after it was cited as a key driver of the election setbacks for the GOP.
The hesitancy to take on the topic with more substance is in part out of sheer fear of Trump, who has cowed them with threats to everything from their license to litigation to banning targeted media from White House Q&A. Even CNBC has “gone softball” given the great success they have had in picking up “guest share” in appearances by GOP dignitaries. They have been successfully squeezing Fox in that regard, so softball Q&A has been a winning strategy.
Energy: Electricity and Utilities Piped Gas
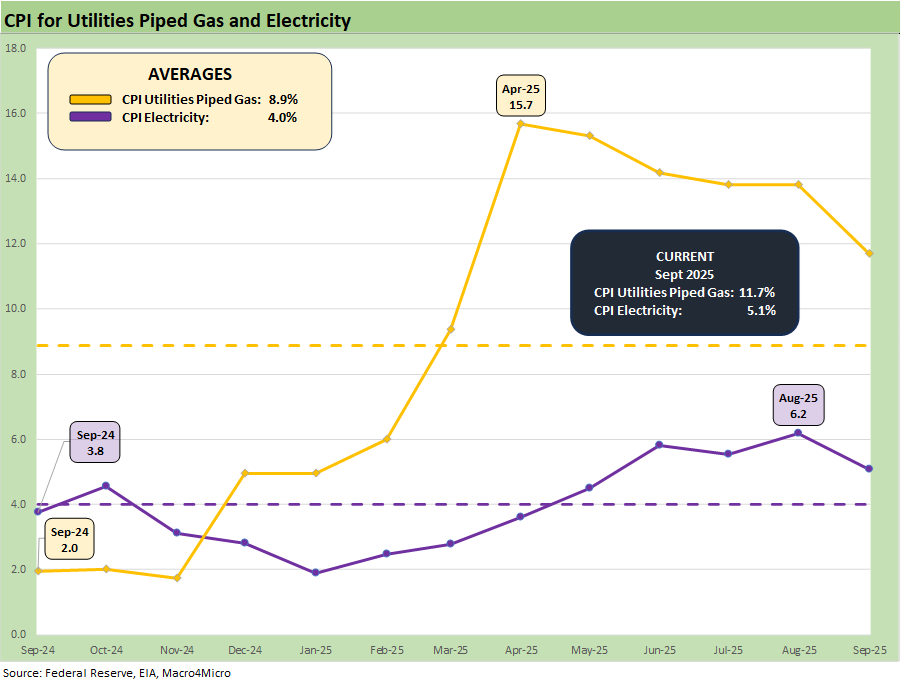
The other critical parts of Energy include Electricity, which is getting a lot more airtime now as a topic given AI demand and a data center boom. The Q&A lets Trump get away with mumbling about oil without fielding a question on electricity or utility gas. Both are certainly going the wrong way this year and weighing on the affordability pressures.
As we have covered in our CPI pieces and as highlighted in the chart below, the other pieces of the Energy CPI metrics are not as indexed to OPEC even if global oil and gas indirectly ties into many aspects of the downstream customer. The trend higher in prices since the end of 2024 is clear.
Gasoline prices as a key driver…
The final chart offers more history on retail gasoline prices. In periods of extreme oil price volatility, life can get tricky. We look at some of the worst years since 2007 below. 2025 has been relatively calm vs. a year such as 2022 or during the madness of late 2014 to early 2016 when the Saudi price war saw the HY market slammed and upstream names saw a multiyear streak of record high default rates. For refining, the checklist of feedstock costs, product mix, inventory cycles, seasonality (e.g. peak driving season, heating season, etc.) still are all at the mercy of the timing of any oil shocks. We have had more than a few since the early 1970s.
In the chart below we frame some oil and gasoline stories from earlier cycles when the market saw more than a $100 Hi-Lo swing in oil from 2007 to 2016. That period also experienced the wild ride of the Saudi oil price war of late 2014 to early 2016. The mini crash in late 2018 was about supply-demand imbalances while the stunning COVID crash of 2020 saw negative WTI futures by April 2020. For 2025, affordability for gasoline has been flat so far in Trump 2.0. We broke out the YTD average for each year from 2021 to 2025 below.
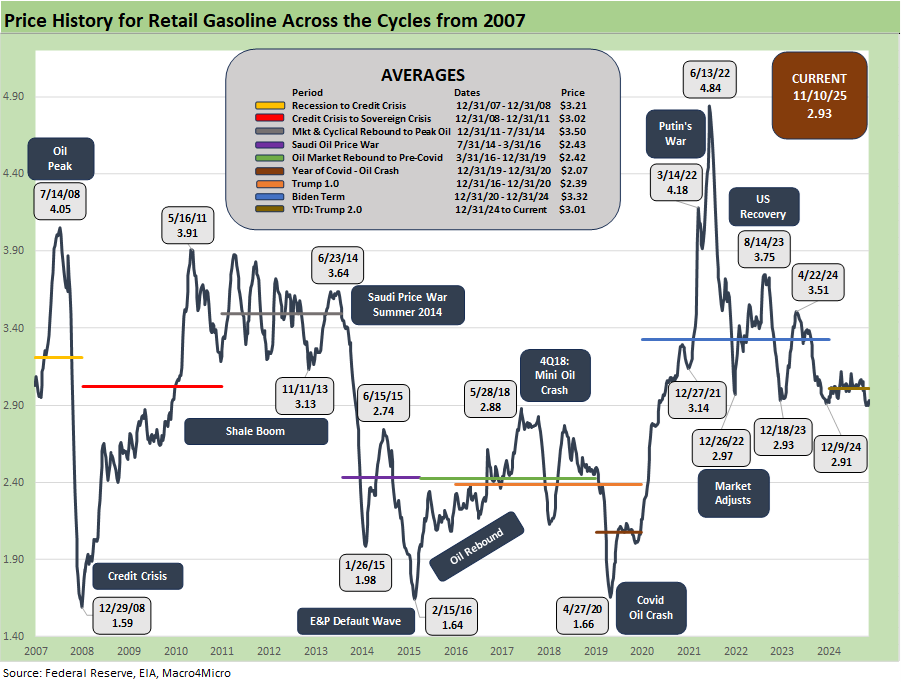
While low gasoline prices in the CPI index is a positive factor at this point for households, history shows a lot can happen in a hurry, and there is little that White House policy can do about it. The oil price crashes of bygone years (4Q14 to 1Q16, COVID) can operate as a de facto “consumer tax cut” even if it crushes some regional economies in the oil patch. Always remember that with volatility, crashes are very often followed by what seems like a spike. Similarly, a spike sees supply adjust.
The supply pressure bias is up to OPEC unless the US decides to fall into a full-blown trade war with Canada as a huge supplier of crude oil to the US. That latter risk would be crazy, but there is a “lot of crazy” going on these days.
We would again highlight that Energy inflation is higher in Sept 2025 than Dec 2024. That does not seem clear to many. Whether that is lower deflation in gasoline CPI in Sept 2025 or higher inflation overall in Total Energy, you can slice and dice the timelines and CPI subsector lines any way you want. Oil, natural gas, gasoline, electricity, and utility piped gas are all part of the cost equation. In total, those CPI lines are higher and part of the affordability problem.