
Mini Market Lookback: Event Risk Revisited 10-11-25
A week that started with shutdown variables in play ended with China trade anxiety spiking again and heightened tariff inflation fear.


Or is it just more of the same all at once?
The week saw equities cruising along until Friday while HY OAS backed up by +11 bps on Thursday before tacking on another +23 bps on Friday. HY pushed back above the +300 bps line to +318 bps (+38 bps on the week) and finally broke out of the June 2007 Hi-Lo range.
The latest China trade threats turned the tariff noise volume back up to high, and the potential disruption threats to trade, risk of supply-demand imbalances, and supplier-to-manufacturer production turmoil are all cause for alarm. These spats have typically calmed down with some talks, but a wide range of end markets (retailers, autos, pharma, etc.) could see supply restrictions cutting both ways in a lose-lose proposition. Trump is under siege on multiple fronts, and lashing out is the usual playbook.
The shutdown fallout continues with the Federal payroll cuts escalating, gold cracking the $4,000 level for the first time, and oil dipping below $59 (WTI) with an assist from Gaza War relief (supply) and the China trade tension (demand).
A sliver of good news might be seen in the prioritization of CPI data by the BLS for release on Oct 24 with the calling back of some workers. The cost-of-living adjustments (COLA) loom large for Social Security. With a China trade war back in play, inflation expectations and price pressures will return if we get back to the “empty shelves” scenario.
The stagflation debate at the Fed will get more serious with China tariffs rolling into the existing trend line. Inflation worries will now be joined by shutdown impacts and trade war multiplier effects. As we go to print, FedWatch saw the Oct meeting -25 bps odds rise 2 points over the week to 98.2% and the Dec 2025 FOMC odds rose around 5 points on the week to 91.7%.
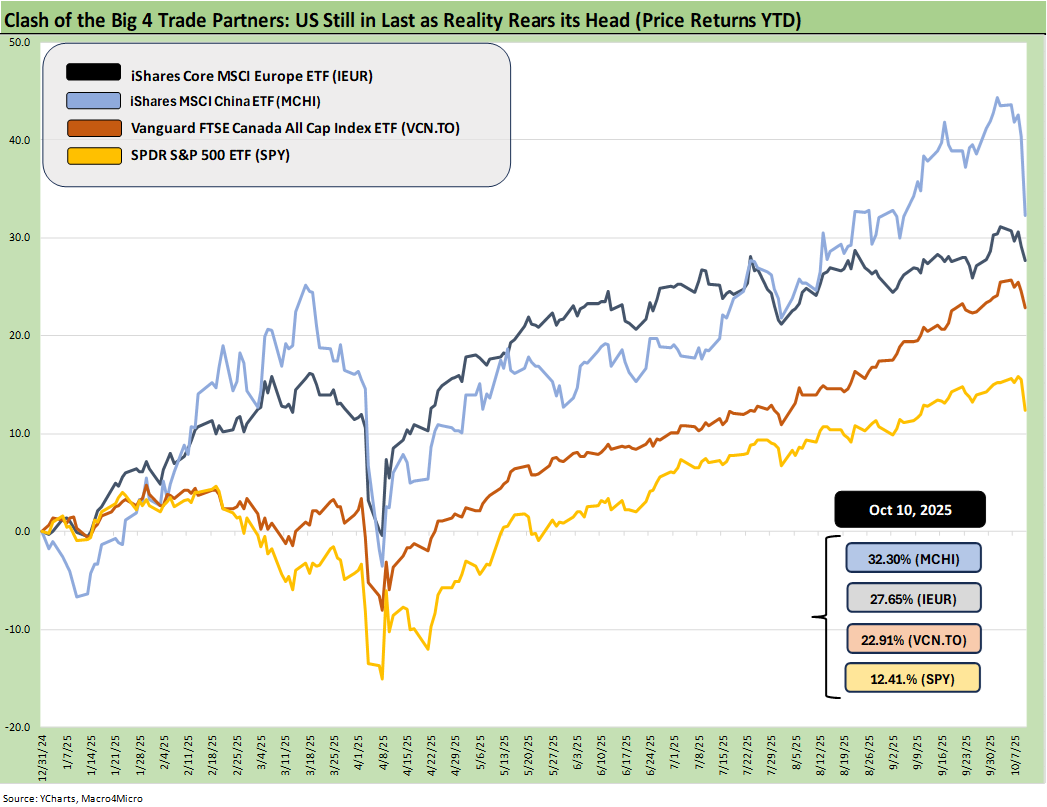
The above updates the YTD returns for some bellwether index ETFs for the Big 4 developed market trading partners – the US, Europe, China, and Canada. The aim of the chart is to plot some ETFs that tell a story for US investors thinking about global diversification. These ETFs are just a useful sample that uses relevant broad market indexes for each region as snapshots.
The goal of this chart is to capture the balance of risks across the broad mix of macro trends (economy, currency) and the sea level industry and company fundamentals rolled up into a US traded ETF. For the US, we just used the S&P 500 ETF (SPY). That index is in last place among the 4 above.
The chart shows the US remaining in last place YTD with the dollar as the main culprit. This past week piled on with an equity market sell-off and risk repricing. The dollar rallied this past week even if weakening on Friday, but the dollar (DXY) remains down materially for the year. We frame the dollar index vs. the 30Y UST in our weekly curve publication that we will publish later this weekend. We also see the China ETF plunging as the US vs. China trade battle brings no winners.
Unlike the EU and the USMCA trade partners, China can do serious damage using some tools it has not pulled out to this point on the supply side of the “trade weapons” menu. On the short list of extreme worries, the pharma and medical supply chain always lurks with generics, pharma, and ingredients. Brookings did an interesting study on the topic. The danger is real one way or the other at a time when health care costs are back in the headlines at the root of the shutdown.
That last place finish for the US in the YTD time series above does not offer much in terms of bragging rights at a time when many global investors and national leadership ranks are increasingly shocked by the direction of US trade and erratic geopolitical policy (notably with Russia-Ukraine and with tariffs). Whether that will flow into weaker UST appetites from offshore investors is a wildcard. They are more likely to hedge these days as various studies have highlighted.
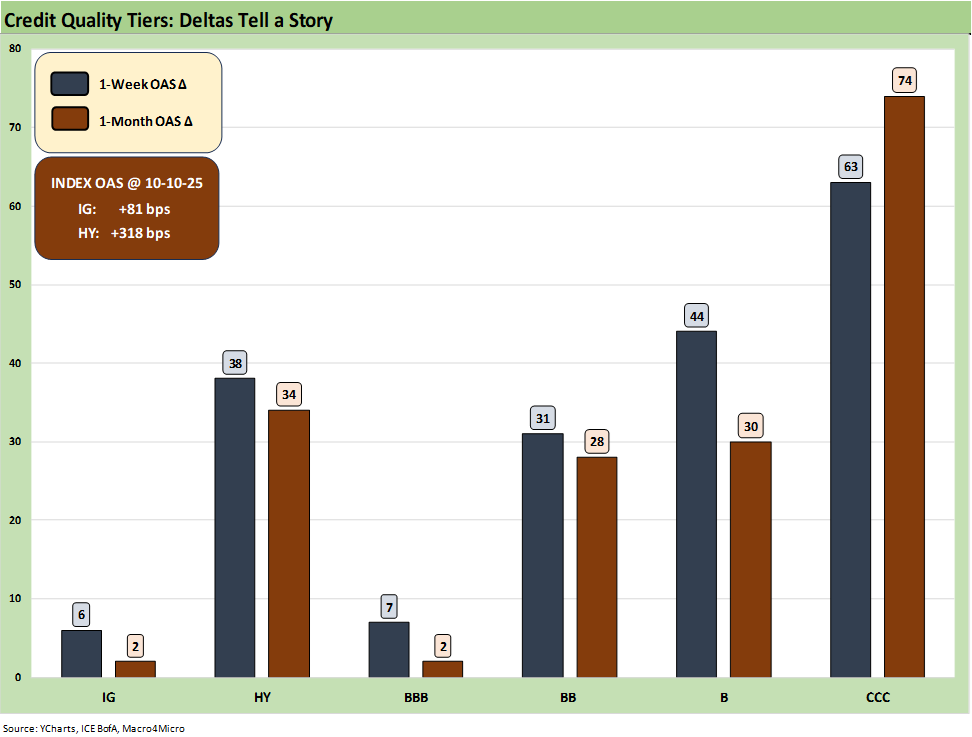
The above chart highlights a very busy week in HY spreads with the IG move relatively muted and quality spread differentials moving wider below the BBB tier.
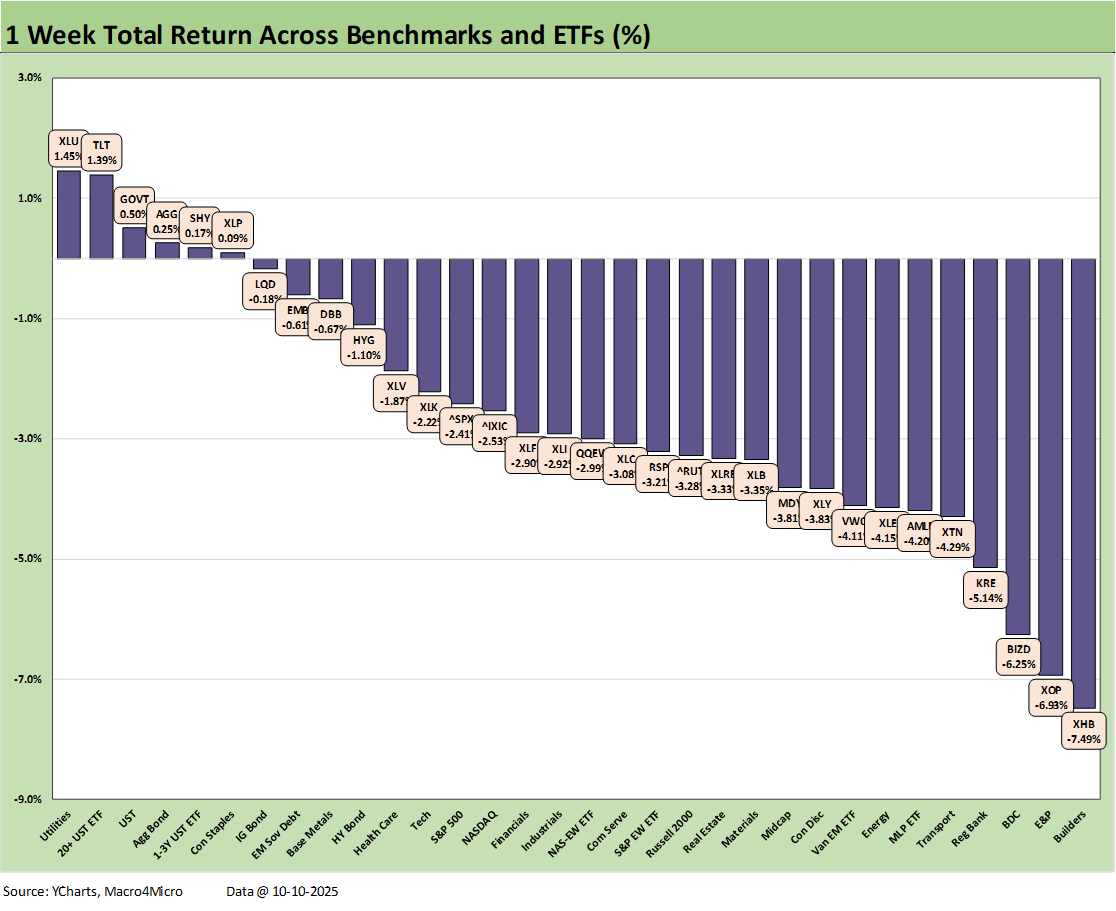
The above chart updates the weekly total returns for the 32 benchmarks and ETFs that weighed in at a score of 6-26 for the week with 6 in positive range including 4 bond ETFs joined by Utilities (XLU) at #1 and the defensive Consumer Staples ETF (XLP) at #6. The long duration UST ETF (TLT) was #2, GOVT at #3, AGG at #4, and the short UST ETF (SHY) at #5. The credit spread impact was enough to still send the IG corporate Index (LQD) into the red even if LQD was still in the top quartile. LQD was followed closely by the EM Sovereign ETF (EMB) to round out the top quartile. HY was modestly negative in the balancing act of duration vs. spreads.
Notable outliers include the Homebuilders (XHB) in dead last at -7.5% with E&P (XOP) in second to last as oil prices slid again on the week. The BDC ETF (BIZD) headlines are staying negative as extrapolation starts to catch on after the tragically screwed up First Brands situation gets more airtime and column space in the financial media and raises questions on due diligence and portfolio monitoring quality. The 3Q25 earnings ease for BDCs will be very interesting in prepared statements and Q&A. The stakes will be high for investor confidence.
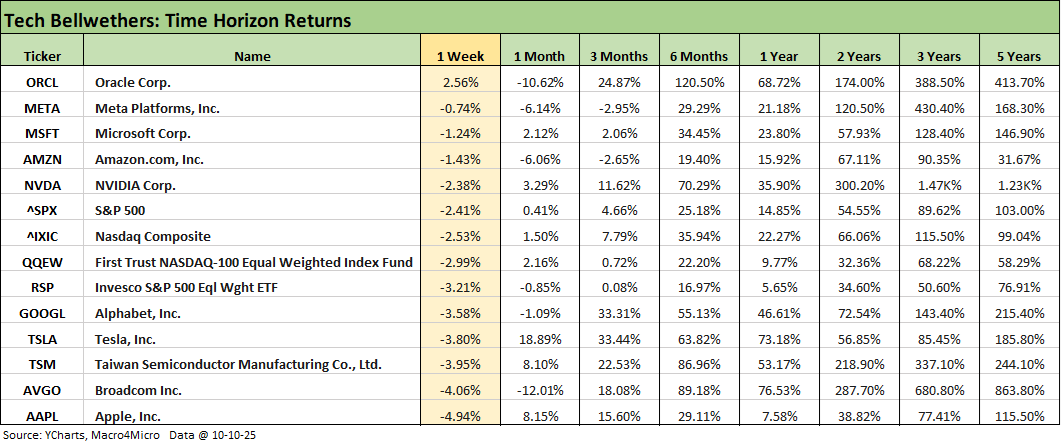
The tech bellwethers only had a single line in positive range with Oracle, who also is posting a trailing 1-month return at -10.6% for the name. The Mag 7 were in the red with 4 of the Mag 7 beating the S&P 500 on the week. The China trade flareup raises uncertainty on what critical tech products can be sold in coming months, but the battle also heightens the risk of more pan-Asian fallout for supplier networks. Meanwhile, much of the semiconductor tariff drama still lies ahead. The strategic metals wildcard casts a wide net of supplier chain disruption risk from tech to autos.
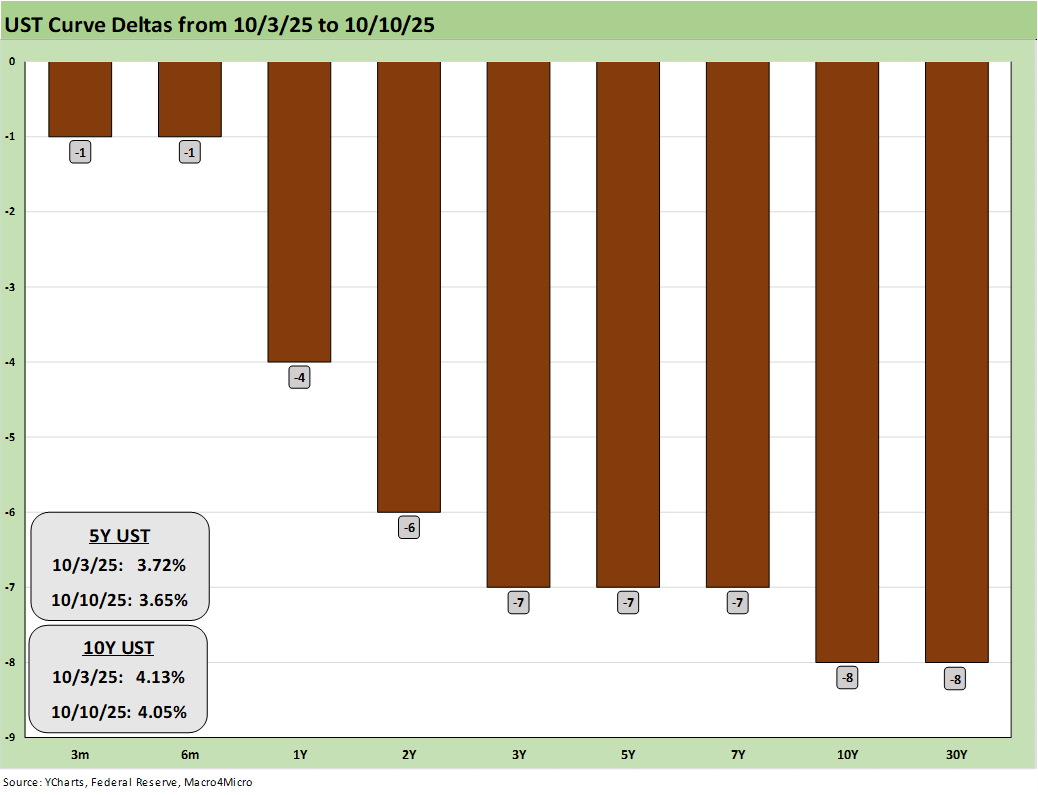
The above chart updates the UST rally and mild bull flattener trend this week. More weakness is expected even without BEA and BLS data as more disturbances (the shutdown, China trade war) unsettle production rates and inventory shipments and working capital cycles get unsettled. The effects could potentially generate a wider range of goods shortages and price reactions at a time when health care premiums are spiking for many. There is no shortage of moving parts.
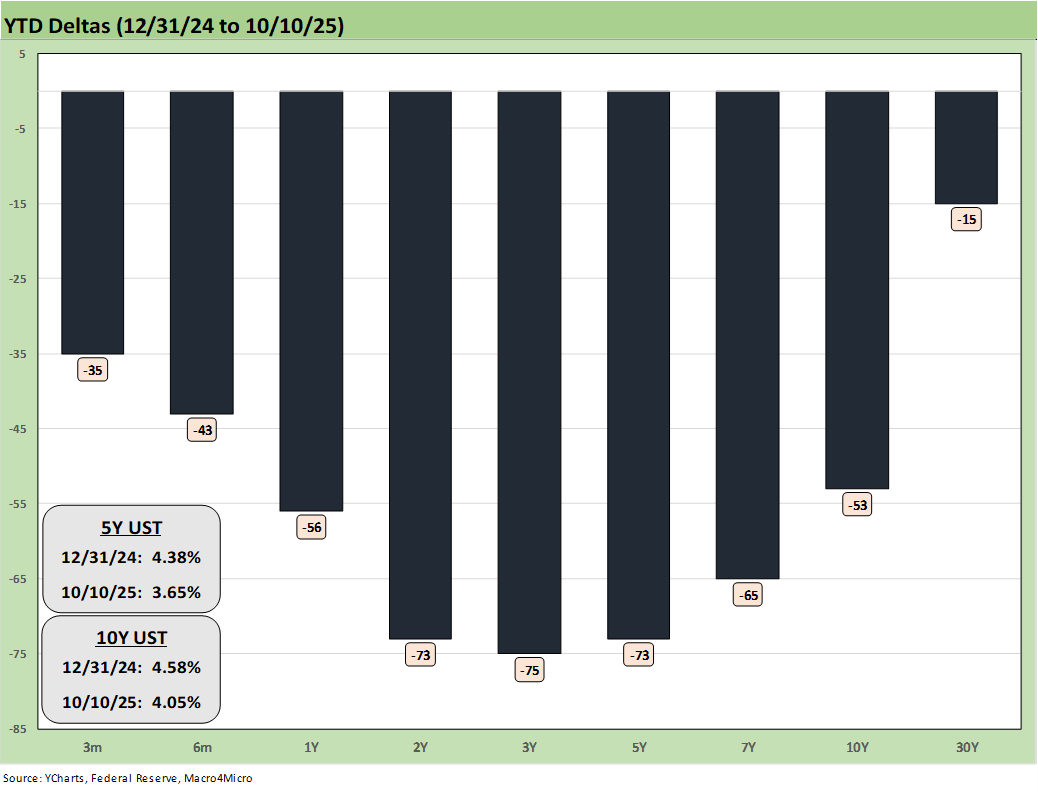
The above chart updates the YTD UST rally with the 2Y to 5Y showing the biggest move lower. The 30Y was more stubborn across the year. The worry will be the threat of a steepening of the UST curve if the trade situation devolves even further after the China news this past week. That gets into the stagflation debate of low consumer confidence, weaker spending, and worsening payroll all set against goods inflation.
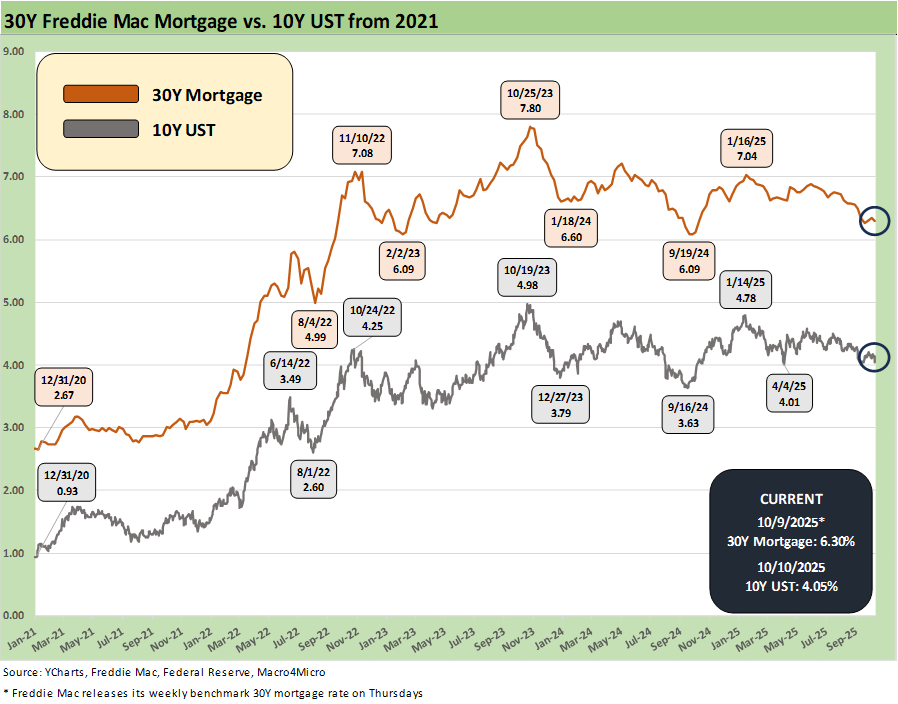
The above chart updates the time series for the 10Y UST vs. the Freddie Mac 30Y mortgage benchmark. The mortgage markets lagged the UST rally this week. The bond ETFs were all positive this week as detailed above but the 10Y UST remains notably above the post-Sept 2024 easing rally low of 3.6%. The Hi-Lo range for Freddie Mac 30Y was just over 170 bps from Oct 2023 through current times but around 200 bps using other mortgage surveys.
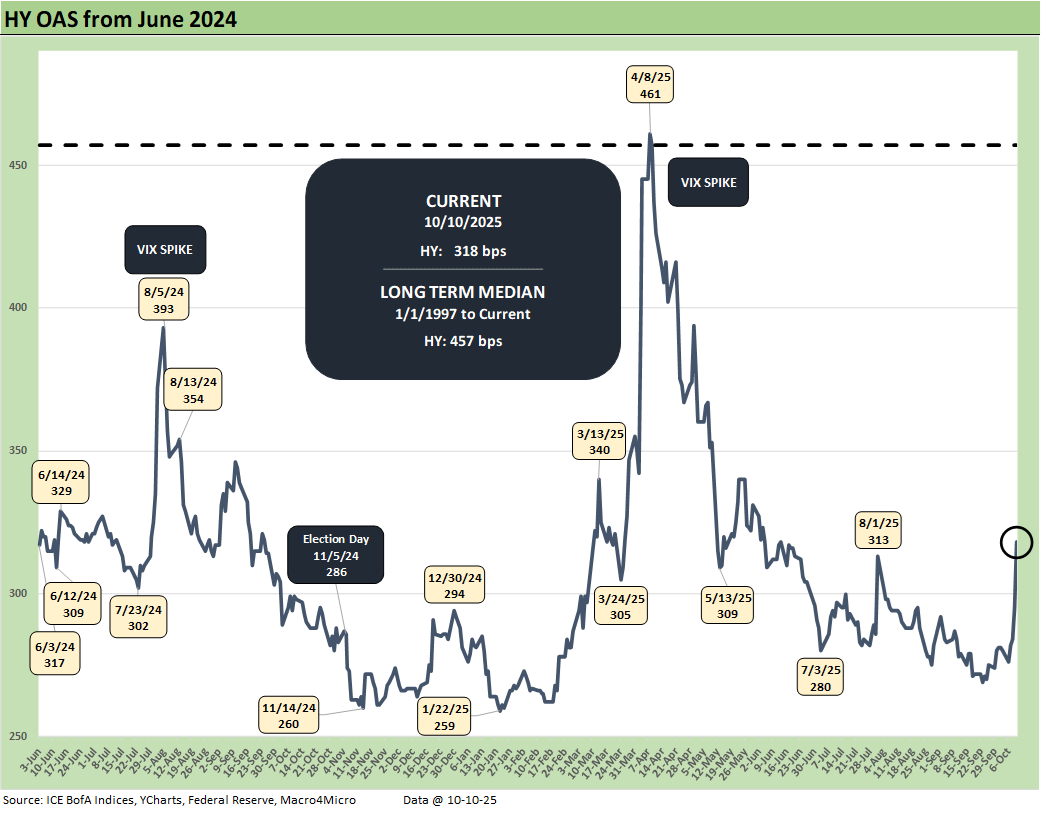
The above chart updates the running HY OAS from June 2024, and we see a +38 bps move wider this week to +318 bps. That is substantially wider than the +259 bps in the lows of Jan 2025 but still well inside the +457 bps median since the start of 1997.
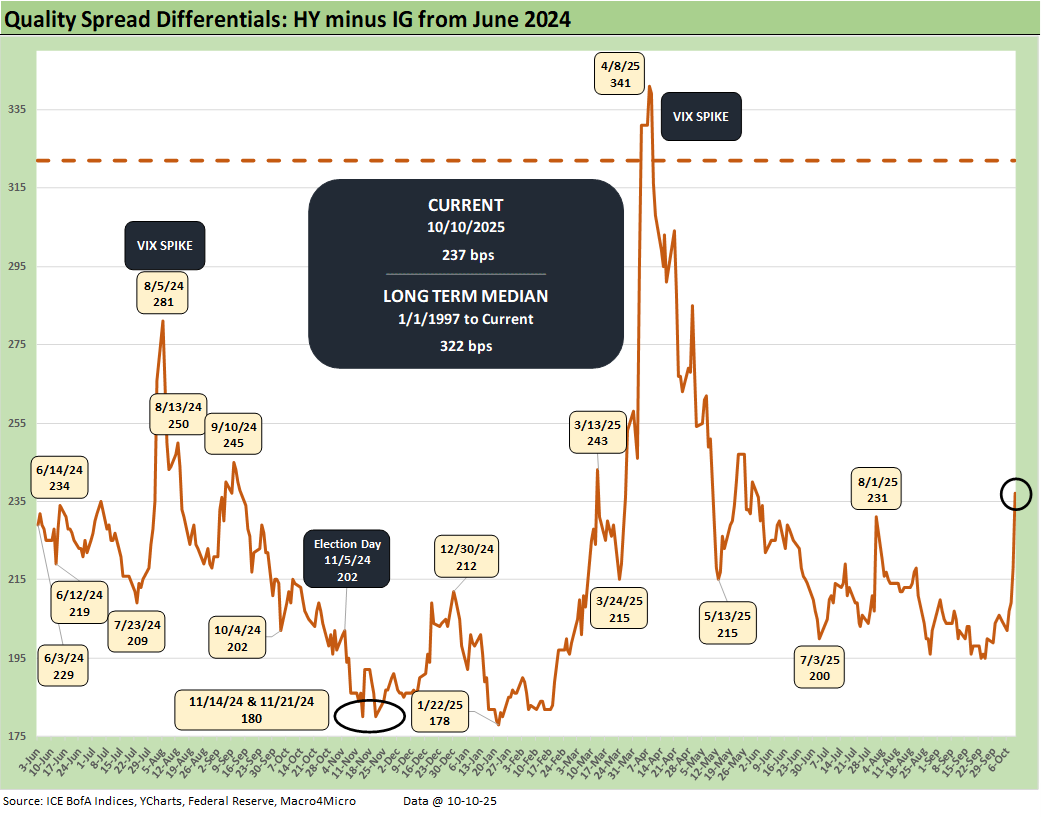
The above chart updates the “HY minus IG” quality spread differential as it gapped wider this past week to +237 from +206 bps with most of the HY OAS action on Thursday (+11 bps) and Friday (+23 bps). IG was +6 bps on the week vs. +38 bps for HY for a net quality spread widening of +32 bps.
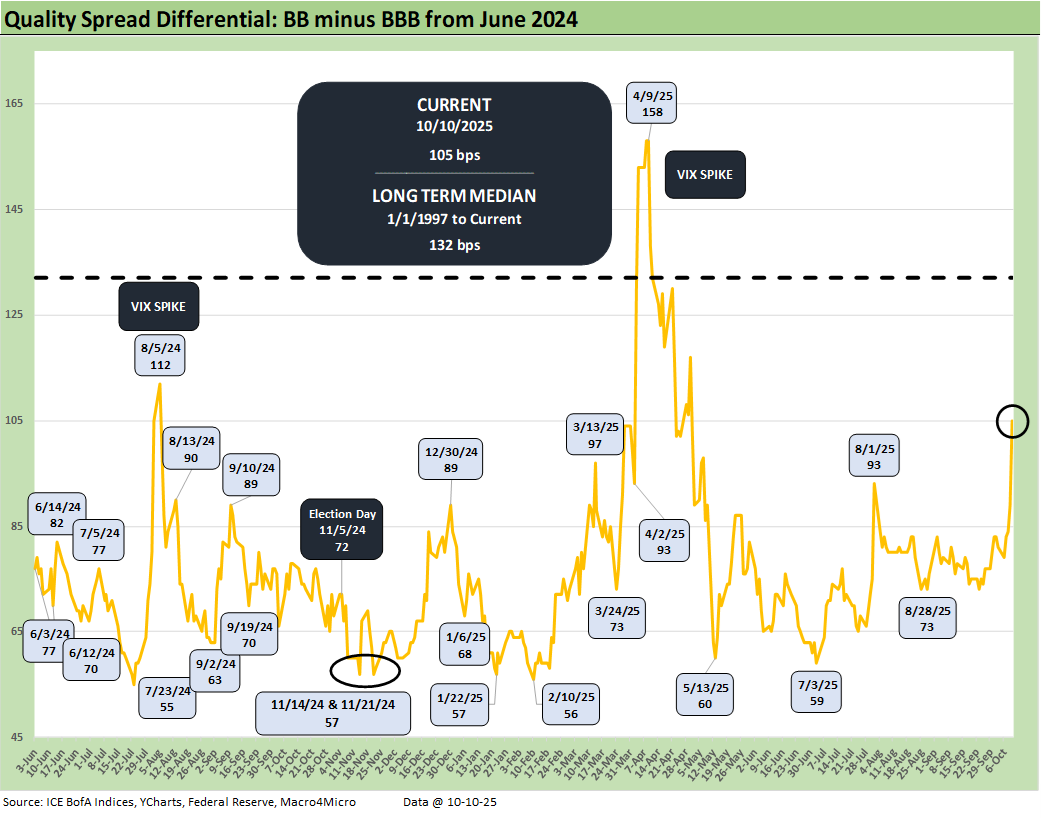
The above chart plots the “BB OAS minus BBB OAS” quality spread differential as it widened by +24 bps with the BB tier wider by +31 bps and the BBB tier wider by +7 bps for a net quality spread move of +24 bps.
See also:
Credit Profile: General Motors and GM Financial 10-9-25
Credit Markets: The Void Begins 10-6-25
The Curve: Blind Man’s Bluff 10-5-25
Market Commentary: Asset Returns 10-4-25
Mini Market Lookback: Chess? Checkers? Set the game table on fire? 10-4-25
JOLTS Aug 2025: Tough math when “total unemployed > job openings” 9-30-25
Credit Markets: Cone of Silence Ahead? 9-29-25
The Curve: Easing Anxiety at Bat, Tariffs on Deck 9-28-25
Mini Market Lookback: Market Compartmentalization, Political Chaos 9-27-25
PCE August 2025: Very Slow Fuse 9-26-25
Durable Goods Aug 2025: Core Demand Stays Steady 9-25-25
2Q25 GDP Final Estimate: Big Upward Revision 9-25-25
New Homes Sales Aug 2025: Surprise Bounce, Revisions Ahead? 9-25-25
Credit Markets: IG Spreads Back in the Clinton Zone 9-22-25
Mini Market Lookback: Easy Street 9-20-25
FOMC: Curve Scenarios Take Wing, Steepen for Now 9-17-25
Home Starts August 2025: Bad News for Starts 9-17-25
Industrial Production Aug 2025: Capacity Utilization 9-16-25
Retail Sales Aug 2025: Resilience with Fraying Edges 9-16-25
Credit Markets: Quality Spread Compression Continues 9-14-25
Mini Market Lookback: Ugly Week in America, Mild in Markets 9-13-25
CPI August 2025: Slow Burn or Fleeting Adjustment? 9-11-25
PPI Aug 2025: For my next trick… 9-10-25
Mini Market Lookback: Job Trends Worst Since COVID 9-6-25
Payrolls Aug 2025: Into the Weeds 9-5-25