
The Curve: Back to the Future 11-9-25
A deal to reopen the government appears close as Democrats got their share of political capital on ACA and SNAP.


The future is clear. Shutdowns and tariffs do not go well together.
Bond returns struggled this week with duration mixed, the long end higher, and credit spreads wider. The favorable curve shift from 6M to 7Y was framed against a slightly adverse move in 30Y UST.
The UMich Consumer Sentiment plunged to near all-time lows, White House resistance to full SNAP benefits, and the ACA premium spikes now in hand for millions offer some incentive for Democrats to get payrolls opened up again. We await the final word on how this deal gets struck.
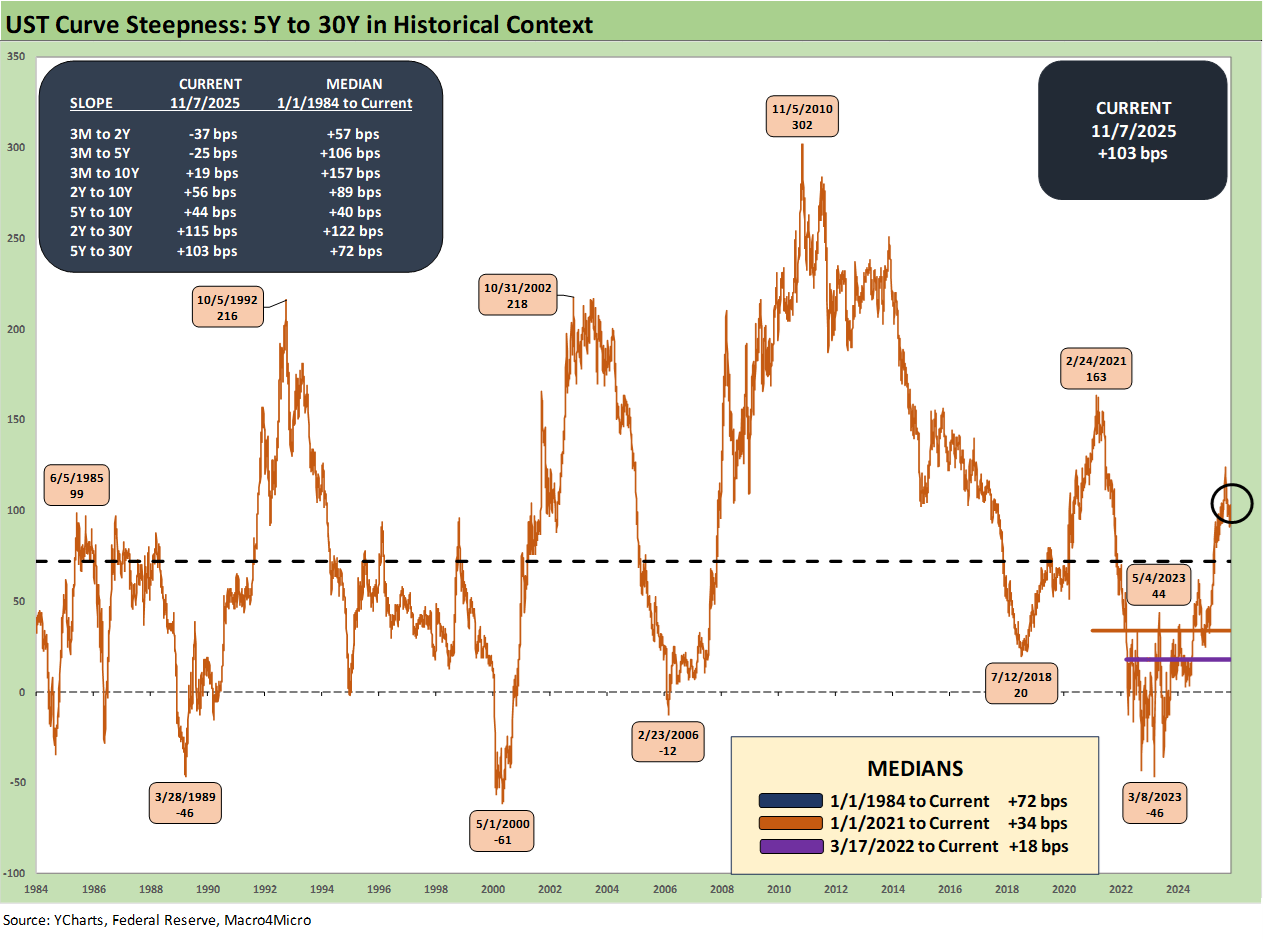
We look at the 5Y to 30Y UST slope as it remains steep to the long-term median. The YTD curve move is a bull steepener, but the bear steepener scenario is hardly gone.
NOTE: The chart above and those that follow update our rolling review on the state of yields. We break some sections into two parts: “Recent Trends” and “Historical Context.” The historical context is more about background, memory joggers, and for new readers. The recent trends is a quick summary of the recent UST action.
Recent Trends:
The past week saw 5 of 7 bond ETFs in negative return range (see Market Commetary: Asset Returns 11-9-25). The absence of economic data could change soon and the combination of a solid aggregate 3Q25 earnings season and reopening could edge the debate back in favor of cyclical resilience, but that consumer is clearly on edge. Tariffs are increasing with more soon flowing into the US economy, and that is an inexorable reality that no amount of White House foot stomping will change.
The odds of another -25 bps cut in December plunged with the recent FOMC meeting and Powell language. FedWatch had dropped from over 94% (10-27) to 62% by the last weekend. As we go print today, the odds of a -25 bps cut are 66.8%. ADP weighed in with more constructive payroll commentary and FactSet highlighted a 10% area blended earnings growth for 3Q25 in the S&P 500, so the cyclical story has some empirical support in the debate. Small business pain from tariffs is a separate story for corporate sector health, and consumer question marks are only getting bigger.
Historical Context:
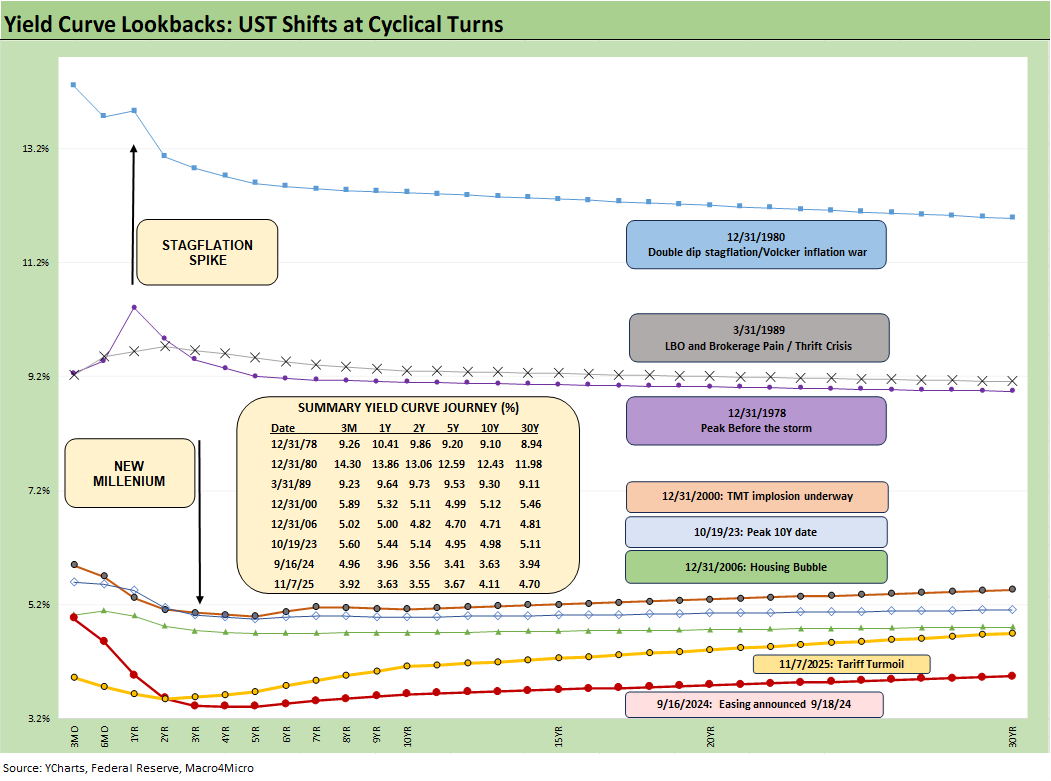
The above chart overall helps give historical context to the level and shape of the current yield curve vs. a range of market backdrops. The curves are plotted across some historical economic expansions and in some cases pending turns in the economic and/or monetary cycle. They are worth pondering for compare-and-contrast purposes since they mark key transition points in cycles and market risk backdrops. In some cases, the timelines included bouts of dulled risk senses and occasional valuation excess (notably 1989, 2000, 2006).
Highlights across monetary journey…
The last time a stagflation threat had to be considered was after the Carter inversion of 1978 indicated above. The stagflation threat then showed up in force by the Dec 1980 curve after a peak Misery Index of 22% in June 1980 and Volcker was in full swing trying to break inflation.
Another useful period to ponder is the TMT cycle faltering in 2000 on the way to a massive Greenspan easing in 2001. The current cyclical tech boom and valuations cannot escape looking back at the late 1990s. That period saw credit markets under pressure in 1999 and creeping up on 6% HY default rates, but that did not stop the NASDAQ from printing an 86% total return year in 1999 on the way to a March 2000 peak (see UST Curve History: Credit Cycle Peaks 10-12-22, Greenspan’s Last Hurrah: His Wild Finish Before the Crisis 10-30-22, Yield Curve Lookbacks: UST Shifts at Cyclical Turns 10-16-23).
That period offers another case study in excess across equity and credit markets with the peak in 1999 (credit) and NASDAQ (2000). The TMT bubble bursting soon led to excessive easing by Greenspan in 2001 and then into early 2004, in turn setting the table for the housing bubble peak in 2006. During the 2004 to 2007 period, leveraged derivative exposure and structured credit was out of control and counterparty risk was soaring. The good news is that currently the credit markets and banking/dealer systems are sound unlike 1999 and 2007.
Private credit and rating agencies “working hard for the money” will bring some scrutiny, but the investors still face the obvious obligation to conduct their due diligence. As an analyst who started in private placements at Prudential in the early 1980s, there was plenty of focus on due diligence and covenant structure. Many of those analysts on “privates” team migrated to HY bond business lines.
“Private Credit” as a concept thus is not new but is traveling a different structural path now with new participants and AUM gathering. The silver lining of the opaque process is that some of the “smartest guys in the credit business” are driving it. They want the market to grow (by trillions) and being prudent about it now makes more sense than not. Assuming a cockroach festival still seems like extrapolation run amok. As always, there will be dogs. That is intrinsic to the process.
Passing across the distortion years…
The chart above jumps from 2006 to 2023, which takes the market beyond the crisis period and the ZIRP years and COVID. Both the post-credit crisis period and later COVID crisis prompted the Fed to deliver a wave of market liquidity support and confidence building programs that helped save the capital markets, reopened the credit markets, reduced refinancing risk anxiety, and reduced the contingent liquidity risk profile of the banks.
The credit crisis period from late 2008 to COVID in 2020 brought plenty of QE and normalization distortions to the yield curve shape. The Fed’s dual mandate made that possible. The market could soon face new legislative threats to the Fed in 2026 that seek to reel in the dual mandate. In addition, the new “Fed head” in 2026 is likely to do whatever Trump demands. That topic of sweeping regulatory change at the Fed is based on commentary from Bessent and mirrors plans discussed in Project 2025 (See Chapter 24). That will be a topic to tackle as we get closer to those ideas coming into play.
Recent Trends:
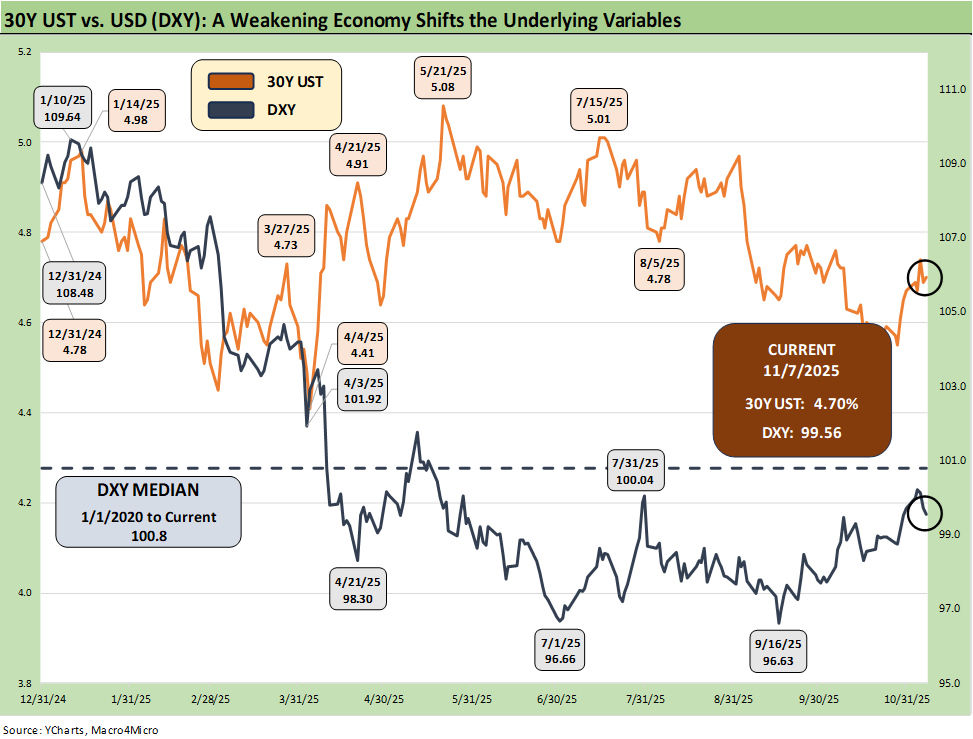
The above chart plots the recent trends in the 30Y UST vs. the dollar index (DXY) as the US dollar weakness throws another risk variable into the picture and poses a major risk factor for non-US buyers of UST.
This past week saw the dollar weaken slightly to 99.56 from 99.72 as noted in the chart. Lower rates have been a contributing factor as was the continued government shutdown. Recent dollar action and commentary are not signaling a hyper easing move yet – at least until Trump gets “his guy” in the seat in the spring of 2026 and more like-minded people in leadership positions.
The UST action out to 30Y from last week posted a relatively mild move of +3 bps as highlighted in other charts below. The reality is that a UST steepener remains a threat with inflation not easing and UST supply pressures remaining higher across the longer horizon despite the tariff revenue. Trump’s announcement of $2,000 tariff checks for “not rich” people this weekend was an unusual variable in the debt reduction promise.
The IEEPA case was brought before SCOTUS this week and awaits a decision in coming weeks. A setback on IEEPA would not help the technical supply-demand picture but would ease some inflation fears. Tariff “refunds” in theory would be a windfall recovery to those who paid those tariff fees to customs. The approach the ruling will take is anything but clear.
On the other side of the risk checklist, trade partners might be more emboldened (or less cowed) if SCOTUS removed Trump’s ability to drop triple-digit tariff threats with every mood swing. In a twist, that might increase the risk of retaliation. Trump still has Section 301 tariffs and Section 232 in his arsenal if he loses the SCOTUS case.
Historical Context:
Team Trump loves to speak of record tariff revenue as if the word “record” makes it a good thing when it comes out of US consumer and corporate pockets. If you want to create a recipe for stagflation, that would be the easiest recipe book to pull from. Just add record deficits and a weaker dollar from the spice rack that makes the tariff even higher at the border. We continue to see very negative color on tariffs from small business trade sources.
Tariffs hit prices or profitability – there is no hiding from the tariff expense paid to customs by the buyer/importer. Resulting expense offsets could create layoffs or slow hiring and potentially reduce expansion by companies who get hit on the cost line. “Tariff cost mitigation” actions are a new part of many earnings calls.
The currency challenge…
The dollar has gone through its worst pounding in 2025 since the 1970s during the dark days of stagflation and multiple deep recessions. Lower rates could be a catalyst for more dollar weakness while political risk factors and governance quality should now be factors in the US sovereign credit quality assessment. The flip side is that rates and inflation metrics may not cooperate with baseline scenarios. In a world where everyone is a borrower, someone has to be the lender.
Record forward-looking deficits and the optics of political instability adds a negative element to the sovereign risk profile of the US that no rating agency would have the courage to flag. The latest assault on free speech and Trump’s threat to arrest people who accuse him of being against free speech is not without its humor and twisted irony (“Call me a fascist and I will arrest you”?!?). Tossing around the Insurrection Act is anything but reassuring to political stability and broader economic confidence. Demanding Federal monitors of select Blue state elections handpicked by Trump is not a Founding Fathers moment. States run election rules – not the White House.
The current shutdown has now handily beat Trump’s 2019 record, and that is not inspiration for UST demand or the dollar if life gets worse from here. As we go to print, it appears that a deal is close…we will see.
The political goal could be to inspire more “Hatfields vs. McCoys” division and “team loyalty” and head off the move to force the production of the Epstein files. Unlike in the Senate, the House leader Mike Johnson refuses to swear in the deciding vote (a special election Democrat) or bring the House back into session until the shutdown is over. The intent is clear. Make the clash uglier and peel off some support to block the Epstein files evidence demands.
The shutdown has been one more case of “politics = policy = economics” as services and payrolls can be decimated. It also blurs performance attribution in framing and evaluating Trump macro policy (notably tariffs). Construction projects get delayed, investments stall, and both federal and private sector payrolls can get hit.
Recent Trends:
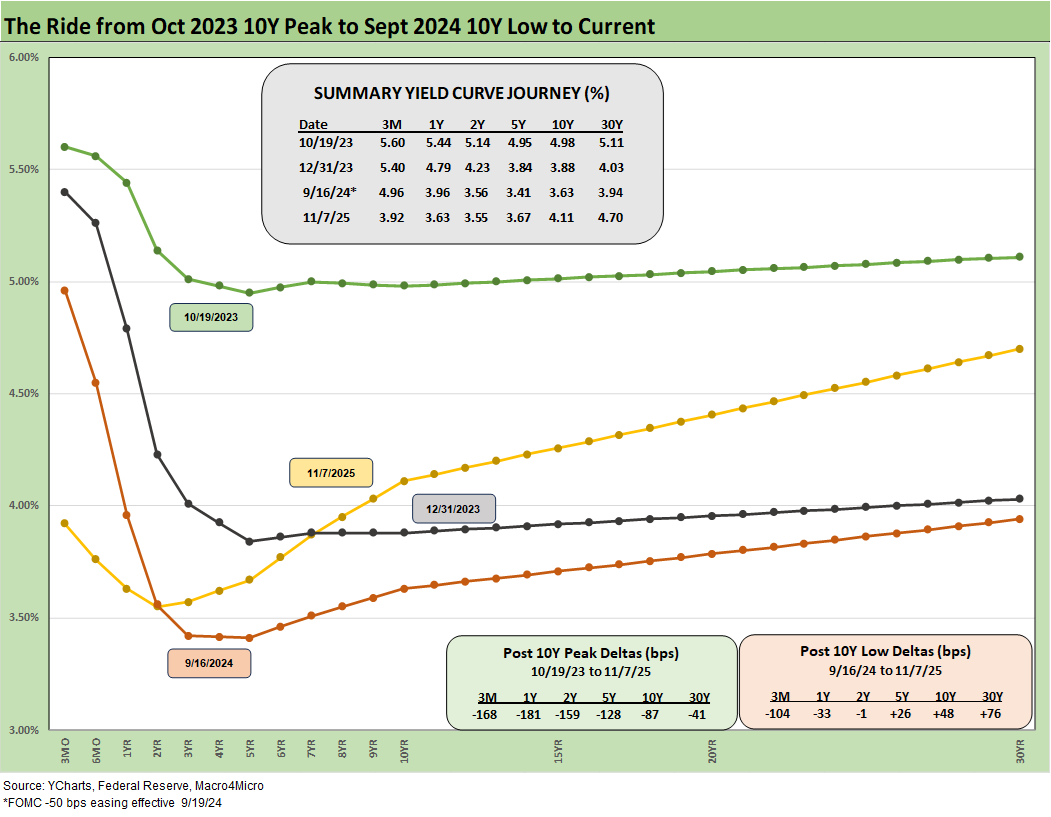
The above chart updates the post-easing shift and gives some context to the last major easing in Sept 2024. The current curve has not yet followed the Sept 2024 shift into a bull flattener with the lower fed funds, but we saw some intermittent signs of a rally in the 10Y UST to below the 4.0% line (well above the 3.6% lows of Sept 2024) before the10Y moved higher again. The rally after Sept 2024 was brief and soon gave way to a bear steepener. We are at a critical juncture for this latest 4Q25 easing sequence.
We saw the 3M UST move higher this week while the 1Y to 7Y moved lower, the 10Y stayed flat and the 30Y edged higher. The long bond (30Y) chaos in various countries has kept global investors on edge since the supply-demand concerns for UST funding are not going away.
Historical Context:
The above chart frames today’s rates amid the wild ride from the Oct 2023 peak (10Y UST) down across the bull flattener into year-end 2023 and then into the easing actions and rally of Sept 2024. Then came the ensuing bear steepener that is evident in the journey to November 2025. We break out some numerical UST deltas in the box.
The UST experience in the period after Sept 2024 and the -50 bps in cuts (followed by another two cuts in 4Q24) will loom large in memory banks. This chart reminds us that the “ease and flatten” shapeshifting pattern is hard to rely on in a market where the supply-demand of UST is tenuous, and tariff impacts are hard to predict.
Fed easing and the flattener vs. steepener debate…
There was a lot of bear steepener action from the end of 2023 into the summer of 2024 and fresh bouts of the same after the big rally in the fall of 2024. The Sept 2024 easing gyrations will make it hard to take much for granted this time after Sept 2025 with much higher, sweeping tariff policies and an ongoing debate over a cyclical slowing in the mix of variables. Payroll weakness and slower consumption and demand would help the short end, but the 10Y UST move is more complicated. We still expect 2026 to bring a 3M to 10Y steepener with a lower short end and a stubborn long end.
Historical Context:
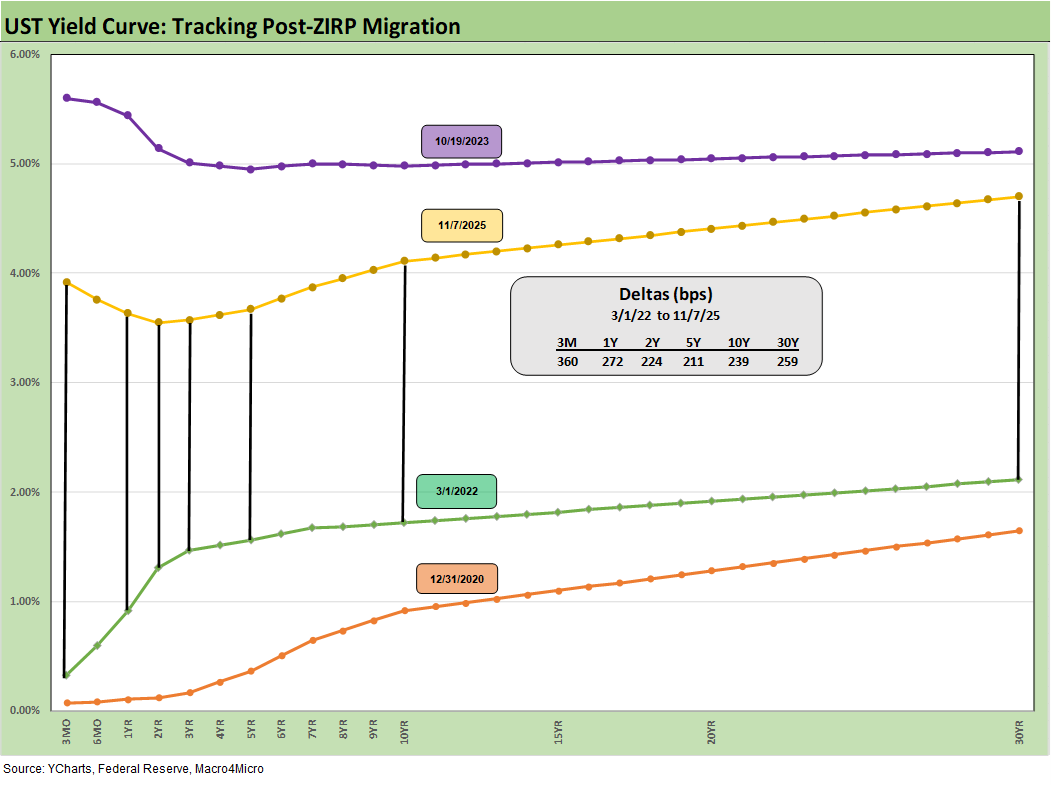
The above chart just updates where the current UST curve stands relative to the Dec 2020 UST curve on the low end and the 10-19-23 highs after the tightening cycle went into effect in March 2022.
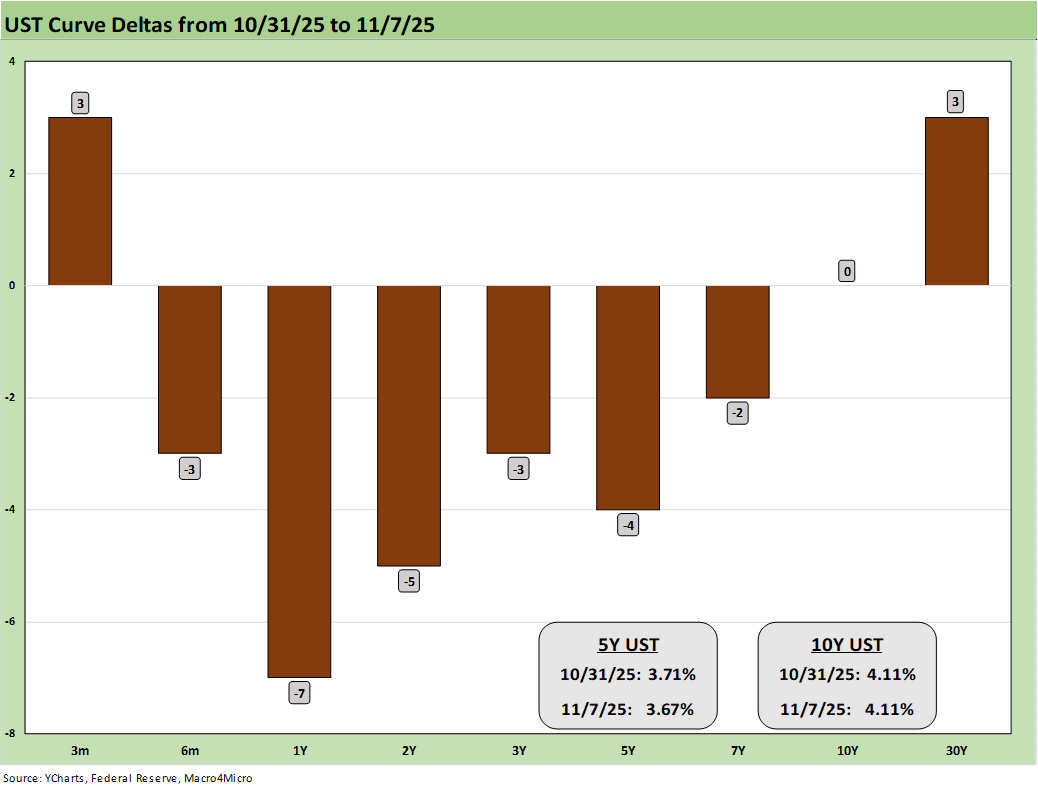
Recent Trends:
The above chart updates the 1-week UST deltas, and we see the UST curve steeping slightly from 6M to 30Y.
Only time will tell how the lack of macro data and decidedly cautious FOMC will move in coming months. The plunge in the odds of a Dec 2025 cut at FedWatch to 66.8% as we go to print is down from over 94% two weeks ago. That move highlights the state of confusion right now. We’ll keep our ears open for comments by Fed members, especially those already cautioning against further easing in the face of tariff uncertainty. The “hawks” are getting noisier, and they also need to ponder the recession risk vs. the goods affordability challenge.
One big line item – health care insurance – is all over the headlines at this point as the market considers the multiplier effects beyond the big tax bill (Medicaid cuts) and the pending ACA premium spikes. Week-to-week paycheck subsistence and household budgets can get roiled quickly.
The SNAP food relief funding was in the on-off-on mode despite the court orders. It is getting ugly out there, and consumer credit (especially subprime) could come under more pressure. Perhaps a final deal will offer some clarity. As we go to print, procedural votes were taking place to take it to the next step.
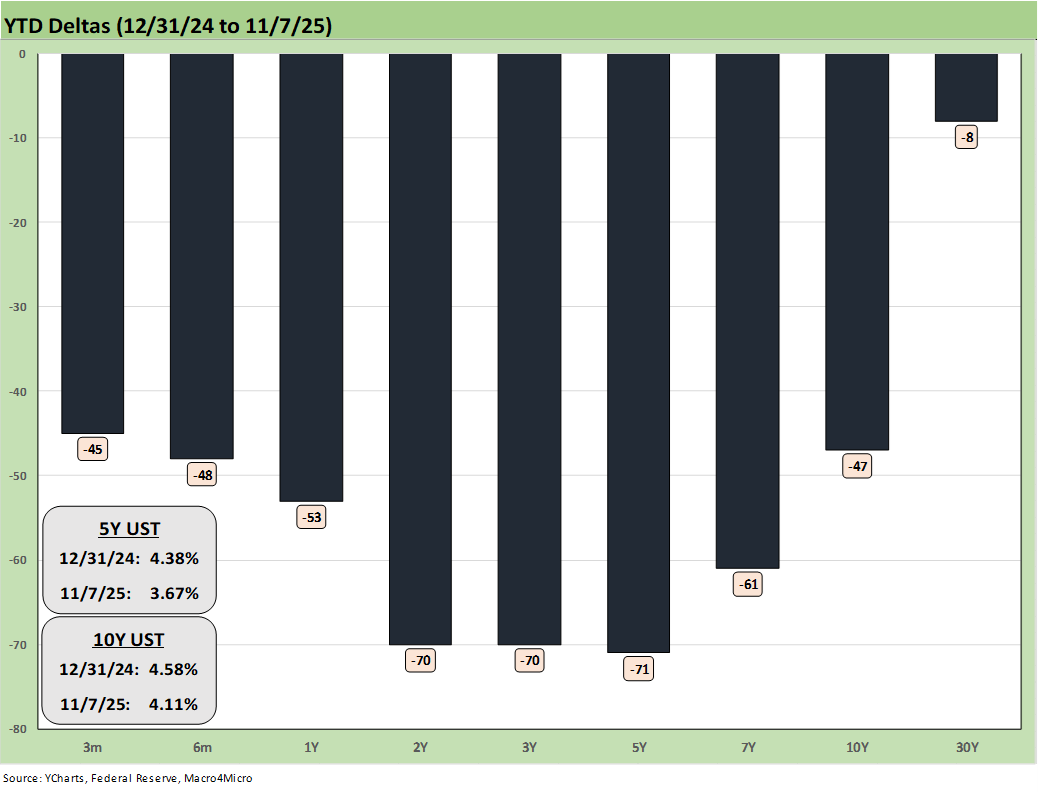
Recent Trends:
The above chart updates the YTD UST deltas. We see how the bull steepener has paid off for bond returns in YTD 2025 with the 7 bond ETFs we track all in positive return range YTD (see Market Commetary: Asset Returns 11-9-25).
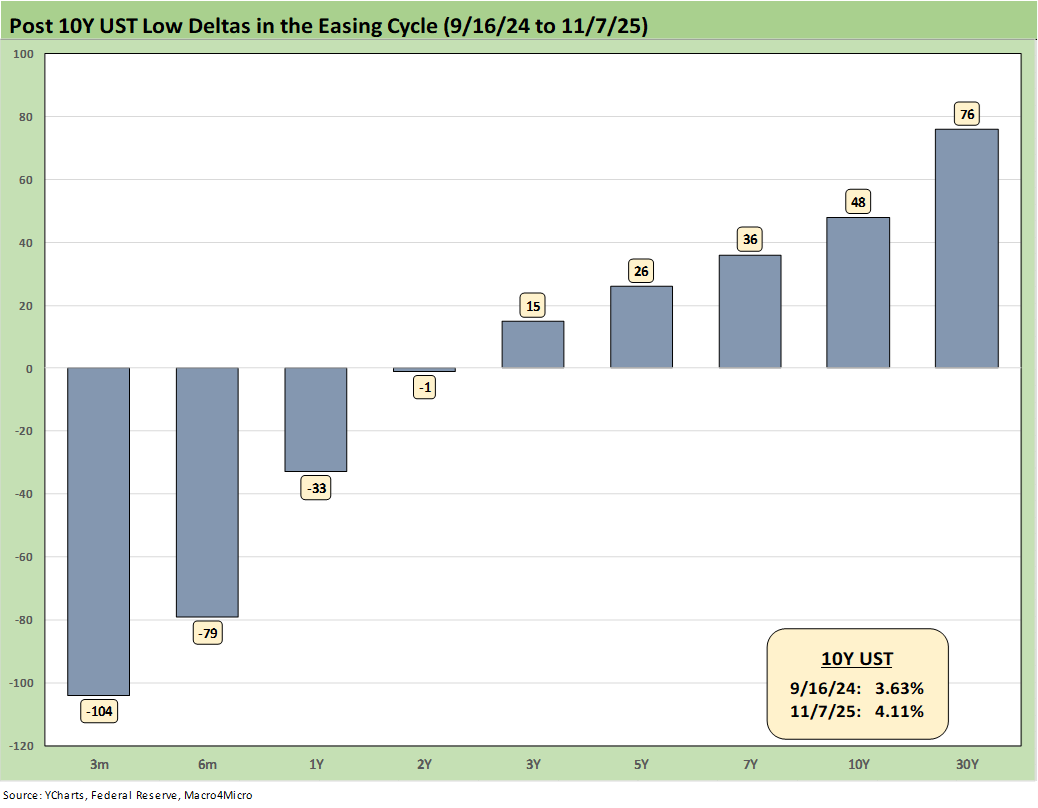
Recent Trends:
The above chart updates the running UST deltas from the recent low point in the post-tightening cycle reached in Sept 2024 (9-16-24) when the 10Y UST (10-19-23) dipped to 3.6% around the first -50 bps easing. At the very least, the 3.6% on 10Y UST (after the Sept 2024 easing) offers some hope to the UST flattening bulls. Of course, that flattening did not last.
The 4.11% from the Friday close underscores the stubbornness of the long end when the market is hoping for 1 more cut in 2025. The expectation of weaker payrolls saw a setback for UST bulls when ADP weighed in with more constructive commentary. 3Q25 earnings also did not disappoint the fundamental economic story in the large cap corporate sector. Small business remains a wildcard in the age of high tariffs, and that requires more data from the BLS.
Historical context:
The biggest difference between the current backdrop and Sept 2024 is the radically different tariff policies and the slowing GDP growth. There is no question the economy has been posting weaker growth in 2025 than 2024. The PCE line in GDP is weaker while the investment line under GPDI should recover based on the proposed investment “promises.” Those are not in the GDP numbers yet even if investment in IP remains very strong (see 2Q25 GDP Final Estimate: Big Upward Revision 9-25-25). Some 3Q25 data would be helpful.
Lead times on projects vary materially, and a promise from a trade partner is not a contract with a the crews ready to break ground. We assume the loosely defined investment promises are subject to market conditions and to final, inked trade deals. As of now, new ironclad trade deals are lacking with the EU, Mexico, Canada, and China. That is, deals are lacking for the majority of US trade, which is dominated by those four. There are a lot of “frameworks” with the White House.
GDP Jedi Mind Tricks…
The sudden shift by Team Trump (notably Bessent, Hassett) to emphasize the 2Q25 headline GDP of 3.8% after instructing their audience to ignore the revised 1Q25 headline number of -0.6% as distorted is almost funny.
The key here is to understand how the major tariff-related distortions in net exports/imports and “change in inventories” lines impact the headline GDP number. This is not necessarily intuitive.
Headline GDP for both 1Q25 and 2Q25 is materially distorted by the import line. In 1Q25, higher imports, as part of the pre-tariff import spike and inventory build, generated a -4.7% hit to GDP. In 2Q25, dramatically lower imports generated an additional +5.0% to headline GDP. That +5.0% decline in imports gets netted against a -0.2% decline in exports for a net addition to GDP of +4.8% in 2Q25.
Bessent and Hassett want you to adjust for the negative distortions for 1Q25 to make the number higher. Then they want you to ignore the positive distortions from decreased imports in 2Q25. That is a tad self-serving – and intellectually dishonest.
Beyond the net exports/imports line, the “change in private inventories” is also a major distorting variable. In 1Q25, change in private inventories adds +2.6% to GDP while in 2Q25, it deducts -3.4%. In other words, imports in 2Q25 “artificially” boosted GDP and you can net that +5.0% against -3.4% from inventory.
On a darker note, the huge decline in imports can also be construed as a sharp decline in companies’ low-cost sourcing capabilities and in turn higher expenses. That gets back to the debate of how they sustain margins via price or alternative cost cutting. Or companies simply have lower margins. Nothing comes for free under the laws of economics or double-entry accounting.
If you want to make the case that declining imports, declining exports and lower investment in inventories is a good thing in 2Q25, just don’t bring it up in macroeconomics class or ahead of your bonus review.
Headline GDP numbers are part of the exercise, but the value-added focus should always be first and foremost on the PCE lines and various Fixed Investment lines. That is where the cyclical stories can be found.
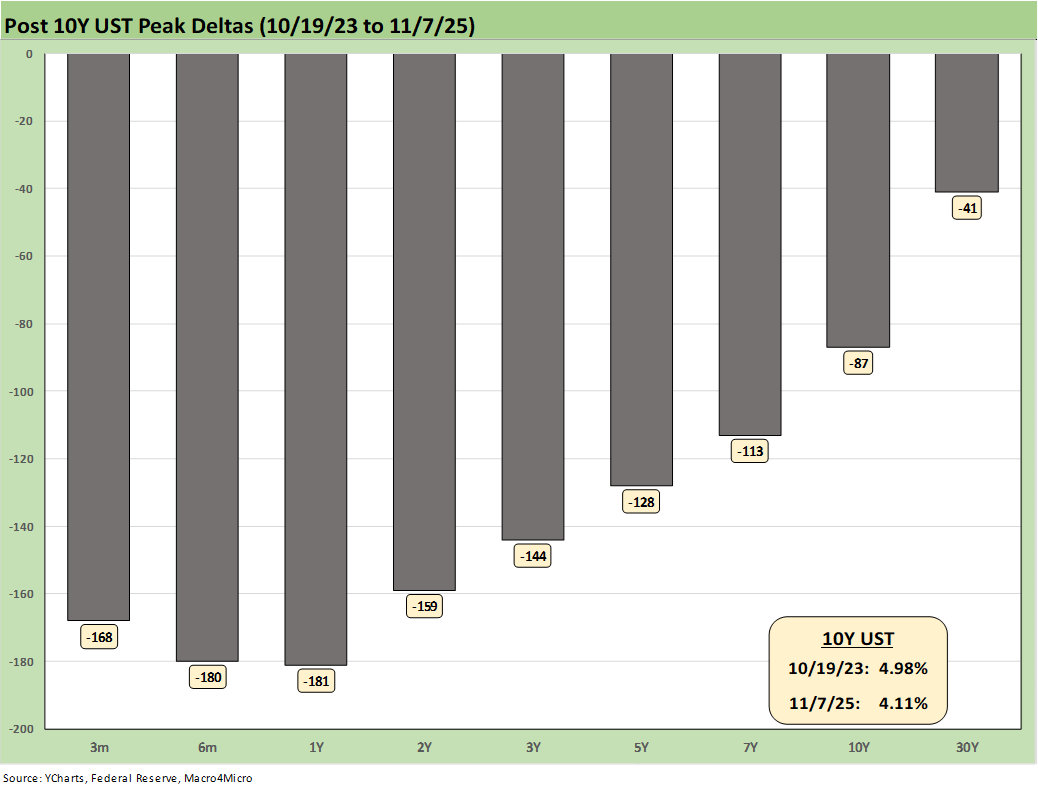
Recent Trends:
The above chart updates the running UST deltas from 10-19-23 through Friday. At the very least, it offers a reminder of what could go wrong if we get adverse inflation outcomes from tariffs. The politics of inflation have always been a death knell for reasonable discussion based on facts (e.g., “seller pays” vs. “buyer pays,” etc.).
The belated Sept CPI numbers underscore stubborn inflation in Services and rising inflation in Goods. The 2% target for inflation is around a point below where both CPI and PCE had been hovering. If jobs stay weak and inflation numbers get uglier, there is every reason to expect intervention by the White House in the BLS and BEA process (see Happiness is Doing Your Own Report Card 8-1-25).
Historical Context:
We now live in a world where votes and economic data get rejected, and the lemmings fall right into line and join the disinformation chorus. The data sets do struggle in payroll, and the need to use better model assumptions and improve survey utility have been picked over ad nauseum. When Trump piled on the “get rid of quarterly reports” bandwagon (in the age of AI and streamlined data delivery), the “intent” to mask any negative trends in the economy started to get more transparent in terms of motives.
The explicit Project 2025 ambition (Chapter 21, 24) is to consolidate data and information and unify control – not to assure better and more comprehensive data. That has been evident in an array of actions that we have covered in other notes. Ambitions for better data require more investment, more tech, and more public-private alliances. That dilutes control – and closer control is the point for the White House.
Recent Trends:
The above chart plots the 5Y to 30Y slope from 1984 for a read on the current shapeshifting potential ahead. For the 5Y to 30Y, the current +103 bps is above the long-term median of +72 bps as the 30Y has lagged the 5Y move during 2025 as detailed in the earlier charts. That relationships shows ample room for steepening from current levels with FOMC easing more likely and subject to the ability of the 30Y to move higher.
A more sustained rally in the 30Y might end up as more a “wish list” item than a likely reality given the noise around 30Y bonds on a global scale. The UST shifts with FOMC actions, but UST rallies have struggled with the 10Y also.
Historical context:
Bear steepening moves have been common in the 2024-2025 timeline, and the next move could be more of the bull steepener from the front end as the FOMC moves down. The tariff topic is one more force that keeps the “good vs. bad steepener” debate on the front burner.
The economy is now slowing in 2025 with PCE inflation still inside the 3.0% line as of the last read in August (see PCE August 2025: Very Slow Fuse 9-26-25). We are seeing plenty of inflation pressures across select product lines and numerous major lines are running higher in Sept 2025 than in Dec 2024. All you have to do is turn off the sound on the TV and look at the numbers (see CPI September 2025: Headline Up, Core Down 10-24-25)
Historical Context:
We see a peak inversion of the 5Y USY in March 2023 at -46 bps. The 5Y to 30Y hit a UST segment slope of +163 bps in Feb 2021 when the macro picture had bounced off COVID in a ZIRP market and fueled material supply-demand imbalances and inflation anxiety began.
Oil and gas prices spiked with the Russian invasion of Ukraine in Feb 2022. That Russian inflation catalyst is seldom – if ever – cited by Trump and his GOP leadership when they point fingers. Politics as usual in Washington.
We also include a box within the chart that details the other UST curve segment slopes that we watch along with the long-term medians. The front-end inversion from 3M is still the most anomalous part of the curve when you consider the fact we have been in an economic expansion since spring 2020 after a very brief 2-month COVID recession per NBER.
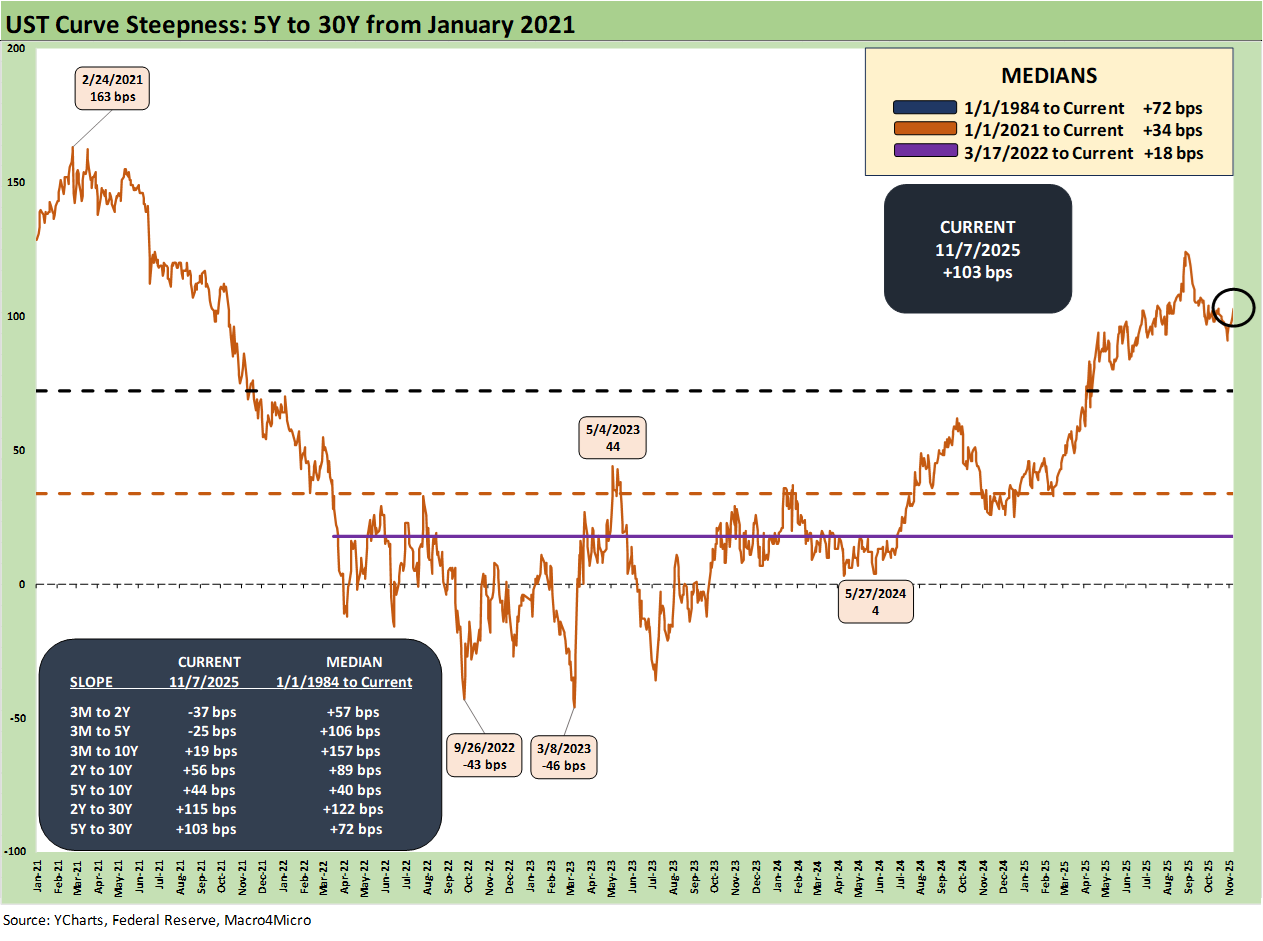
The above chart just shortens up the timeline to zero in on the moves from the ZIRP period of 2021 across the tightening cycle into the easing cycle to where we are now at +103 bps.
See also:
Market Commetary: Asset Returns 11-9-25
Mini Market Lookback: All that Glitters… 11-8-25
Credit Markets: Little Shop of Worries 11-3-25
The Curve: Macro Data MIA? Policy Prudence KIA? 11-3-25
Market Commentary: Asset Returns 11-2-25
Mini Market Lookback: Not Quite Magnificent Week 11-1-25
Synchrony: Credit Card Bellwether 10-30-25
Credit Markets: Call Me After Trouble Arrives 10-27-25
The Curve: A Slow Pour of Tariffs 10-27-25
Market Commentary: Asset Returns 10-26-25
Existing Home Sales Sept 2025: Staying in a Tight Range 10-26-25
Mini Market Lookback: Absence of Bad News Reigns 10-25-25
CPI September 2025: Headline Up, Core Down 10-24-25
General Motors Update: Same Ride, Smooth Enough 10-23-25
Credit Markets: The Conan the Barbarian Rule 10-20-25
Mini Market Lookback: Healthy Banks, Mixed Economy, Poor Governance 10-18-25
Mini Market Lookback: Event Risk Revisited 10-11-25
Credit Profile: General Motors and GM Financial 10-9-25
Mini Market Lookback: Chess? Checkers? Set the game table on fire? 10-4-25
JOLTS Aug 2025: Tough math when “total unemployed > job openings” 9-30-25
Mini Market Lookback: Market Compartmentalization, Political Chaos 9-27-25
PCE August 2025: Very Slow Fuse 9-26-25
Durable Goods Aug 2025: Core Demand Stays Steady 9-25-25
2Q25 GDP Final Estimate: Big Upward Revision 9-25-25
New Homes Sales Aug 2025: Surprise Bounce, Revisions Ahead? 9-25-25
Mini Market Lookback: Easy Street 9-20-25
Home Starts August 2025: Bad News for Starts 9-17-25
Industrial Production Aug 2025: Capacity Utilization 9-16-25
Retail Sales Aug 2025: Resilience with Fraying Edges 9-16-25
Mini Market Lookback: Ugly Week in America, Mild in Markets 9-13-25
CPI August 2025: Slow Burn or Fleeting Adjustment? 9-11-25
PPI Aug 2025: For my next trick… 9-10-25
Mini Market Lookback: Job Trends Worst Since COVID 9-6-25