
Market Commentary: Asset Returns 10-26-25
A solid asset return week driven by equities and credit spread compression with a mixed UST curve.


Time to redo the Lincoln Bedroom…
Equities posted an excellent week while credit spreads compressed again. A mixed week for the UST curve still allowed all 7 bond ETFs we track to remain positive. Our group of 32 benchmarks and ETFs posted a positive-to-negative score of 29-3 with the recent beaten-down lines and some weaker YTD performers bouncing back for the week, including E&P (XOP) and BDCs (BIZD).
The YTD winners in return rankings are still weighted toward the tech-centric, but the Utilities ETF (XLU) made the top 3 and Industrials (XLI) beat the S&P 500 in the top quartile YTD. With large cap benchmark S&P 500 at a YTD return of +16.7%, that index will need a very strong finish to match the returns of 2024 and 2023. The Russell 2000 small caps remains a success story in 2025 and just missed the top quartile YTD with a very strong rolling 1-month and 3-month performance marking a notable comeback from earlier in the year.
A very big week in earnings is ahead with 5 of the Mag 7 reporting (MSFT, GOOGL, META, AAPL, AMZN) along with some bellwether industrial sector leaders such as Boeing and Caterpillar. Nucor will give some indications on how tariffs translated into steel pricing while CAT in particular will be interesting given all the outsized talk around investment commitments tied to “trade deals.”
A wave of Freight and Logistics operators weigh in this coming week (notably UPS and some leading REITs) while homebuilding industry leader D.R. Horton also reports. Other notables include Stellantis (shipments and revenues) and United Health with UNH results and guidance being delivered in the middle of the current health care premium chaos. The health care premium anxiety runs from ACA to employer plans and across Medicare and Medicaid.
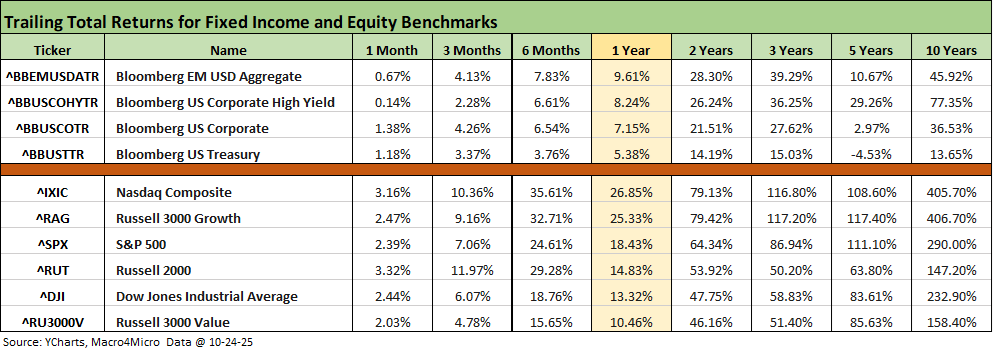
The above table updates the rolling time horizon returns for our high-level debt and equity benchmarks. This week’s returns take all the line items back to positive with the exception of the trailing 5-years for UST as the inflation spike, tightening cycle, and UST curve shift took a toll on that return math.
The rolling return visual
In the next section, we get into the details of the 32 ETFs and benchmarks for a mix of trailing periods. Below we offer a condensed 4-chart view for an easy visual on how the mix of positive vs. negative returns shape up. This is a useful exercise we do each week looking for signals across industry groups and asset classes.
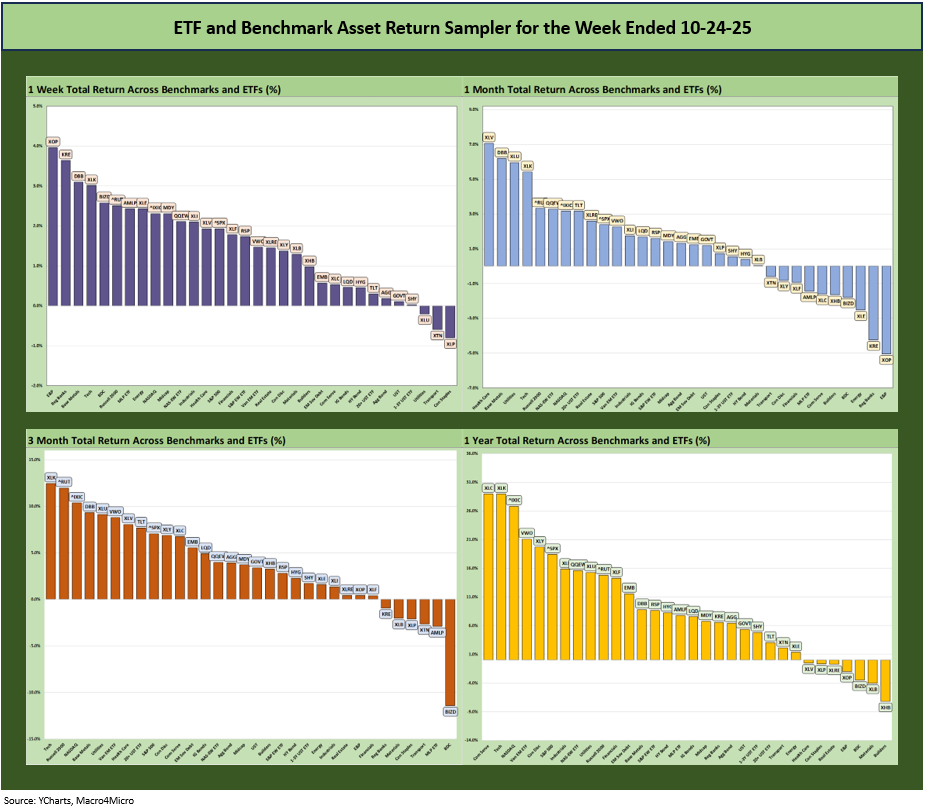
The return symmetry in the above 4 charts is overwhelmingly positive with additional details further below. The past 1-month numbers were only slightly noisy with energy lagging before this week’s rally and BDCs (BIZD) feeling the headline pressure that also flowed over to Regional Banks (KRE).
The Magnificent 7 heavy ETFs…
Some of the benchmarks and industry ETFs we include have issuer concentration elements that leave them wagged by a few names. When looking across some of the bellwether industry and subsector ETFs in the rankings, it is good to keep in mind which narrow ETFs (vs. broad market benchmarks) get wagged more by the “Magnificent 7” including Consumer Discretionary (XLY) with Amazon and Tesla, Tech (XLK) with Microsoft, Apple, and NVIDIA, and Communications Services (XLC) with Alphabet and Meta.
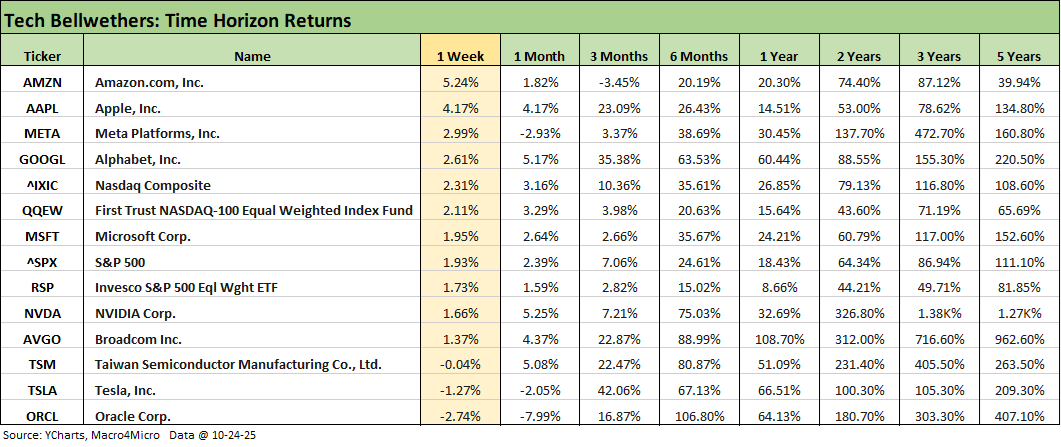
We already looked at the tech bellwethers for the week in our Mini Market Lookback: Absence of Bad News Reigns (10-25-25). This group will see a wave of earnings with 5 of the Mag 7 reporting. In the above table, we see 5 of the Mag 7 ahead of the S&P 500 for the week while 4 of the Mag 7 beat the NASDAQ. The chips leaders had an off week.
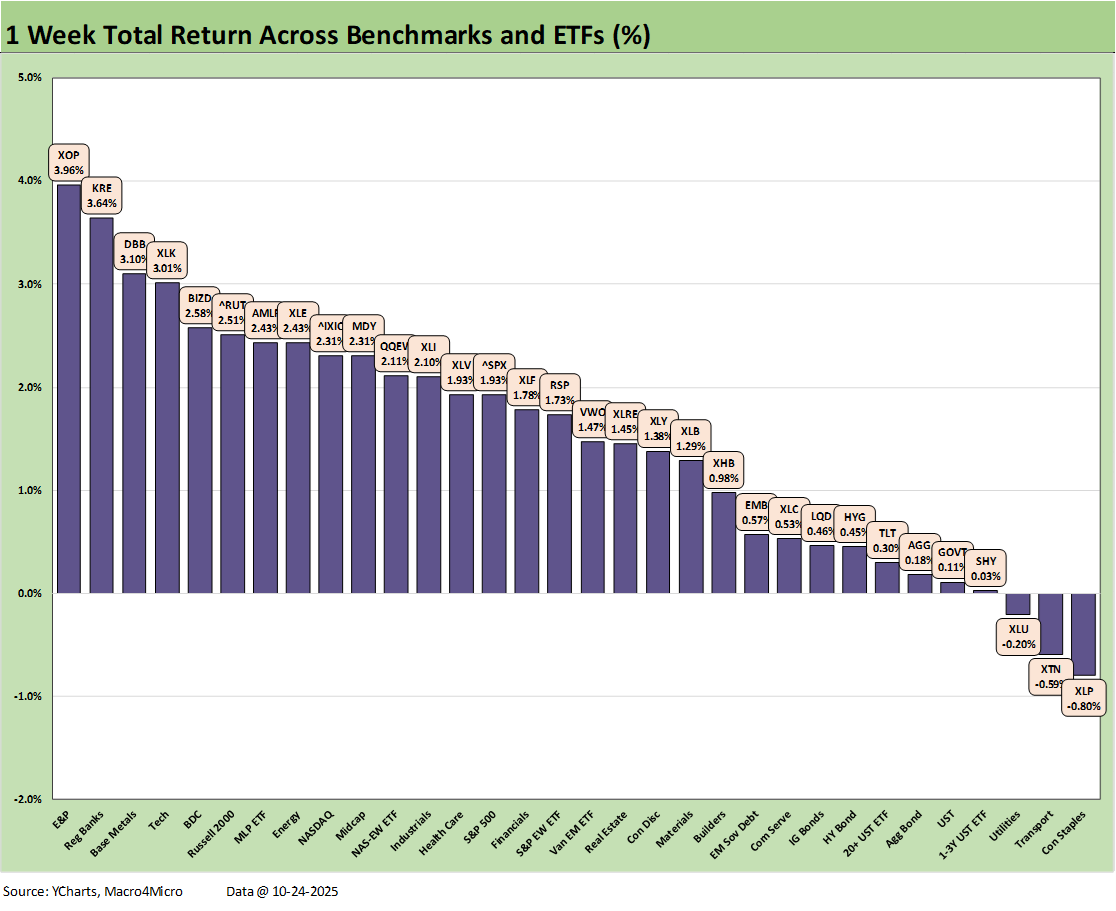
We looked at the 1-week returns for our group of 32 benchmarks and ETFs in our Mini Market Lookback: Absence of Bad News Reigns (10-25-25). The 29-3 score leaves little doubt on the week’s trend. A mixed UST curve saw 5 of the 7 bond ETFs in the bottom quartile but all in positive range.
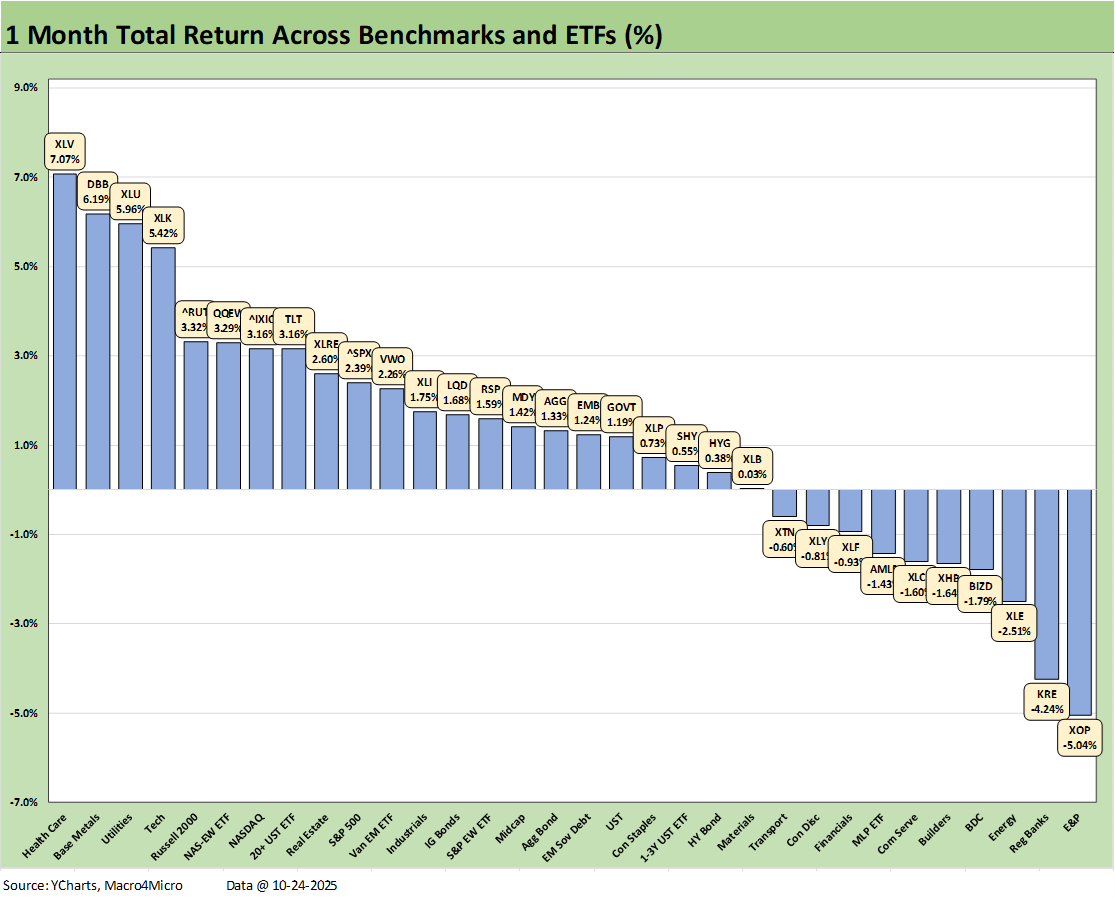
The 1-month score of 22-10 shows the bottom quartile all in negative range with weaker oil prices for much of the month (before this past week’s rebound) leaving the volatile E&P ETF (XOP), Energy ETF (XLE) and Midstream Energy ETF (AMLP) in the red and in the bottom quartile. The private credit market noise that has been hitting the headlines undermined Regional Banks (KRE) and BDCs (BIZD) while some mixed earnings reports for regional banks led to some extrapolation excess.
We highlight that all the bond ETFs were positive for the 1-month numbers with the long duration Ust ETF (TLT) even cracking the top quartile. The top 3 performers in the top quartile did not even include a tech name as the Health Care ETF (XLV) rode some strong pharma numbers to #1. Sitting at #2 is Base Metals (DBB) which is not a bad cyclical signal while Utilities (XLU) took #3. Tech (XLK), NASDAQ and the Equal Weight NASDAQ 100 (QQEW) landed in the top quartile in a clear reminder of firm tech equity performance. Russell 2000 also made the top tier.
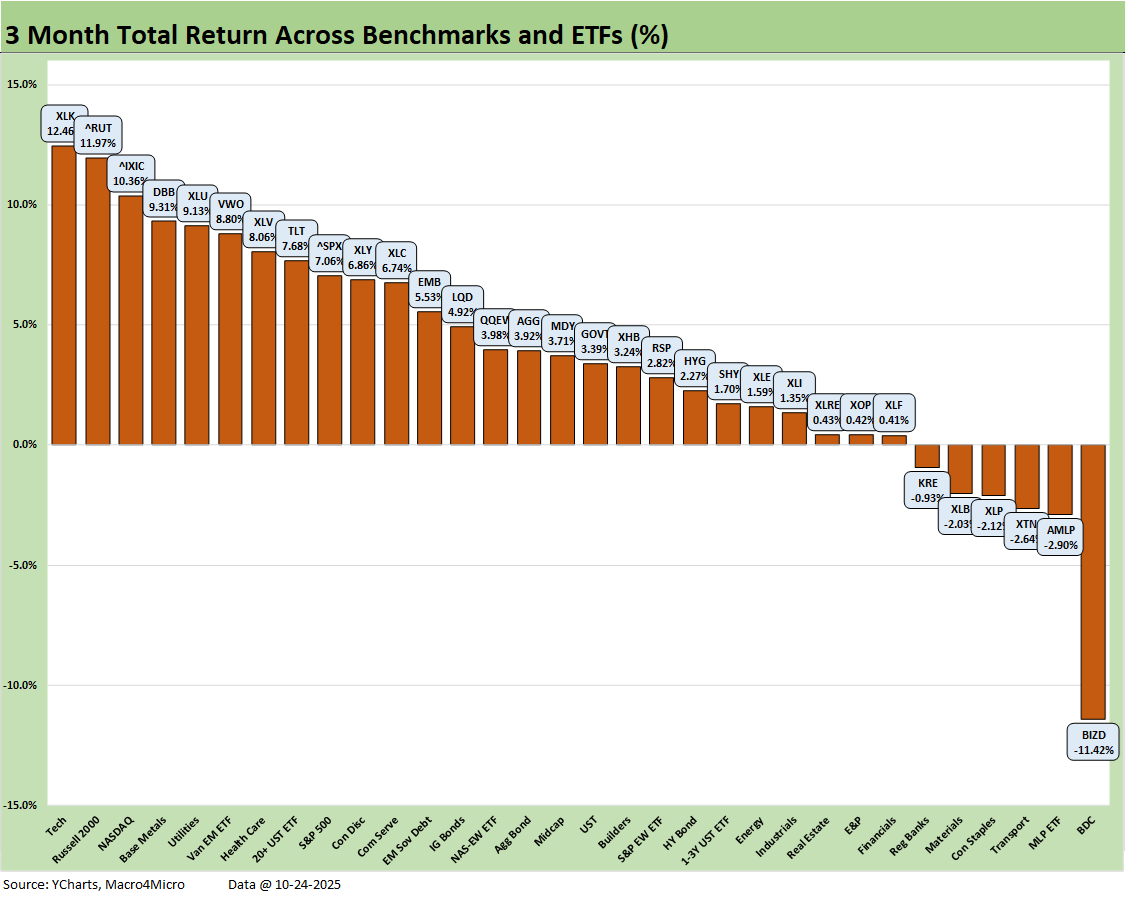
The 3-month score sheet shows 26 positive and 6 negative with an outlier in the red zone with the BDC ETF (BIZD) in dead last at -11.4% while the BIZD YTD return was -6.6% (and also last place). The wave of headlines around private credit largely focused on the First Brands and Tricolor meltdowns. The First Brands collapse touched more nerves since the news has alleged fraud (sounds like more than “alleged” at this point). The nature of the problems called into question the quality of due diligence and the need for better “credit maintenance work.” Add in Jamie Dimon’s cockroach metaphor and market anxiety was turbocharged.
The BDC earnings season (some this week and a major wave in the first week of November) should be reassuring with more detail and color to grab onto by holders. The BIZD dividend yield at almost 12% is like many BDC yields. The question from here is quality of marks and the impact of lower interest income on floating rate adjustments. The capital structures and layers vary and the same for the mix of fixed and unsecured bonds locked in at low rates. Performance of BDC equities have varied widely over the past few years as do the management teams and quality of risk management. The September quarter will be a very interesting period after this latest bout of volatility.
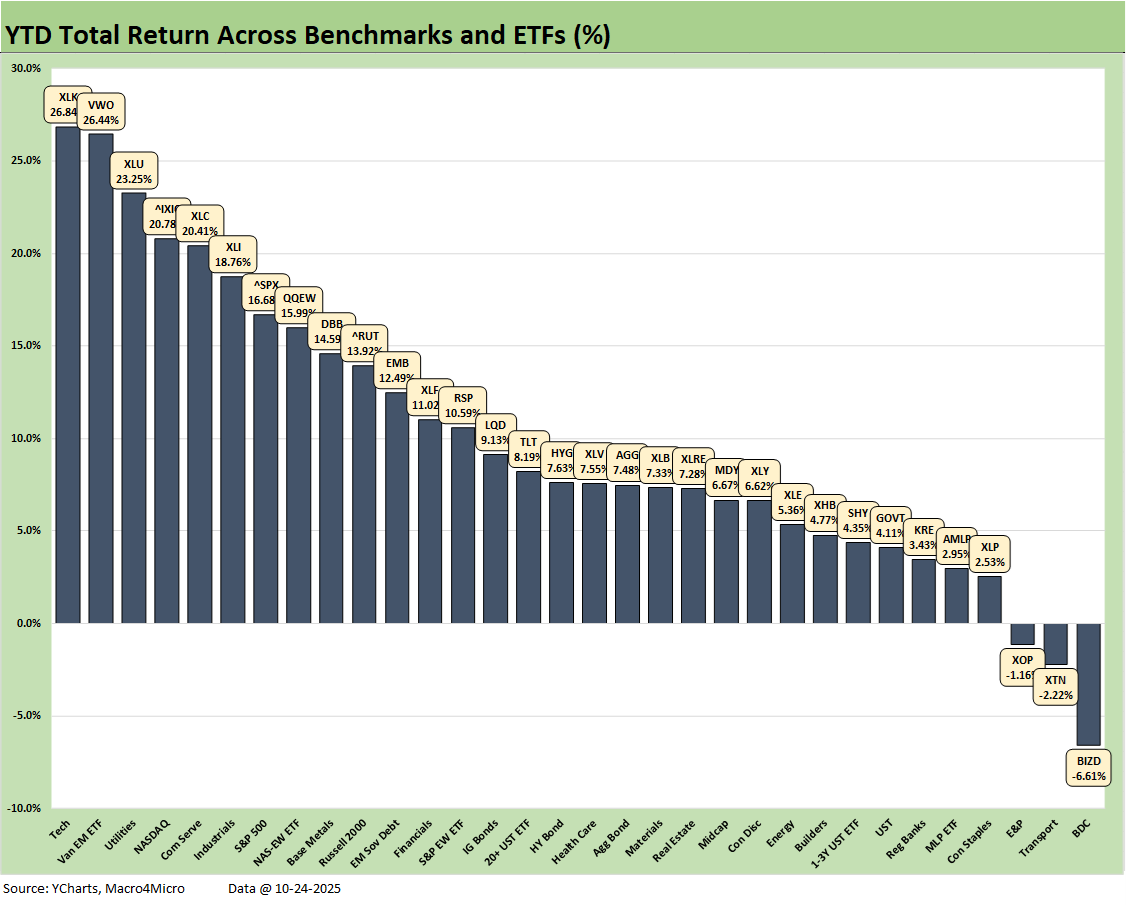
The YTD return score was 29-3, which certainly qualifies as a good outcome so far. We see the BDC ETF (BIZD) in last place again with Transports (XTN) and E&P (XOP) the only 3 in negative range. The bond ETFs are all positive with 4 in the second quartile (EMB, LQD, TLT, and HYG), a single bond ETF in the third quartile (AGG), and two in the bottom quartile (SHY, GOVT).
The winners are not surprising with Tech (XLK) at #1 and EM Equities at #2. We see 5 of the 8 in the top quartile heavily wagged by tech names even in the broad index weightings. The top tier includes XLK, NASDAQ, Communications Services (XLC), the S&P 500, and the Equal Weight NASDAQ 100 ETF (QQEW). Rounding out the top quartile is Utilities (XLU) at #3 and Industrials (XLI) at #6.
The S&P 500 in the top quartile posted a YTD return of 16.7%. That means the S&P 500 needs to put over 9 points on the board through year end to match the 2024 and 2023 annual S&P 500 return numbers.
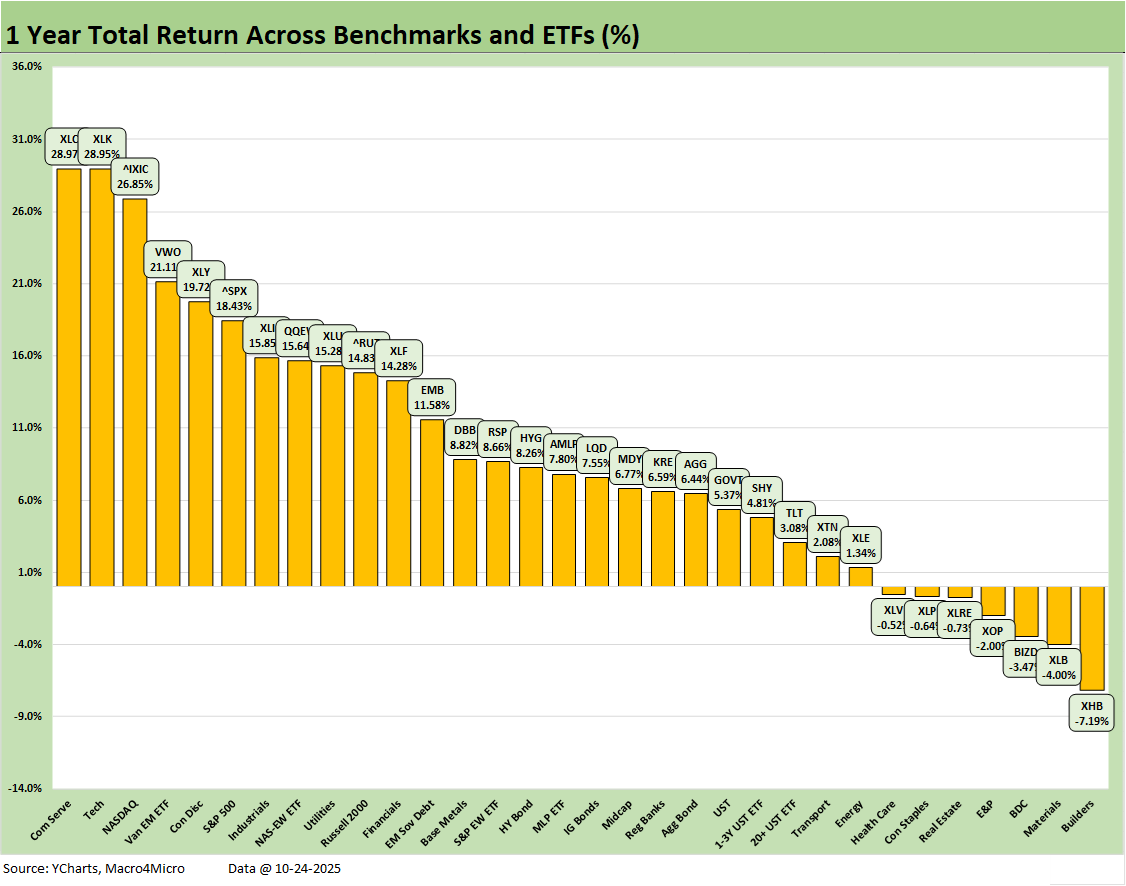
The 1-year returns stood at 25-7. We see Homebuilders (XHB) in last place at -7.2%. XHB saw the start of its sell-off in 4Q24. We see Materials (XLB) in second to last at -4.0%, which is not a vote of cyclical confidence. As discussed earlier, the BDC ETF (BIZD) headline defaults are setting off a lot of guilt-by-association nerves to go along with worries around the quality of due diligence and portfolio monitoring.
BIZD is down -3.5% for the LTM period with a mild rally this past week. The E&P ETF (XOP) is 4 slots off the bottom at -2.0% after a strong move this past week after oil prices popped on the Russian sanctions.
On the leaderboard, Communications Services (XLC) is #1 at just under 29%, essentially flat with the Tech ETF (XLK) at #2 and NASDAQ is #3 at 26.9%. EM Equities (VWO) and Consumer Discretionary (XLY) round out the top 5.
As covered in the prior YTD chart, the S&P 500 will need to finish 2025 in impressive fashion to match the 2024 (25%) and 2023 (26%) S&P 500 returns. It is doable, but it needs good news. The year 2024 was Part Two of the best 2-year run in the S&P 500 since the late 1990s, so that sets a high bar for the Trump stock market (see Footnotes & Flashbacks: Asset Returns for 2024 1-2-25).
Trump says the US was a “dead country” 10 months ago, so that raises the stakes on hitting those marks while selling that story line. The 25%+ returns on the S&P 500 in 2024 and 2023 struck us at least “somewhat alive” and not “mostly dead.”
See also:
Mini Market Lookback: Absence of Bad News Reigns 10-25-25
CPI September 2025: Headline Up, Core Down 10-24-25
General Motors Update: Same Ride, Smooth Enough 10-23-25
Credit Markets: The Conan the Barbarian Rule 10-20-25
The Curve: My Kingdom for 10 Cuts 10-19-25
Mini Market Lookback: Healthy Banks, Mixed Economy, Poor Governance 10-18-25
Mini Market Lookback: Event Risk Revisited 10-11-25
Credit Profile: General Motors and GM Financial 10-9-25
Mini Market Lookback: Chess? Checkers? Set the game table on fire? 10-4-25
JOLTS Aug 2025: Tough math when “total unemployed > job openings” 9-30-25
Mini Market Lookback: Market Compartmentalization, Political Chaos 9-27-25
PCE August 2025: Very Slow Fuse 9-26-25
Durable Goods Aug 2025: Core Demand Stays Steady 9-25-25
2Q25 GDP Final Estimate: Big Upward Revision 9-25-25
New Homes Sales Aug 2025: Surprise Bounce, Revisions Ahead? 9-25-25
Mini Market Lookback: Easy Street 9-20-25
FOMC: Curve Scenarios Take Wing, Steepen for Now 9-17-25
Home Starts August 2025: Bad News for Starts 9-17-25
Industrial Production Aug 2025: Capacity Utilization 9-16-25
Retail Sales Aug 2025: Resilience with Fraying Edges 9-16-25
Mini Market Lookback: Ugly Week in America, Mild in Markets 9-13-25
CPI August 2025: Slow Burn or Fleeting Adjustment? 9-11-25
PPI Aug 2025: For my next trick… 9-10-25
Mini Market Lookback: Job Trends Worst Since COVID 9-6-25